Growth in U.S. Dairy Product Exports to Southeast Asia Depends on Competition With Other Major Dairy Exporters
- by Jerry Cessna and Christopher G. Davis
- 2/1/2021
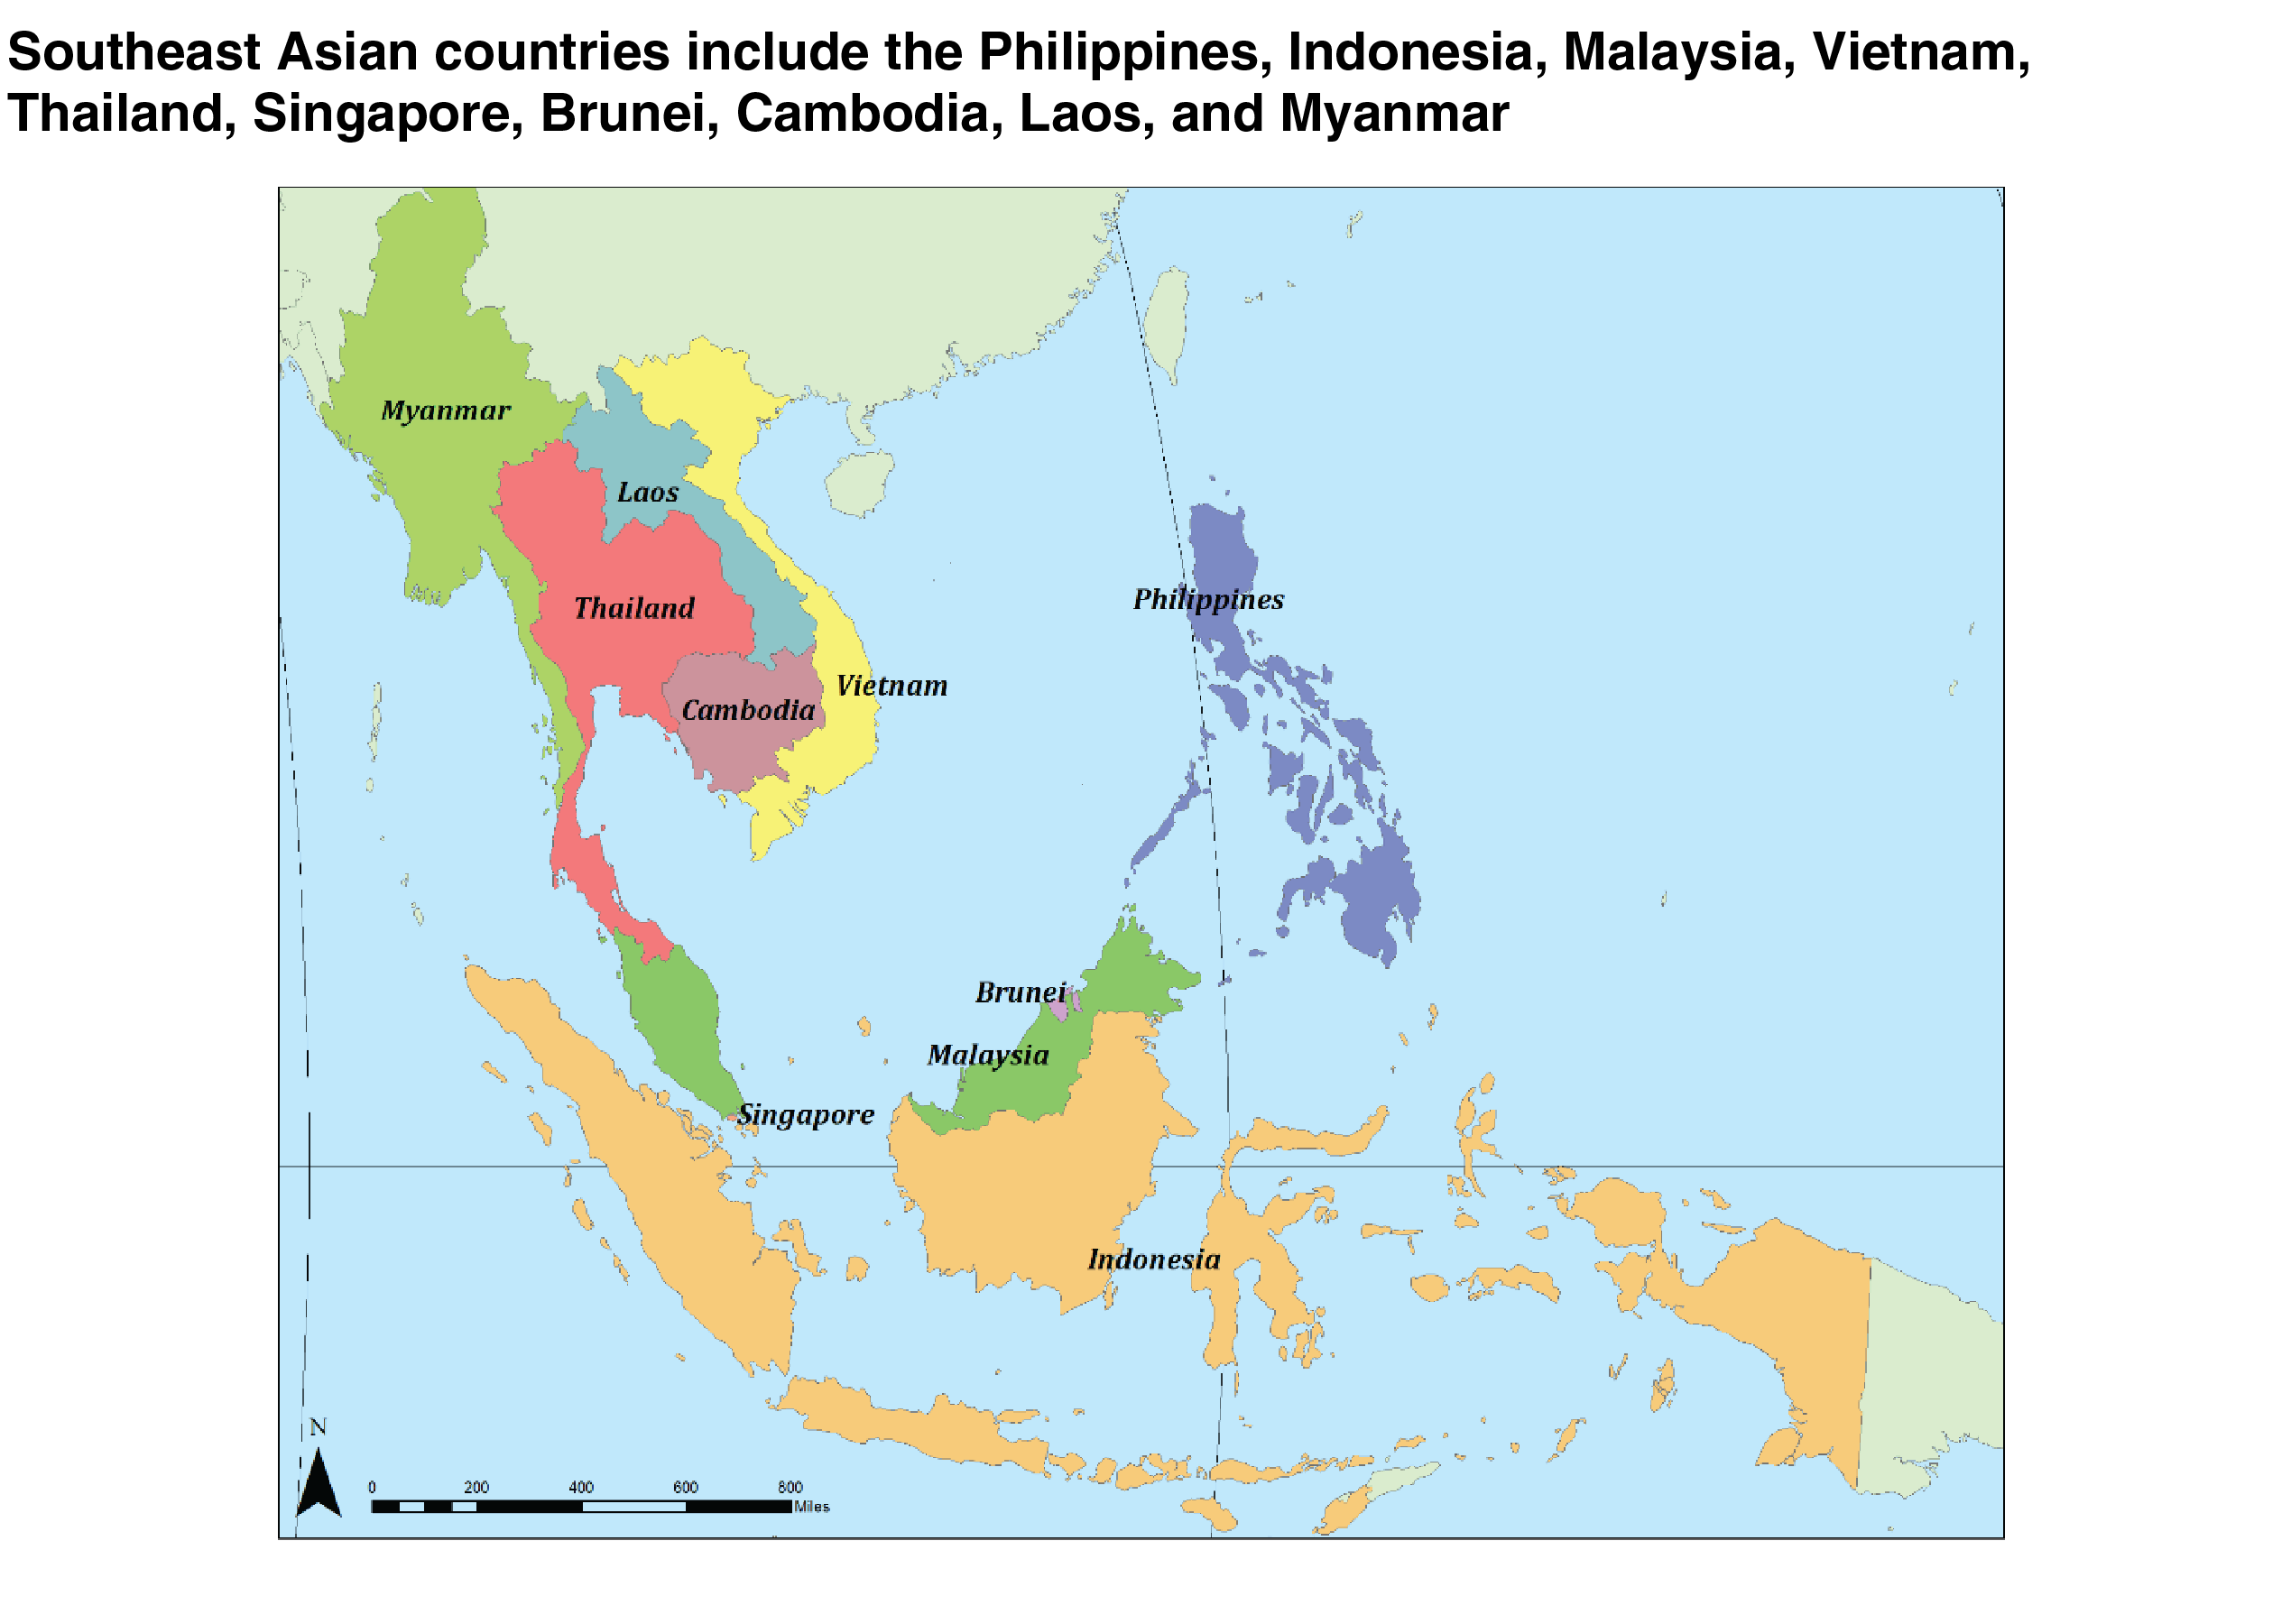
Southeast Asia is a region characterized by rapid economic growth, urbanization, and changing food consumption patterns. From 2006 to 2018, the population of the region’s 10 nations (see map below) increased more than 14 percent. Over that same period, the region’s gross domestic product (GDP) grew 81 percent, driving up GDP on a per capita basis by 59 percent. With incomes rising throughout the region, Southeast Asian countries have begun following a dietary transition that is common throughout Asia. Under this shift, per capita consumption of foods, such as meat and dairy products has tended to rise, while consumption of staple foods, such as rice and coarse grains, has fallen.
Most Southeast Asian countries produce small quantities of milk. High-production milk cow breeds do not perform well in the hot, humid conditions that exist in much of the region, and many countries do not have adequate grassland for much milk production. With strong economic growth expected and a limited potential for increased milk production, Southeast Asian countries have become highly desirable markets for exporters of dairy products.
How much have Southeast Asian dairy product imports grown in recent years, and what dairy products does the region import?
To meet the region’s growing demand for dairy products, total Southeast Asian dairy product imports grew from $3.8 billion in 2006 (adjusted for inflation) to $6.3 billion in 2018. Southeast Asia’s dairy imports from the United States grew from $401 million (also adjusted for inflation) to $738 million over that same period. U.S. shipments of dairy to Southeast Asia were about 15 percent of total U.S. dairy exports in 2018.
Southeast Asian dairy product imports, ranked in order by 2018 import value as shown in the table below, include skim milk powder, whole milk powder, infant formula, butterfat products (including butter, anhydrous milk fat, butteroil, and high-fat dairy spreads), cheese, whey products, and other dairy products. Other dairy products (as aggregated in the figure below) include fluid milk and cream, ice cream, evaporated and condensed milk, lactose, yogurt, casein products, and miscellaneous dairy products. The United States is a major supplier of skim milk powder, whey products, cheese, and lactose to the region. These four categories accounted for 85 percent of U.S. dairy exports to the region in 2018.
| Product import values (millions of dollars) | ||||
|---|---|---|---|---|
| 2006 | 2018 | |||
| Product | All trading partners | United States | All trading partners | United States |
| Skim milk powder | 1,074.3 | 237.3 | 1,337.4 | 381.6 |
| Whole milk powder | 946.9 | 17.9 | 1,018.2 | 57.3 |
| Infant formula | 358.0 | 0.4 | 838.2 | 5.8 |
| Butterfat products | 232.6 | 0.9 | 798.0 | 3.0 |
| Cheese | 188.8 | 10.1 | 642.0 | 72.5 |
| Whey products | 310.1 | 70.3 | 504.8 | 113.5 |
| Other dairy products | 708.8 | 64.1 | 1,207.2 | 104.7 |
| Total | 3,819.5 | 401.0 | 6,345.6 | 738.3 |
|
Notes: Adjusted for inflation using 2018 dollars. Totals may not add precisely due to rounding. Import data are used for countries that report such data. Southeast Asian countries include Philippines, Indonesia, Malaysia, Vietnam, Thailand, Singapore, Brunei, Cambodia, Laos, and Myanmar. For countries that do not have data reported in the Global Trade Atlas, export data of trading partners are used. Sources: USDA, Economic Research Service calculations, Global Trade Atlas, Trade Data Monitor, and U.S. Bureau of Labor Statistics. |
||||
How do imports of dairy products compare from one Southeast Asian country to another?
There is wide diversity in incomes across the Southeast Asian region. Countries with relatively low milk production per capita, such as those in Southeast Asia, are more likely to have greater import needs as incomes rise. Singapore, with income per capita among the highest in the world, has been consuming milk products in greater quantities for decades. A similar dietary transition is in its earliest stages in countries with low incomes—such as Myanmar, Cambodia, and Laos. The rest of the countries—Indonesia, Thailand, the Philippines, Malaysia, Vietnam, and Brunei—are in the middle of the dietary transition. These differences influence the rate of growth and the mix of dairy products consumed in each country.
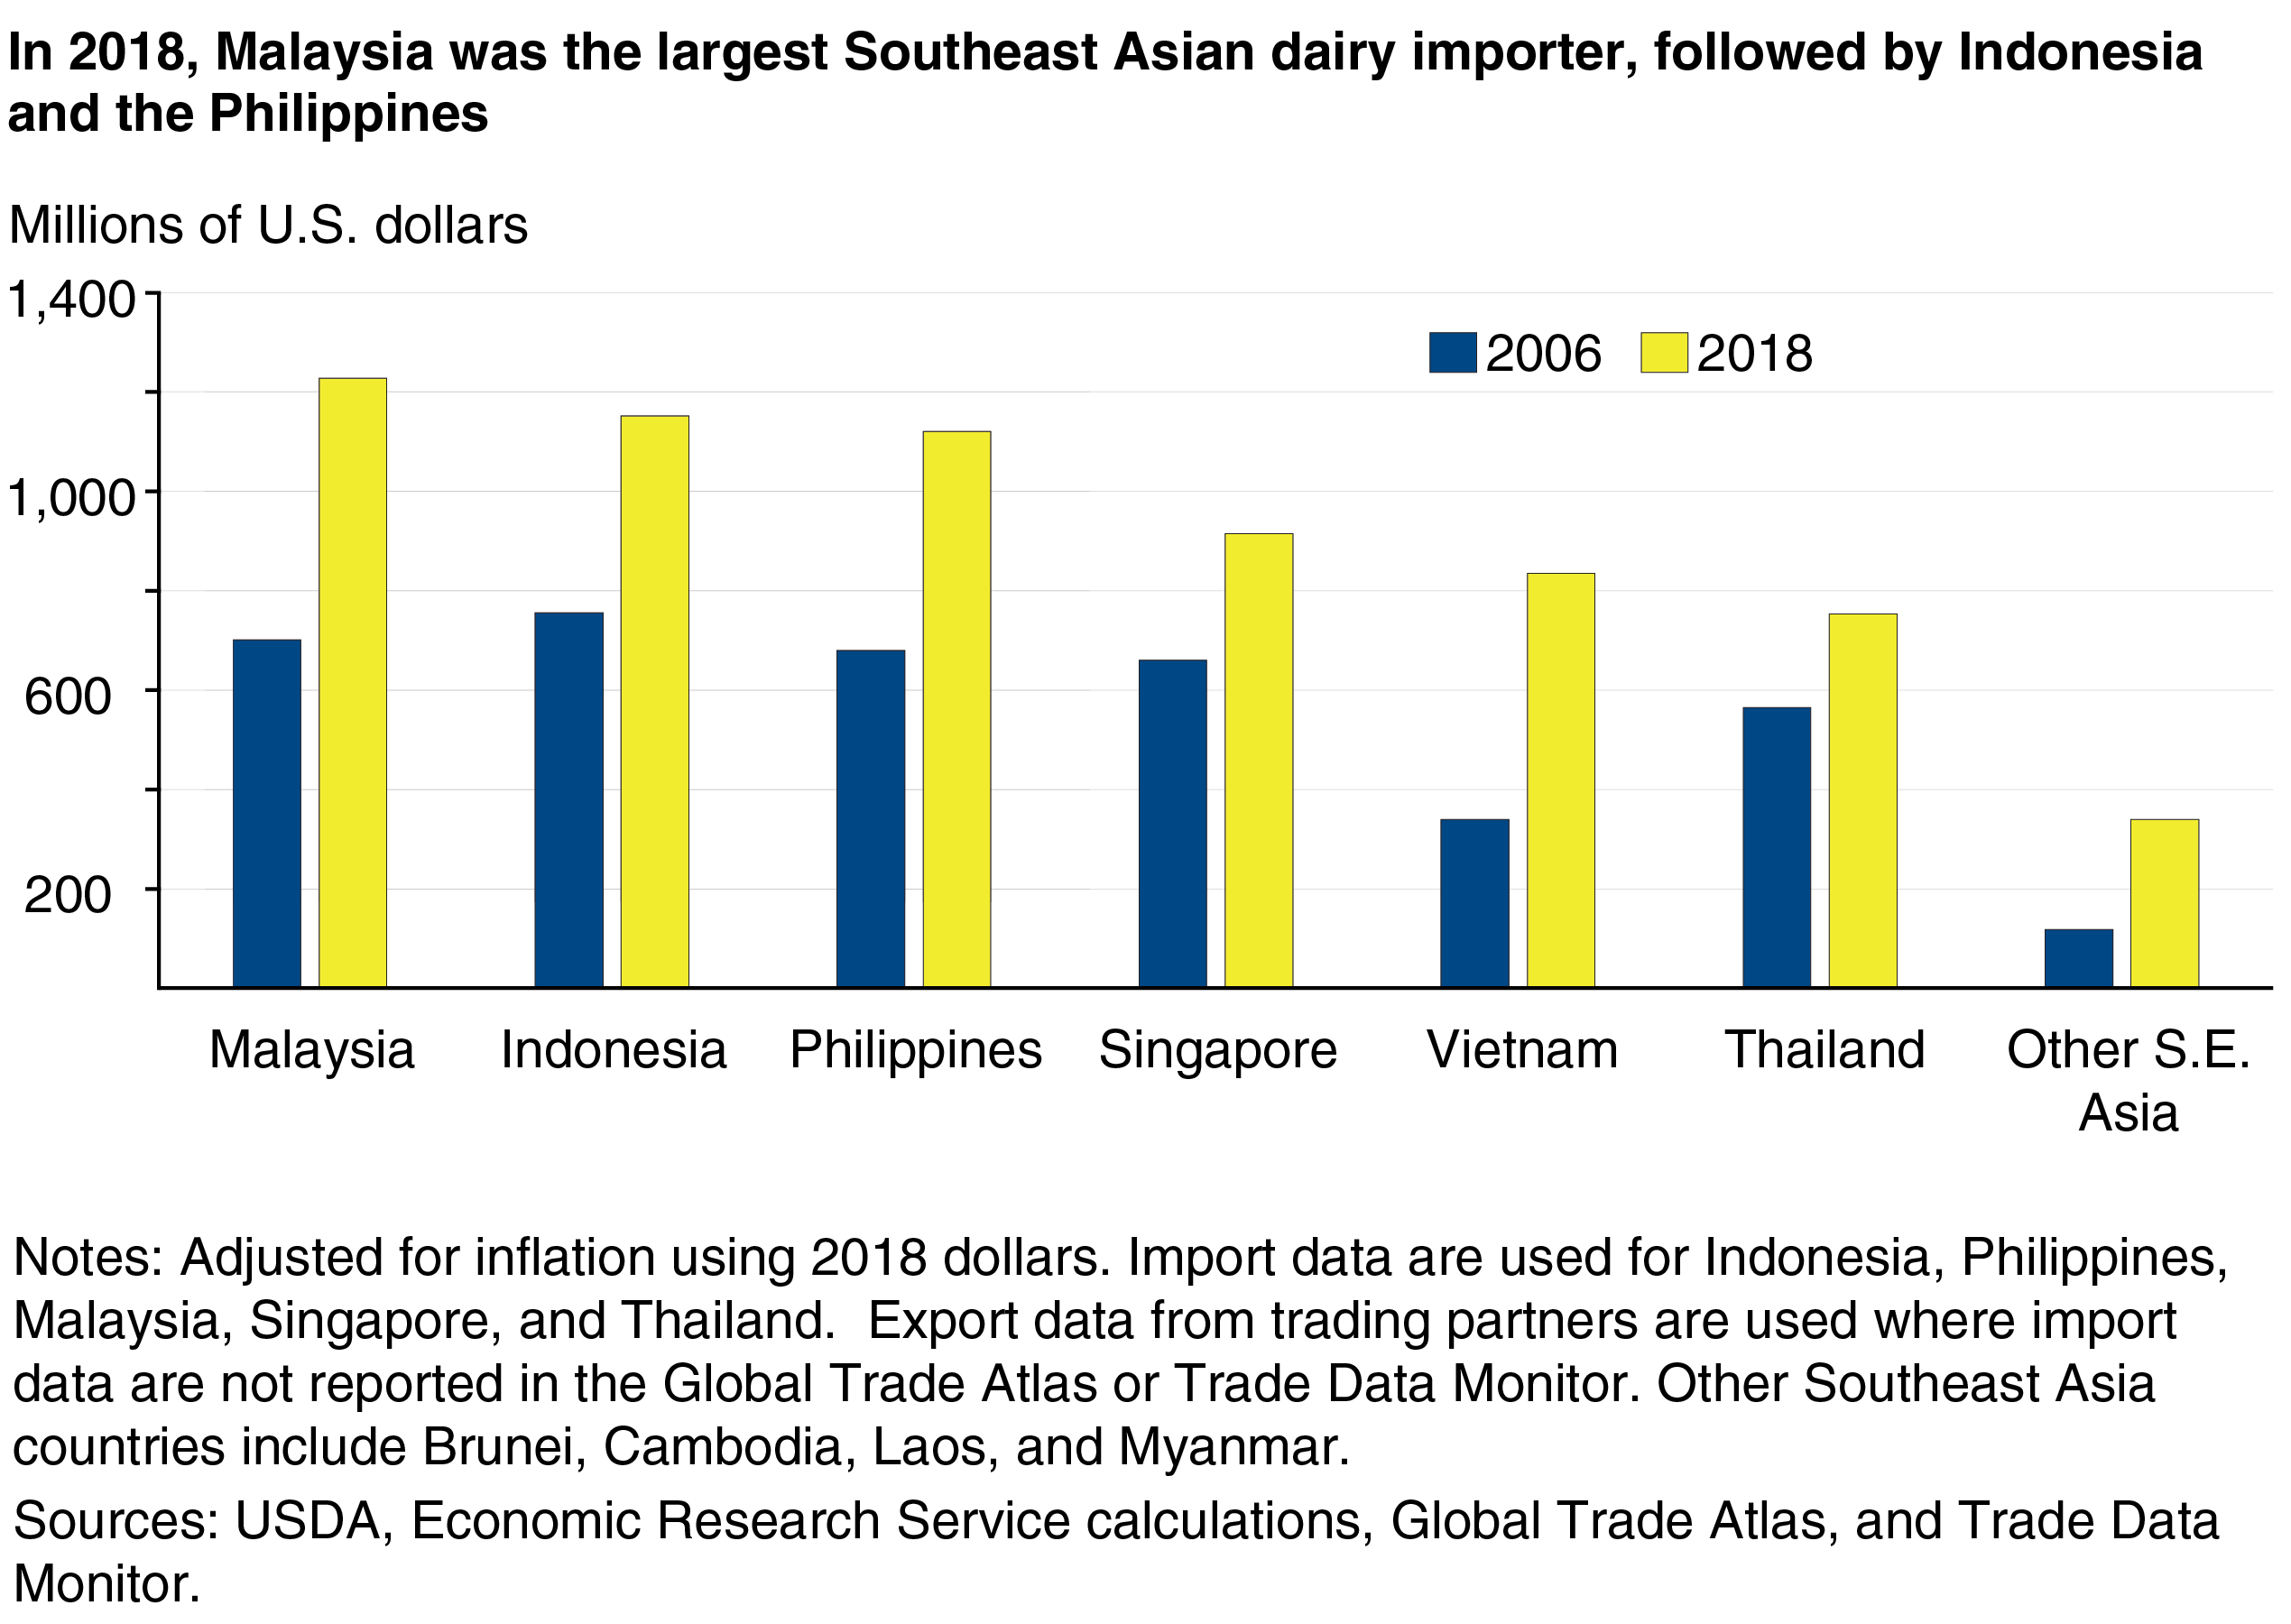
From 2006 to 2018, total dairy values imported from all origins grew for the top six Southeast Asian dairy importing countries (see chart below). In 2018, Malaysia imported more dairy products than any other Southeast Asian country, followed by Indonesia and the Philippines.
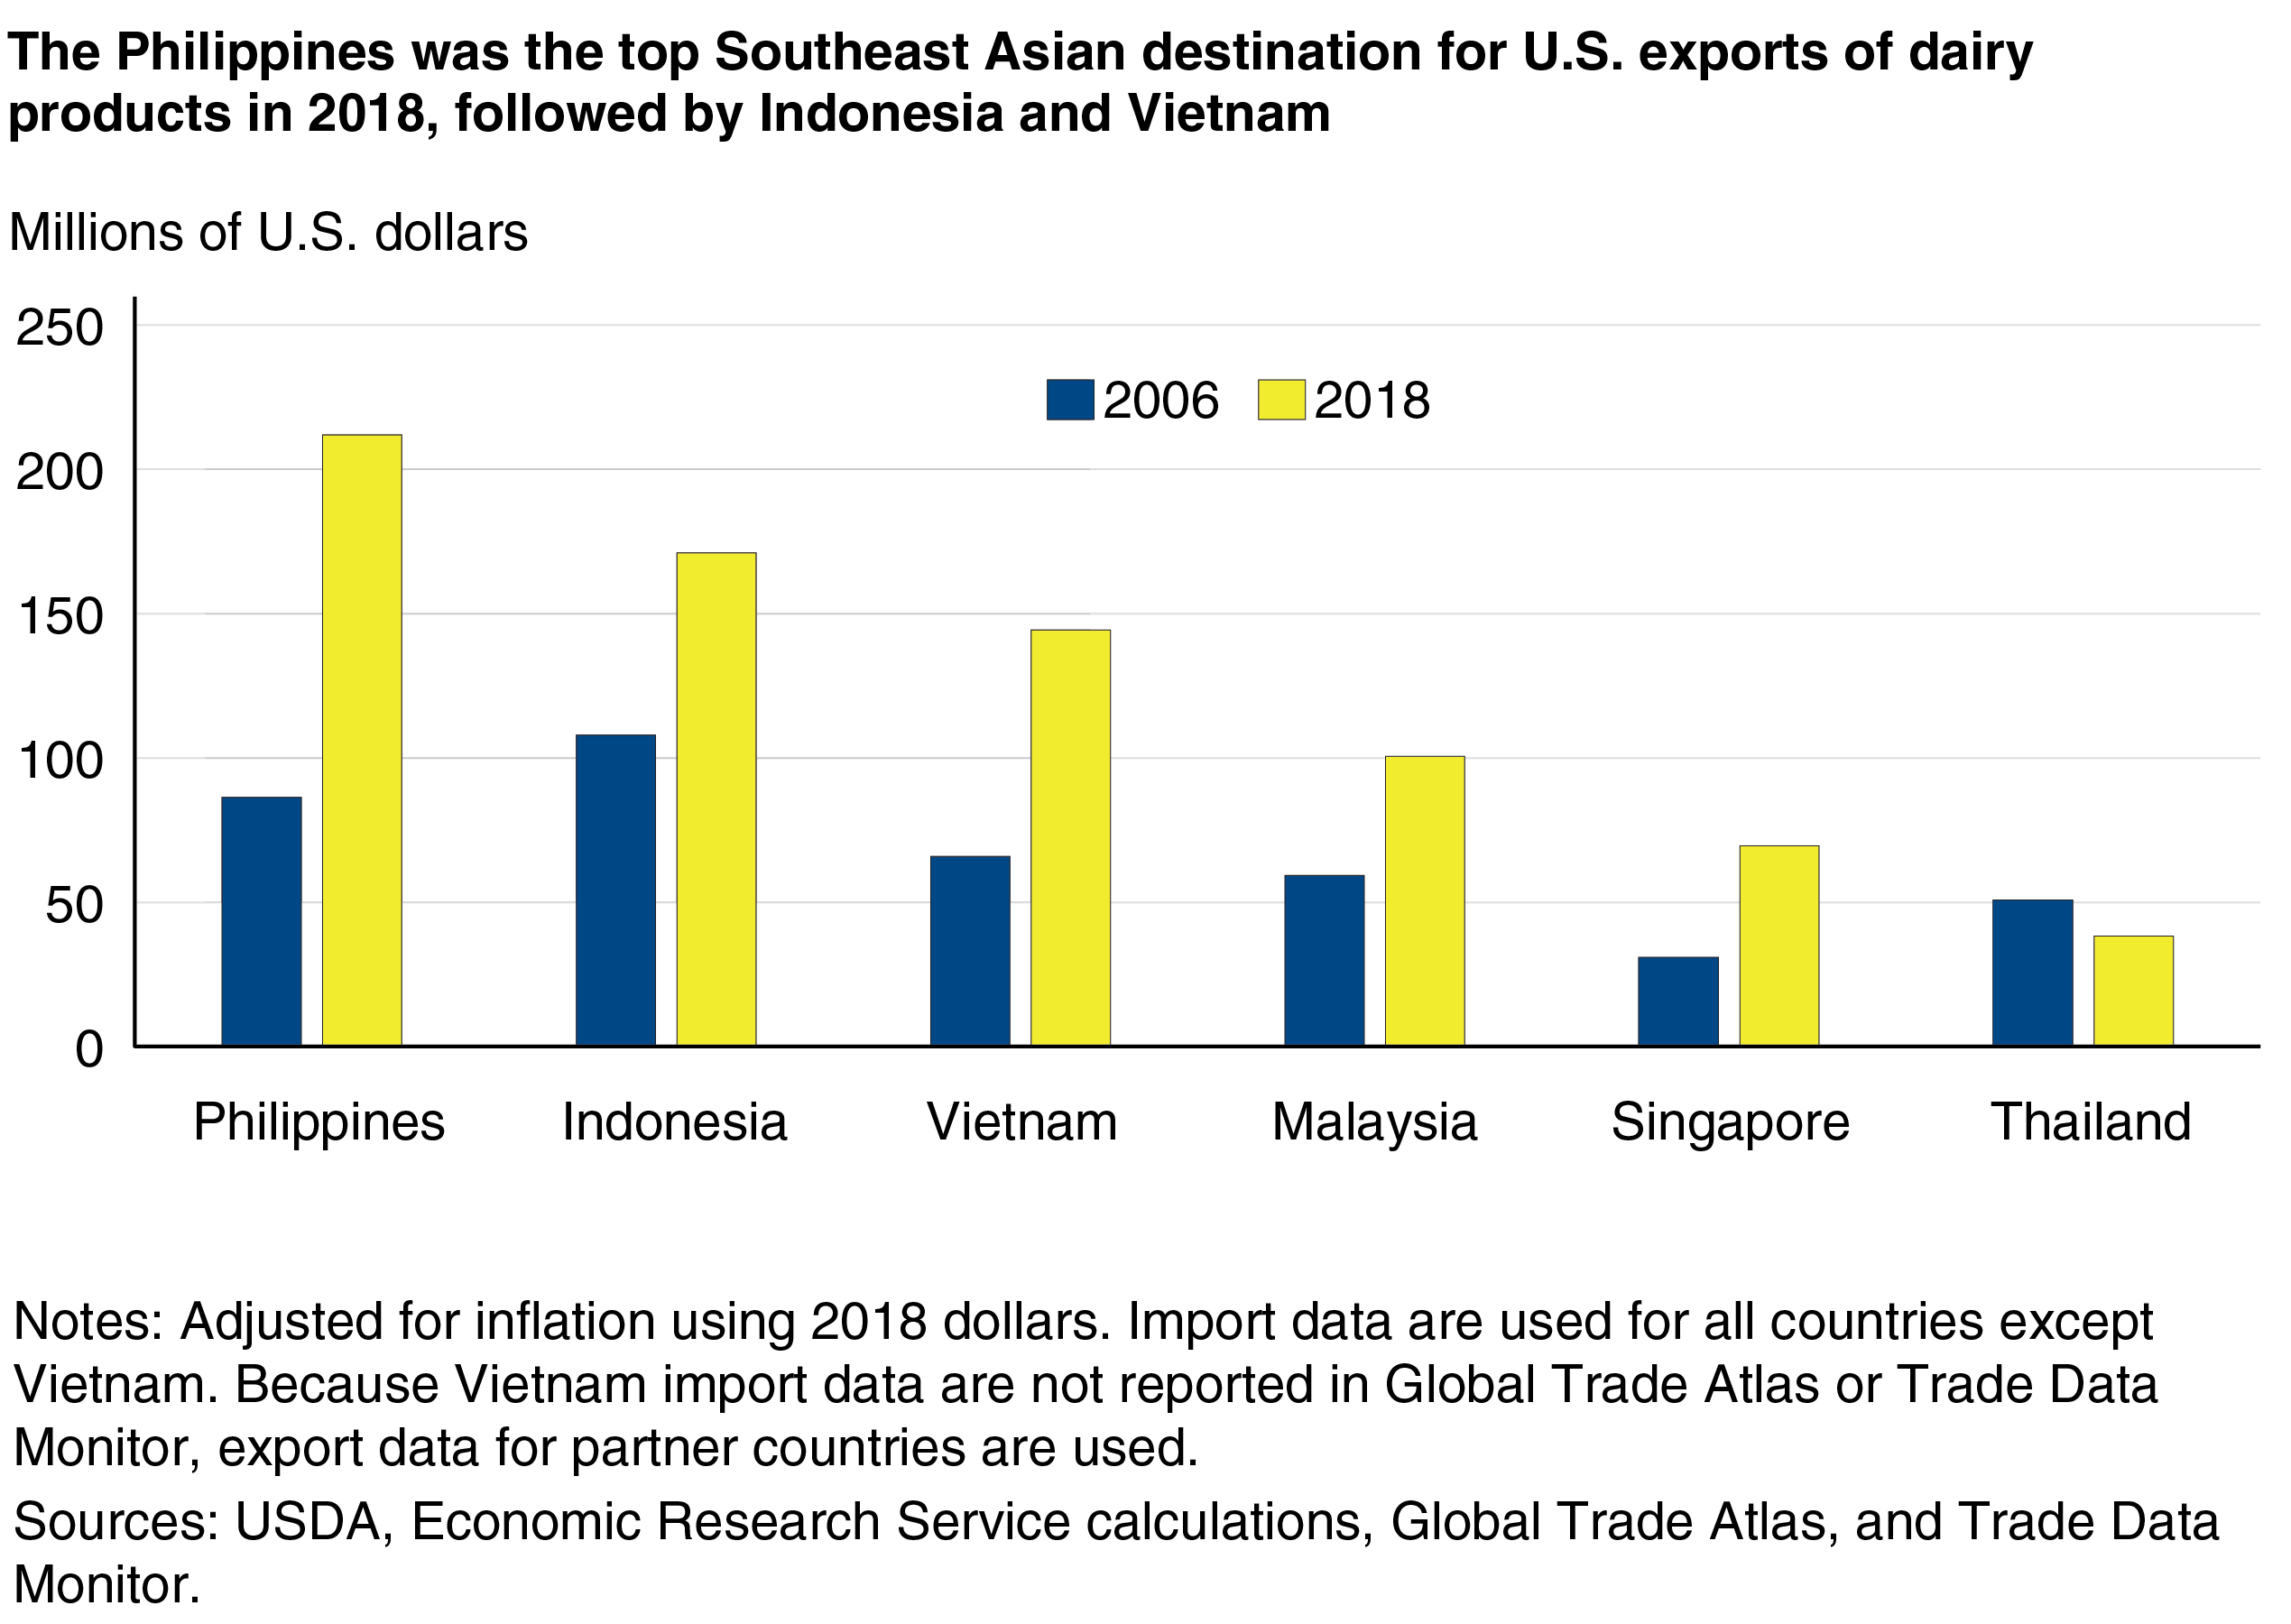
For U.S. exports of dairy products in 2018, the Philippines was the top Southeast Asian destination, followed by Indonesia and Vietnam (see chart below). From 2006 to 2018, values of Southeast Asian imports of dairy products from the United States grew for five of the top six Southeast Asian major dairy importing countries.
How do Southeast Asian imports of dairy products from the United States compare with Southeast Asian dairy imports from competitors?
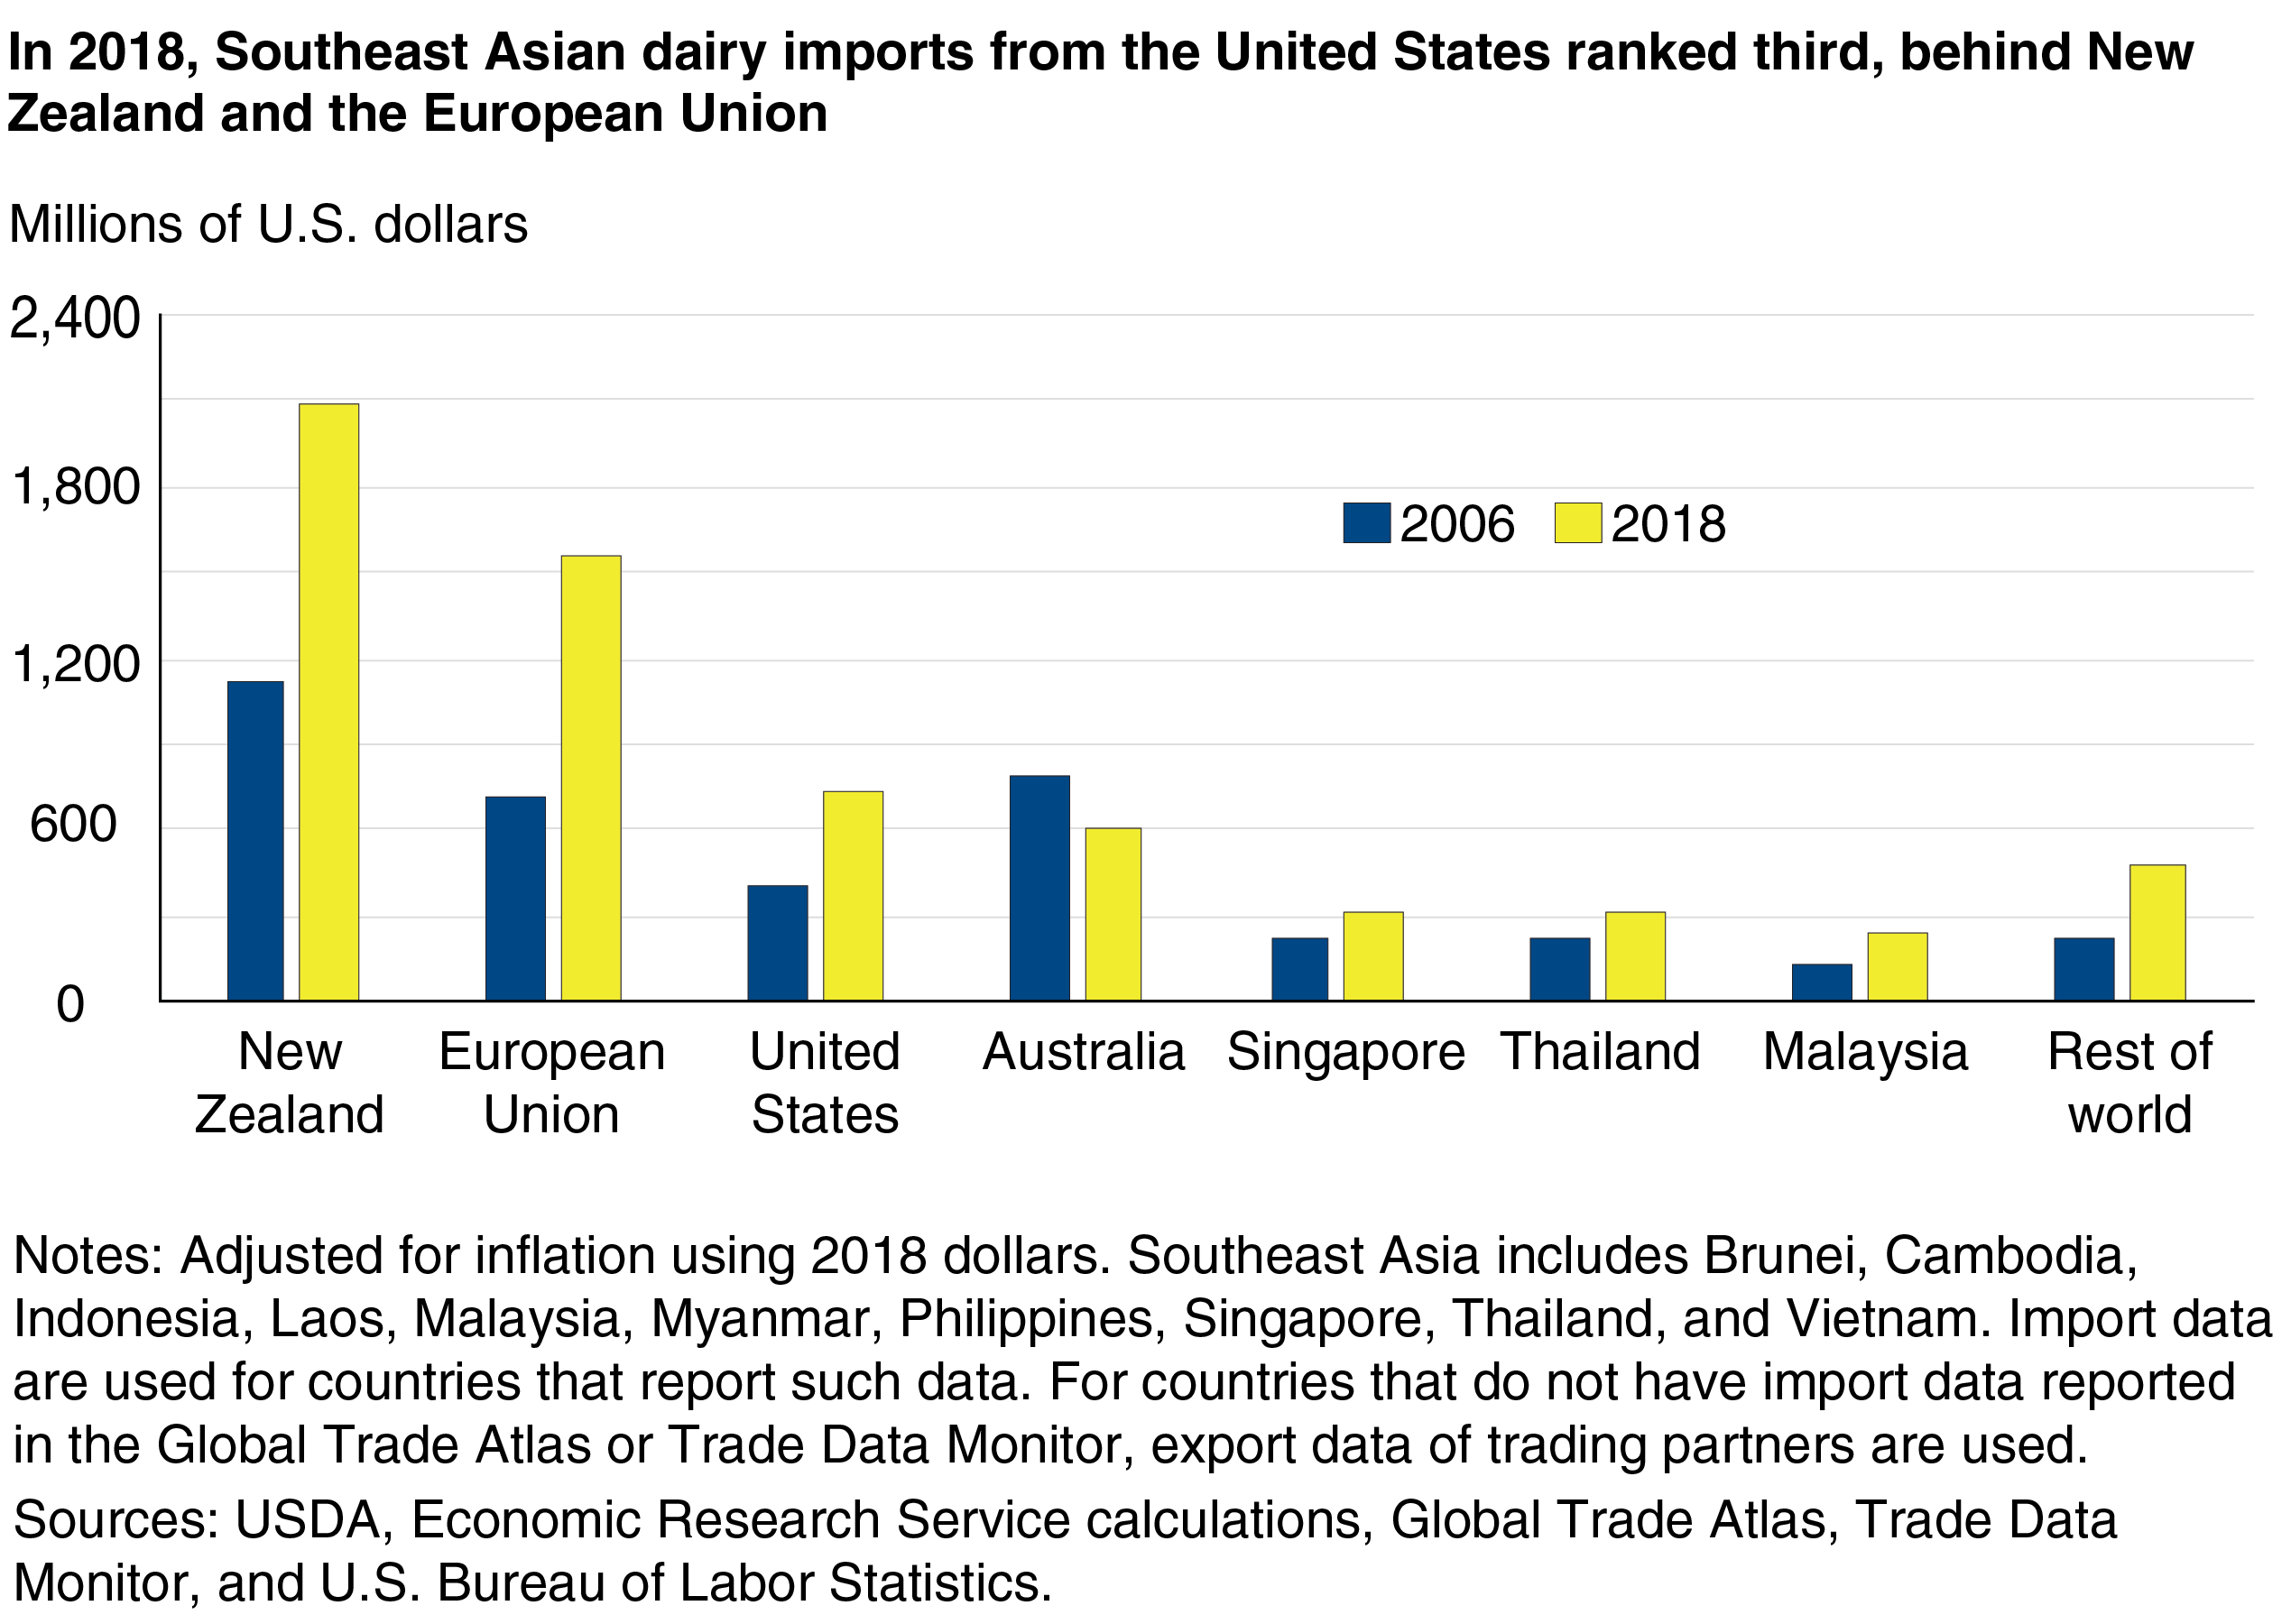
While Southeast Asian imports of dairy products from the United States grew from 2006 to 2018, they also grew from New Zealand and the European Union. Dairy imports from Australia decreased over that time, however, and Australia fell in rank from third to fourth. Years of drought in Australia reduced forage, resulting in lower milk yields and smaller dairy herds. At the same time, the United States rose from fourth to third. Additionally, Southeast Asian countries also import dairy products from their Southeast Asian neighbors, as well as the rest of the world.
There are significant differences in the composition of Southeast Asian dairy products imported from each supplier. In 2018, skim milk powder was the top product imported to the region from the EU, the United States, and Australia. In these countries, residents consume proportionally high quantities of products with high milk-fat content such as cheese and butter, leaving significant quantities of products with high skim-solids content, such as skim milk powder and whey products, to be exported.
Whole milk powder was the top dairy product that New Zealand exported to the region in 2018. About 95 percent of New Zealand’s milk is exported in some form, making the industry in that nation almost entirely export-focused. Through its sales of whole milk powder, New Zealand is able to export both milk fat and skim milk solids.
Singapore was the top supplier of infant formula to the region. Singapore has virtually no milk production, so manufacturers of dairy products from that nation use dairy ingredients from other countries. Imports of dairy products such as ice cream, evaporated milk, and yogurt largely came from countries within the region (Thailand and Malaysia) because these products are both bulky (with high water content) and perishable, and therefore expensive and difficult to transport long distances.
| Trading Partner | Skim milk powder |
Whole milk powder |
Infant formula |
Butterfat products |
Cheese | Whey products |
Other dairy products |
Value per partner |
Percent per partner |
|---|---|---|---|---|---|---|---|---|---|
| New Zealand | 304.3 | 761.1 | 29.1 | 538.3 | 221.4 | 20.6 | 209.5 | 2,084.3 | 32.8 |
| European Union | 431.2 | 104.5 | 166.8 | 153.0 | 153.7 | 288.6 | 259.4 | 1,557.2 | 24.5 |
| United States | 381.6 | 57.3 | 5.8 | 3.0 | 72.5 | 113.5 | 104.7 | 738.3 | 11.6 |
| Australia | 171.5 | 44.6 | 20.5 | 58.0 | 144.8 | 32.7 | 129.8 | 601.9 | 9.5 |
| Singapore | 1.7 | 6.1 | 292.8 | 0.5 | 5.9 | 0.4 | 10.8 | 318.1 | 5.0 |
| Thailand | 2.6 | 8.0 | 84.5 | 2.2 | 3.3 | 3.2 | 210.1 | 313.8 | 4.9 |
| Malaysia | 10.3 | 16.7 | 82.1 | 9.6 | 1.4 | 1.3 | 129.1 | 250.4 | 3.9 |
| Rest of World | 34.3 | 20.0 | 156.6 | 33.6 | 38.8 | 44.5 | 153.8 | 481.5 | 7.6 |
| Value per product | 1,337.4 | 1,018.2 | 838.2 | 798.0 | 642.0 | 504.8 | 1,207.2 | 6,345.6 | 100.0 |
| Percent per product | 21.1 | 16.0 | 13.2 | 12.6 | 10.1 | 8.0 | 19.0 | 100.0 | |
|
Notes: Totals may not add precisely due to rounding. Import data are used for countries that report such data. Southeast Asian countries include Philippines, Indonesia, Malaysia, Vietnam, Thailand, Singapore, Brunei, Cambodia, Laos, and Myanmar. For countries that do not have data reported in the Global Trade Atlas, export data of trading partners are used. Sources: USDA, Economic Research Service calculations, Global Trade Atlas, and Trade Data Monitor. |
|||||||||
Tariffs affect prices and can impact importers’ decisions to purchase from a particular country. As members of the World Trade Organization (WTO), each country in Southeast Asia assesses tariffs on U.S. dairy products as allowed under the WTO unless a preferential trade agreement exists between the countries.
Southeast Asian countries have several free trade agreements with countries outside the region. Southeast Asia's free trade agreement with Australia and New Zealand is the most important for Asian dairy trade in that region. Under this arrangement, tariffs were phased out for most dairy products imported from New Zealand and Australia. Although Southeast Asian importers buying from the United States often pay higher import tariffs than buyers importing from competing countries, many continue to buy from the United States. Differences in quality and customer service from one supplier to another may influence decisions to purchase products from the United States despite the higher tariffs.
How sensitive are Southeast Asia’s imports of dairy products from the United States to prices and dairy product expenditures?
To study trade patterns for Southeast Asia’s dairy imports, USDA, Economic Research Service (ERS) economists used a statistical model to study consumer demand, prices, and expenditures for imports of dairy products of five Southeast Asian countries. They studied monthly import data from 2006 to 2016—including volumes, values, and tariff rates—for the Philippines, Indonesia, Malaysia, Singapore, and Vietnam. Sensitivity measurements, known as elasticities, were calculated for prices of dairy products from each supplying country, prices of dairy products from competing suppliers, and dairy import expenditures of importing countries.
ERS researchers found that Southeast Asia’s imports of dairy products from the United States depend on prices of U.S. products as well as prices of competing countries. The region’s imports of dairy products from the United States also depend on how much each country spends to import each type of dairy product.
Results of the study indicated that Malaysia and Singapore consumers were the most sensitive to changes in U.S. cheese prices, while Malaysia and Indonesia were the most sensitive to changes in U.S. skim milk powder prices. Malaysian consumers were also sensitive to fluctuations in U.S. whey product prices. In some cases, Southeast Asia’s demand for U.S. dairy products increased or decreased significantly in response to price changes for products from competing suppliers, such as the EU, Australia, and New Zealand.
If past trends continue, the analysis shows that rising dairy import expenditures in Southeast Asia could lead to higher or lower U.S. market shares, depending on the product and country. Assuming dairy import expenditures grow in Southeast Asia and follow current patterns of consumption, the United States could gain market share for cheese in Indonesia; whey products in Malaysia, Singapore, and the Philippines; skim milk powder in Indonesia and Vietnam; and lactose in the Philippines, Indonesia, and Malaysia. By contrast, the United States could lose market share for cheese imports in the Philippines, Malaysia, and Singapore. Although imports of cheese from the United States could grow for these countries, cheese imports from other trading partners may grow at a faster rate.
How are estimates from these analyses useful?
Estimates from this import demand analysis could be useful for studying the effects of changes in prices that are due to market forces as well as trade policies. The expenditure sensitivity measurements could inform dairy industry stakeholders about how market shares for the United States and its competitors are likely to change as Southeast Asian importers increase import expenditures for each type of dairy product.
This article is drawn from:
- Davis, C.G. & Cessna, J. (2020). Prospects for Growth in U.S. Dairy Exports to Southeast Asia. U.S. Department of Agriculture, Economic Research Service. ERR-278.
You may also like:
- Cessna, J., Kuberka, L., Davis, C.G. & Hoskin, R. (2016). Growth of U.S. Dairy Exports. U.S. Department of Agriculture, Economic Research Service. LDPM-270-01.
We’d welcome your feedback!
Would you be willing to answer a few quick questions about your experience?


