

USDA’s Supplemental Nutrition Assistance Program (SNAP) Contributed to Rural Economic Output, Jobs Following the Great Recession
- by Cristina Miller, Katherine Ralston and Stephen Vogel
- 12/7/2021
USDA’s Supplemental Nutrition Assistance Program (SNAP) provides low-income U.S. households assistance to buy food items. As the Nation’s largest food and nutrition assistance program, SNAP also helps support the economy during periods of high unemployment. Households with gross income below 130 percent of the federal poverty level and net income below 100 percent of that level become eligible to participate in the program. In a recent report, researchers at USDA’s Economic Research Service (ERS) studied the effect SNAP benefits had on the rural and urban economies during the 6-year period (2009–14) of high unemployment following the Great Recession. They found household spending of SNAP benefits contributed disproportionately more to the rural economy than to the urban economy. According to a previous ERS study, participants spend the benefits soon after receiving them. While participants can spend SNAP benefits only on food items, benefits also free up money for SNAP households to spend on other items. ERS researchers recently found SNAP benefits spent on farm goods such as fruits, vegetables, and milk, and processed foods such as breads and pastas, as well as the additional money spent on nonfood items, caused a ripple effect that helped support local jobs and contributed to economic output (production of goods and services).
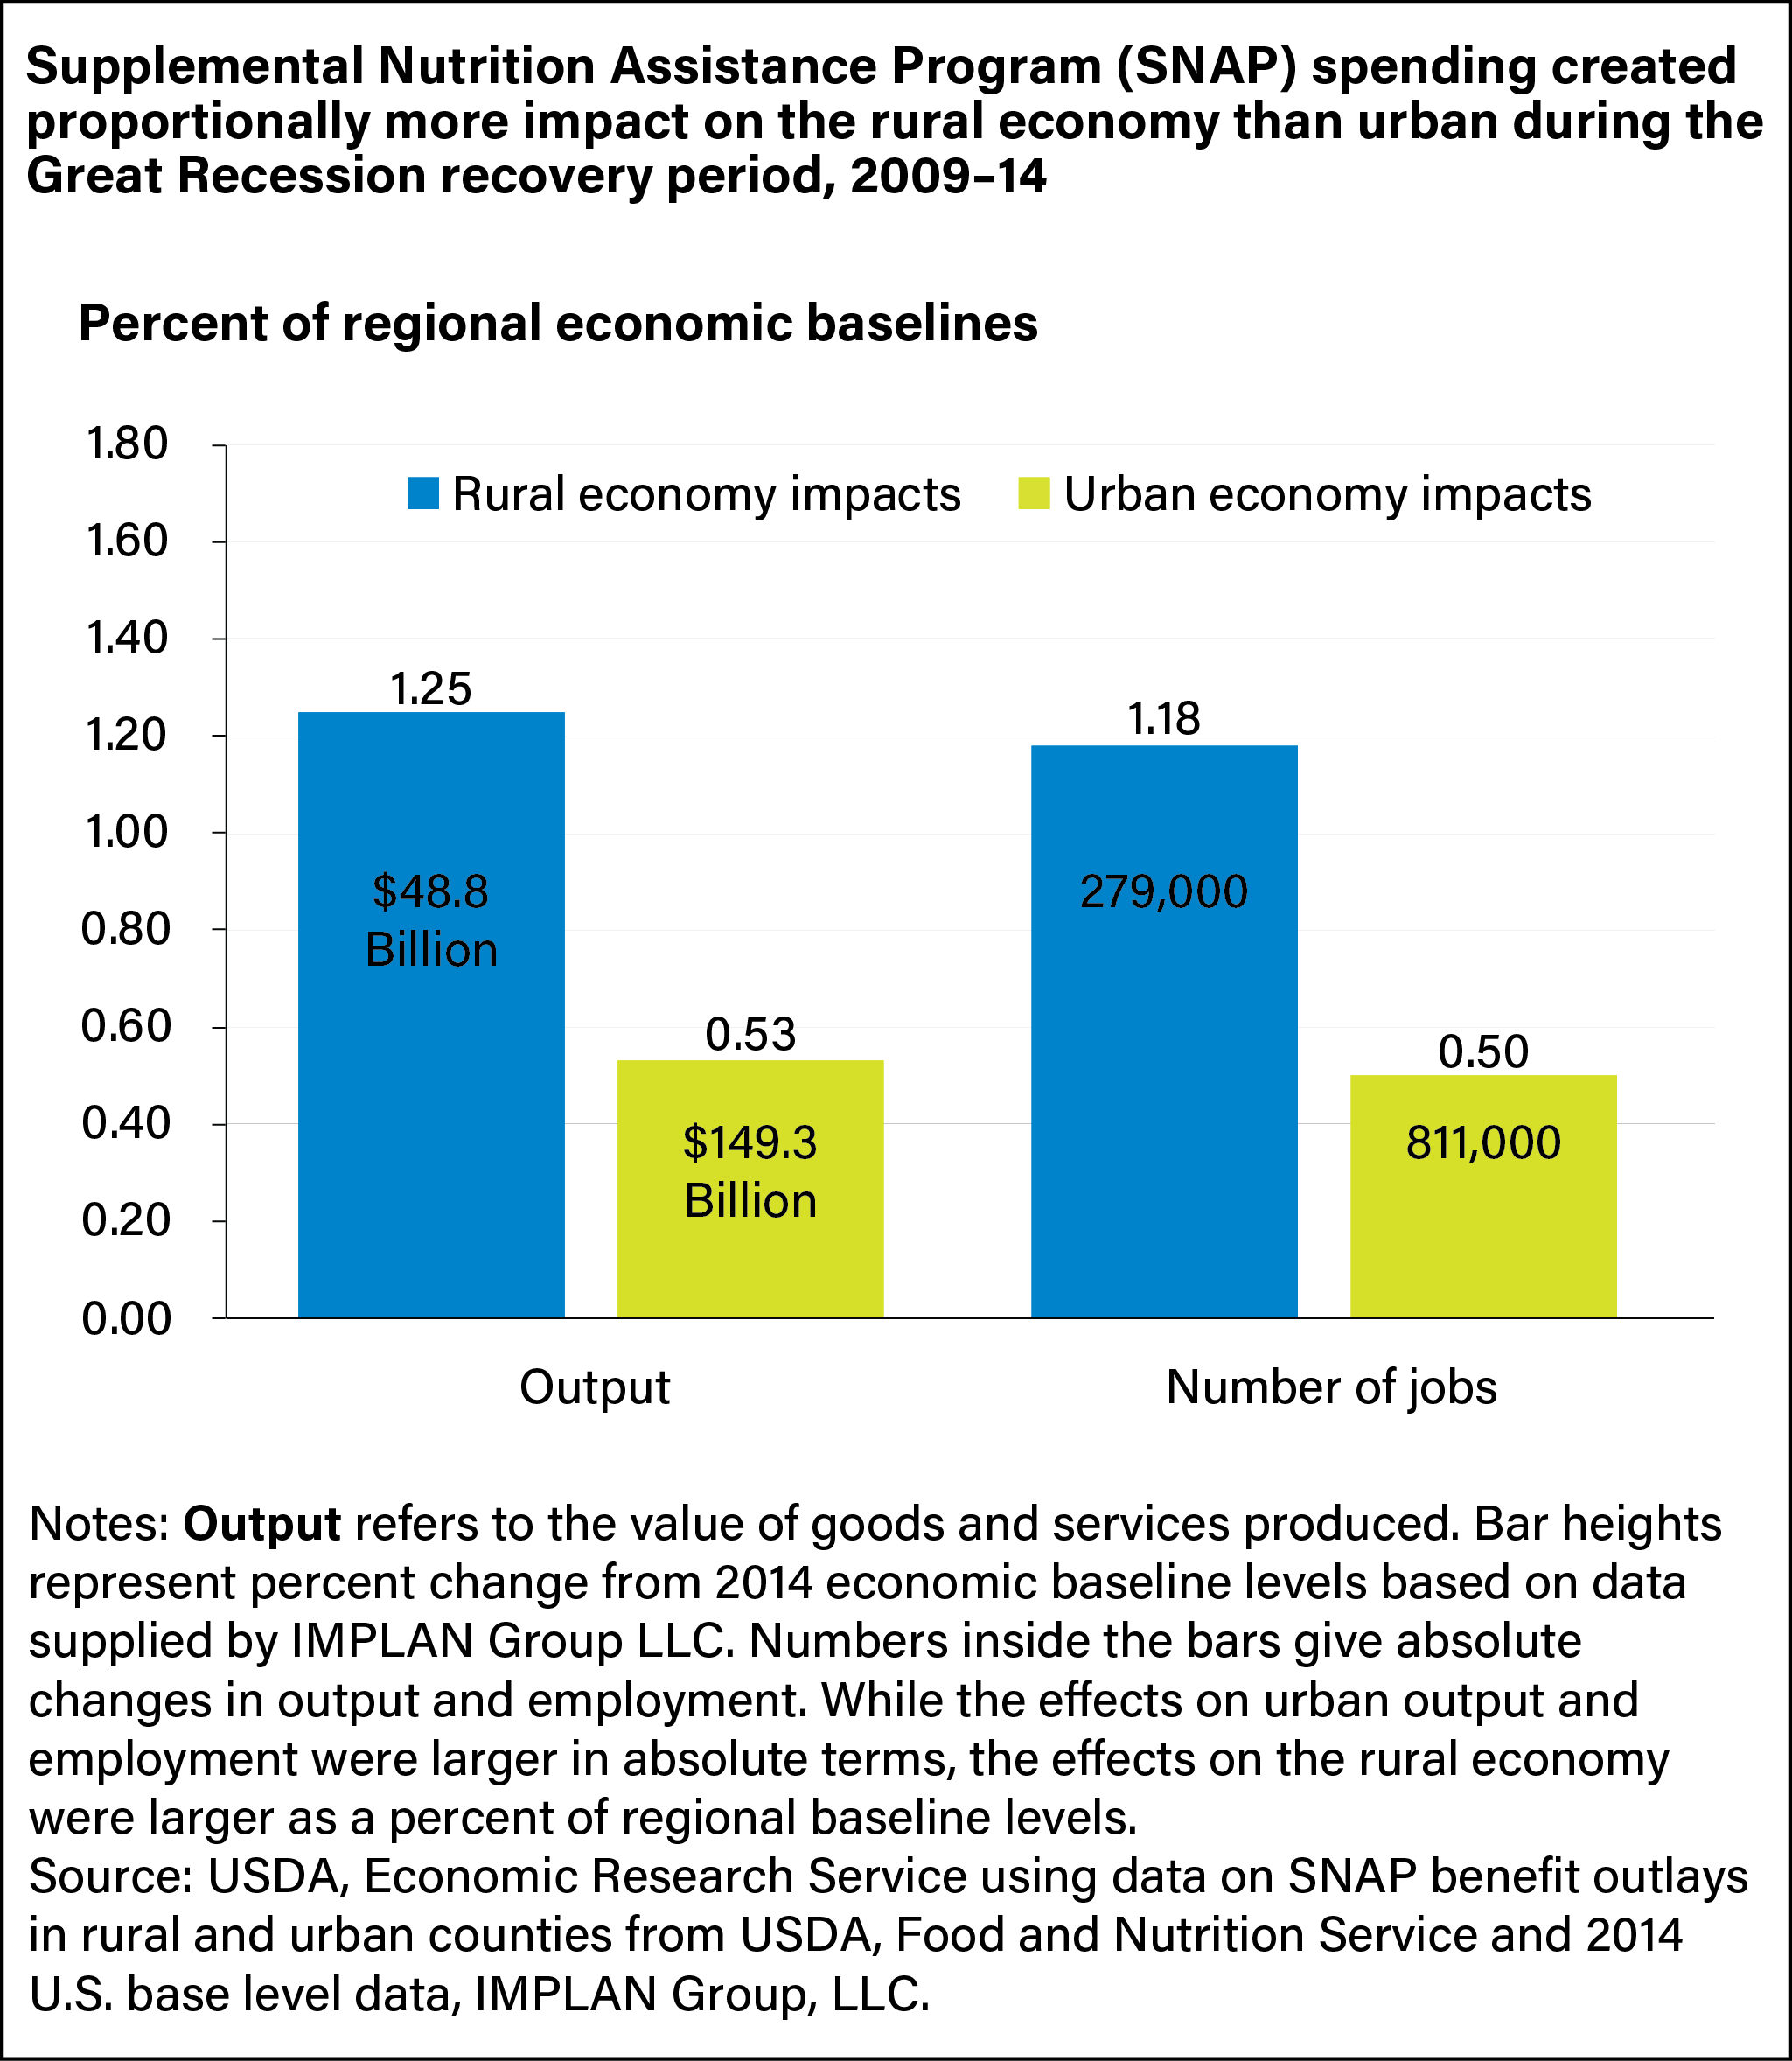
In their study, ERS researchers used data on SNAP benefit outlays in rural and urban counties from USDA’s Food and Nutrition Service SNAP Data Tables and the U.S. Department of Commerce’s Bureau of Economic Analysis Personal Income by County, Metro, and Other Areas tables in an input-output analysis of SNAP benefits on the rural and urban economies. IMPLAN Group LLC, which provides economic analysis software for planning purposes, also supplied data for this study’s simulation models. The researchers found that during the 6-year period, average annual expenditures of $71.0 billion of SNAP benefits (in 2014 dollars) generated an annual increase in rural economic output of $49 billion and an urban output of $149 billion, while supporting the employment of 279,000 rural workers and 811,000 urban workers.
When measured in total dollars and numbers of jobs, household spending of SNAP benefits generated larger economic impacts in the urban economy than the rural economy. However, when measured as a share of total economic output and employment in the urban or rural economy, SNAP generated larger relative impacts in the rural economy than in the urban economy. Household expenditures of SNAP benefits annually increased rural economic output by 1.25 percent and rural employment by 1.18 percent. For the urban economy, SNAP benefits increased economic output by 0.53 percent and employment by 0.50 percent.
The disproportionately larger contributions of SNAP impacts to the rural economy were due to two factors. First, the farm and food-processing sectors represent a larger share of the industrial base in the rural economy than in the urban economy. Therefore, any additional spending on food will result in a greater impact in rural areas relative to urban areas where the food-sector is a smaller share of the overall economy. Second, urban household use of SNAP benefits generated large spillover demands for goods and services produced by rural farms and food processing industries, as well as by rural nonfood industries.
Before 2020, the Great Recession was the most significant economic downturn since the Great Depression. It lasted from December 2007 to June 2009. The U.S. unemployment rate climbed to 8.9 percent in 2011 from 4.7 percent in 2007. Unemployment and underemployment levels remained high throughout the recovery period (2009–14). This period of high unemployment and underemployment prolonged the reduction in household incomes and increased the need for food assistance. As a result, total inflation-adjusted SNAP benefits distributed to eligible households (in 2014 dollars) doubled to an average of $71.0 billion per year from 2009 to 2014 from $34.7 billion in 2007.
The Coronavirus (COVID-19) Recession of early 2020 was also severe but brief in comparison to the Great Recession: U.S. unemployment peaked at a seasonally adjusted rate of 14.7 percent in the week including April 12, 2020, and fell to 5.8 percent by the week of May 12, 2021. The COVID-19 Recession also involved more supply chain and demand disruptions following Government restrictions on non-essential economic activity, social distancing requirements, temporary closures of some facilities due to infection concerns, effects of illness on availability of some essential workers, and decisions by consumers to limit travel and other activities. The COVID-19 Recession led to reduced income, unemployment, or underemployment for some U.S. households, resulting in a greater reliance on SNAP to meet food budgets. In 2020, SNAP spending increased by 31 percent over 2019, but data are not yet available on how that spending affected local economies.
While each recession has its own set of circumstances, research on the role SNAP spending has played in past recessions can help inform the understanding of SNAP’s potential contribution to the rural economy in the face of future downturns.
This article is drawn from:
- Vogel, S., Miller, C. & Ralston, K. (2021). Impact of USDA's Supplemental Nutrition Assistance Program (SNAP) on Rural and Urban Economies in the Aftermath of the Great Recession. U.S. Department of Agriculture, Economic Research Service. ERR-296.
You may also like:
- Canning, P. & Stacy, B. (2019). The Supplemental Nutrition Assistance Program (SNAP) and the Economy: New Estimates of the SNAP Multiplier. U.S. Department of Agriculture, Economic Research Service. ERR-265.
- Pender, J., Jo, Y., Todd, J.E. & Miller, C. (2019). The Impacts of Supplemental Nutrition Assistance Program Redemptions on County-Level Employment. U.S. Department of Agriculture, Economic Research Service. ERR-263.
- Tuttle, C. (2016). The Stimulus Act of 2009 and Its Effect on Food-At-Home Spending by SNAP Participants. U.S. Department of Agriculture, Economic Research Service. ERR-213.