
Average Share of Income Spent on Food in the United States Remained Relatively Steady From 2000 to 2019
- by Eliana Zeballos and Wilson Sinclair
- 11/2/2020
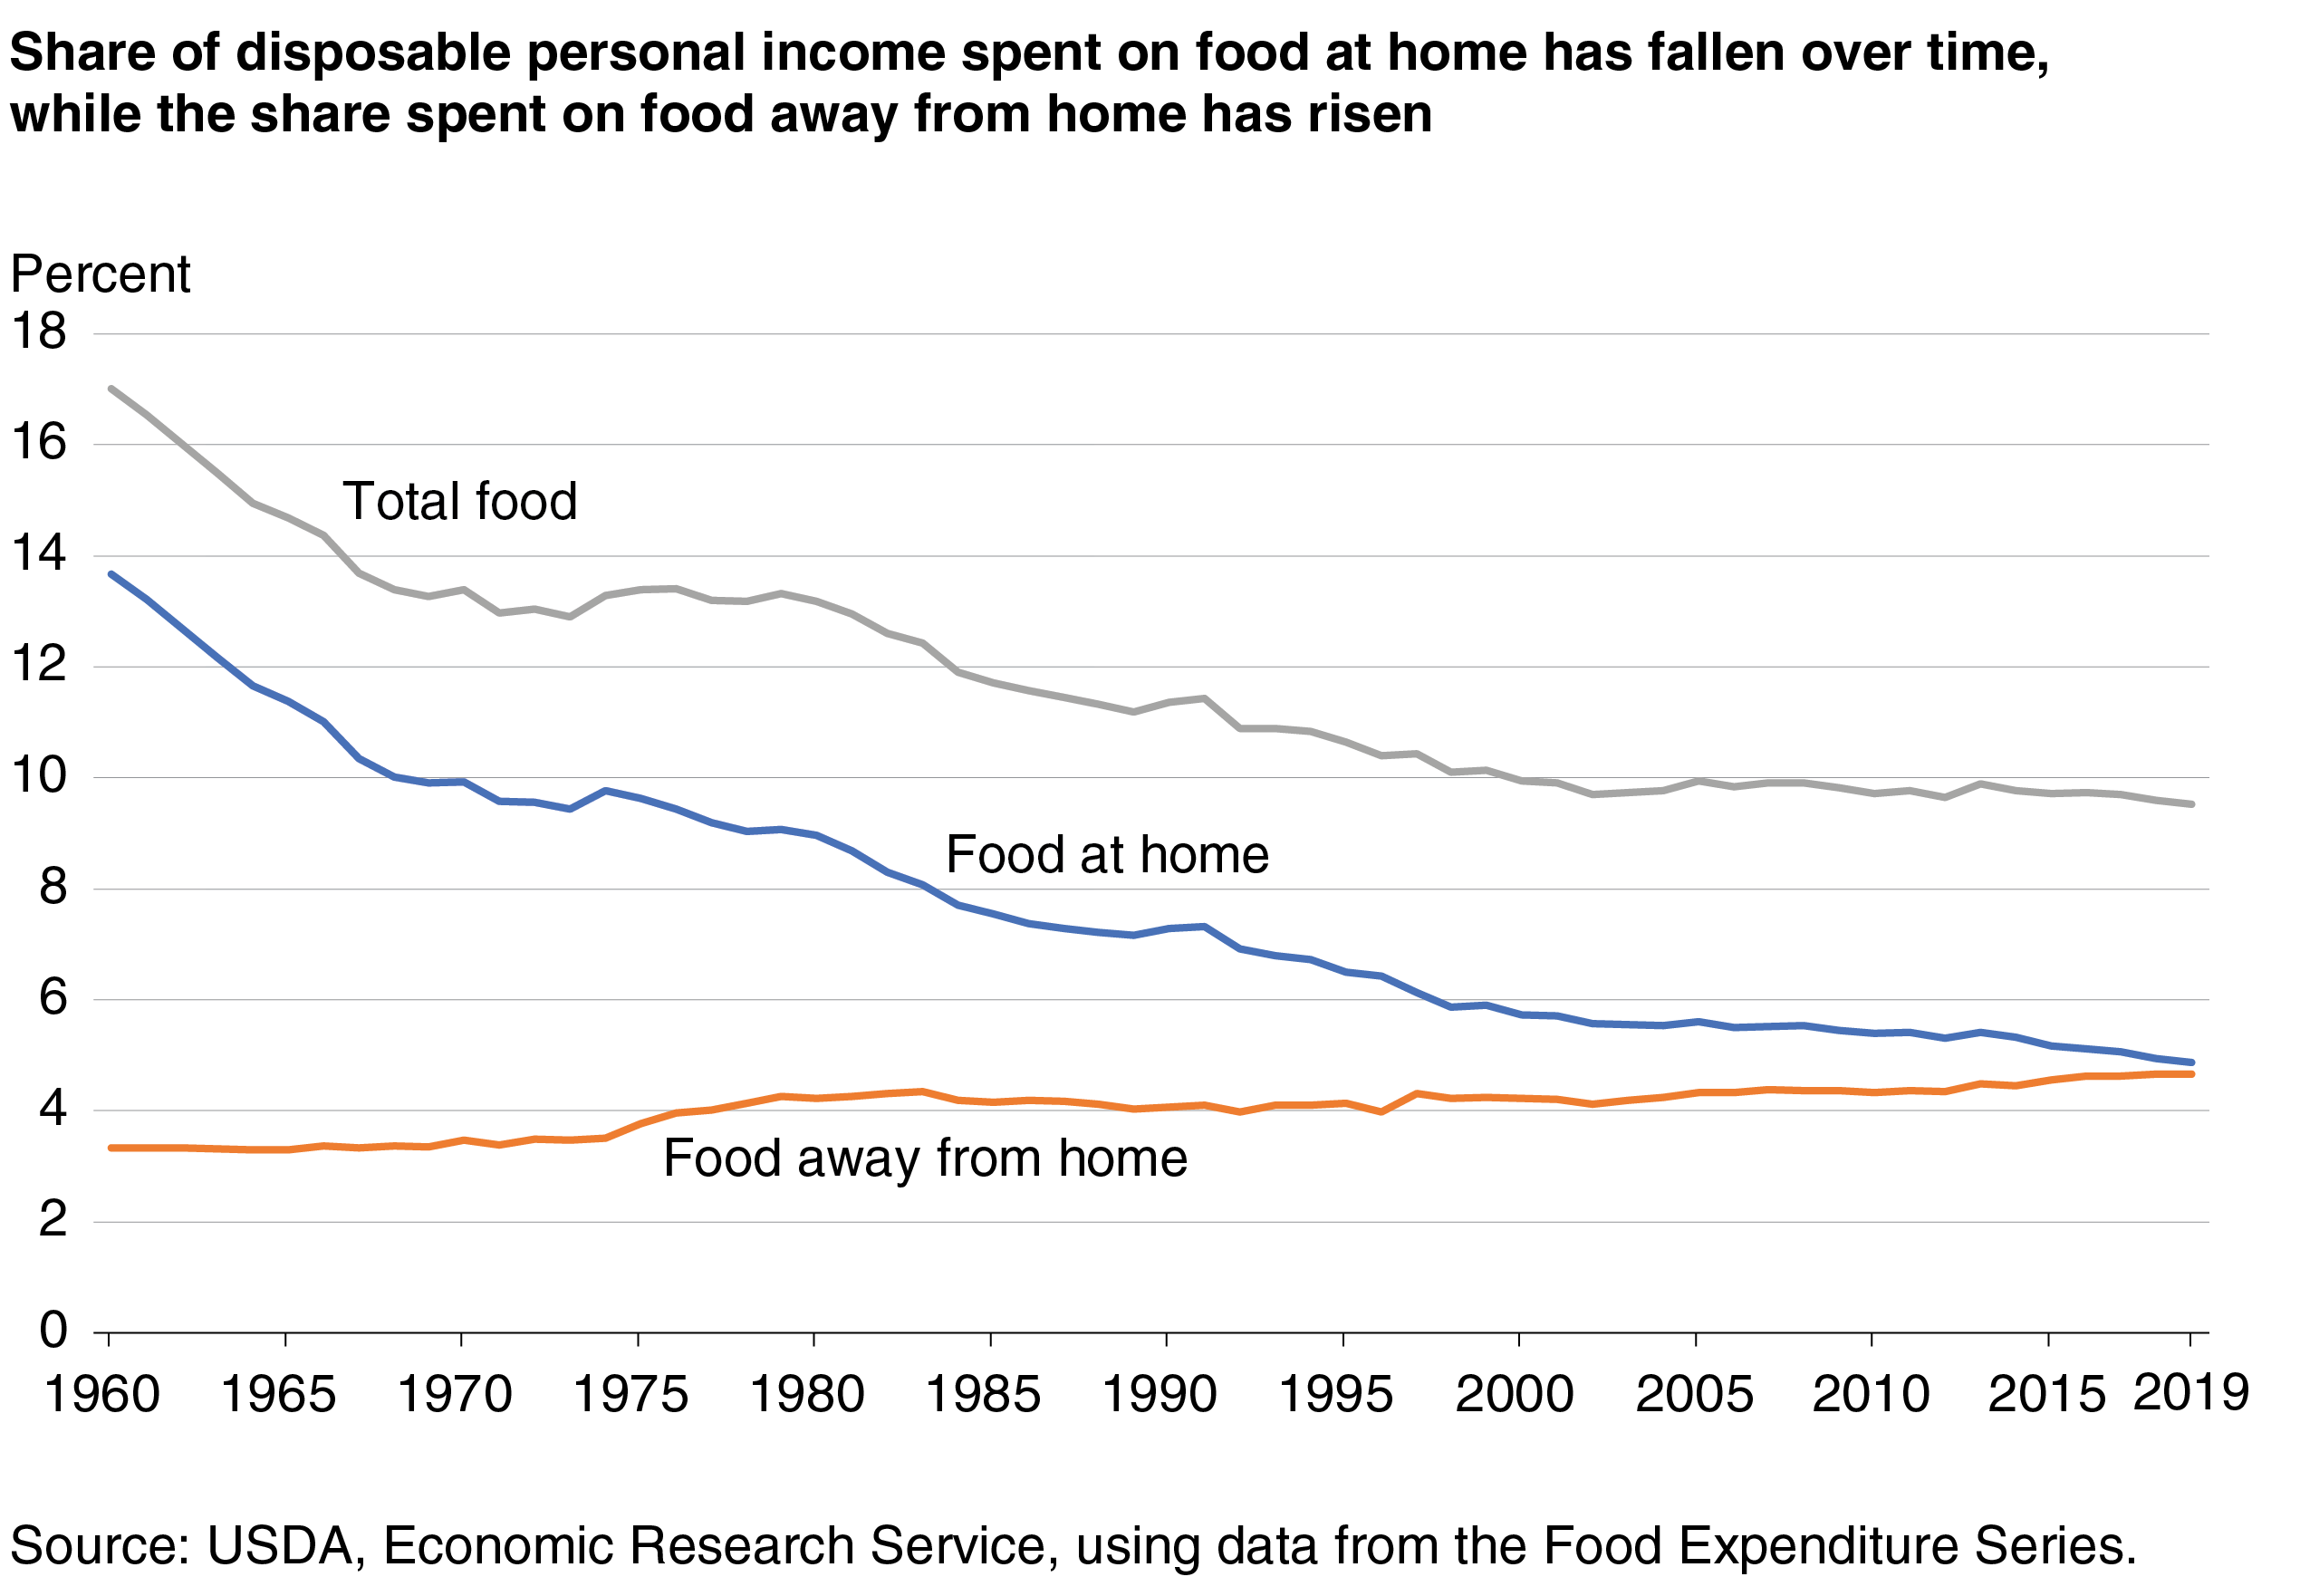
Between 1960 and 2000, the average share of Americans’ disposable personal income (DPI) spent on food fell from 17.0 percent to 9.9 percent. DPI is the amount of money that Americans have left to spend or save after paying taxes. For the past two decades, however, the share of DPI allocated to food has remained around 10 percent.
From 1960 to 2000, Americans spent less of their incomes on food purchased from supermarkets, convenience stores, warehouse club stores, supercenters, and other retailers (food at home). The share of DPI spent on food at home fell from 13.7 percent in 1960 to 5.7 percent in 2000. Over the same period, the share of disposable income spent on food purchased from restaurants, fast-food places, schools, and other away-from-home eating places (food away from home) rose from 3.3 percent to 4.2 percent.
The declining share of income spent on food at home in the United States over 1960 to 2000, in part, reflects rising disposable incomes and efficiencies in the U.S. food system, which kept inflation for food-at-home prices generally low. Higher incomes mean food at home can take up a smaller share of income and allow for more funds for the generally more expensive option of eating out. Average DPI in the United States, adjusted for inflation, grew 3.3 percent per year from 1965 to 1985 and 2.8 percent per year from 1986 to 2000.
However, since 2000, the average rate of increase of DPI has slowed to 1.9 percent per year from 2001 and 2019. The share of DPI spent on food at home continued to decline after 2000 but at a slower pace. This slower decline could reflect Americans opting to prepare more meals at home (as they did during the 2007-09 recession and its aftermath) and purchasing more expensive grocery store options, such as pre-cut vegetables and fruits, imported out-of-season foods, organic products, and prepared dishes, than they did in earlier decades.
The share of DPI spent on food away from home held steady at 4.4 percent during the 2007-09 recession before reaching 4.7 percent in 2019, compared with the 4.9 percent of DPI spent on food at home. Food-away-from-home prices also grew more than prices for food at home in the last two decades, which may have contributed to the rising share of DPI spent on food away from home. Food-away-from-home prices increased by 68.3 percent between 2000 and 2019, and food-at-home prices rose by 44.0 percent.
This article is drawn from:
- Food Expenditure Series. (n.d.). U.S. Department of Agriculture, Economic Research Service.