
U.S. Rice Production Changed Significantly in the New Millennium, but Remained Profitable
- by Nathan Childs, Sharon Raszap Skorbiansky and William D. McBride
- 5/4/2020
Highlights
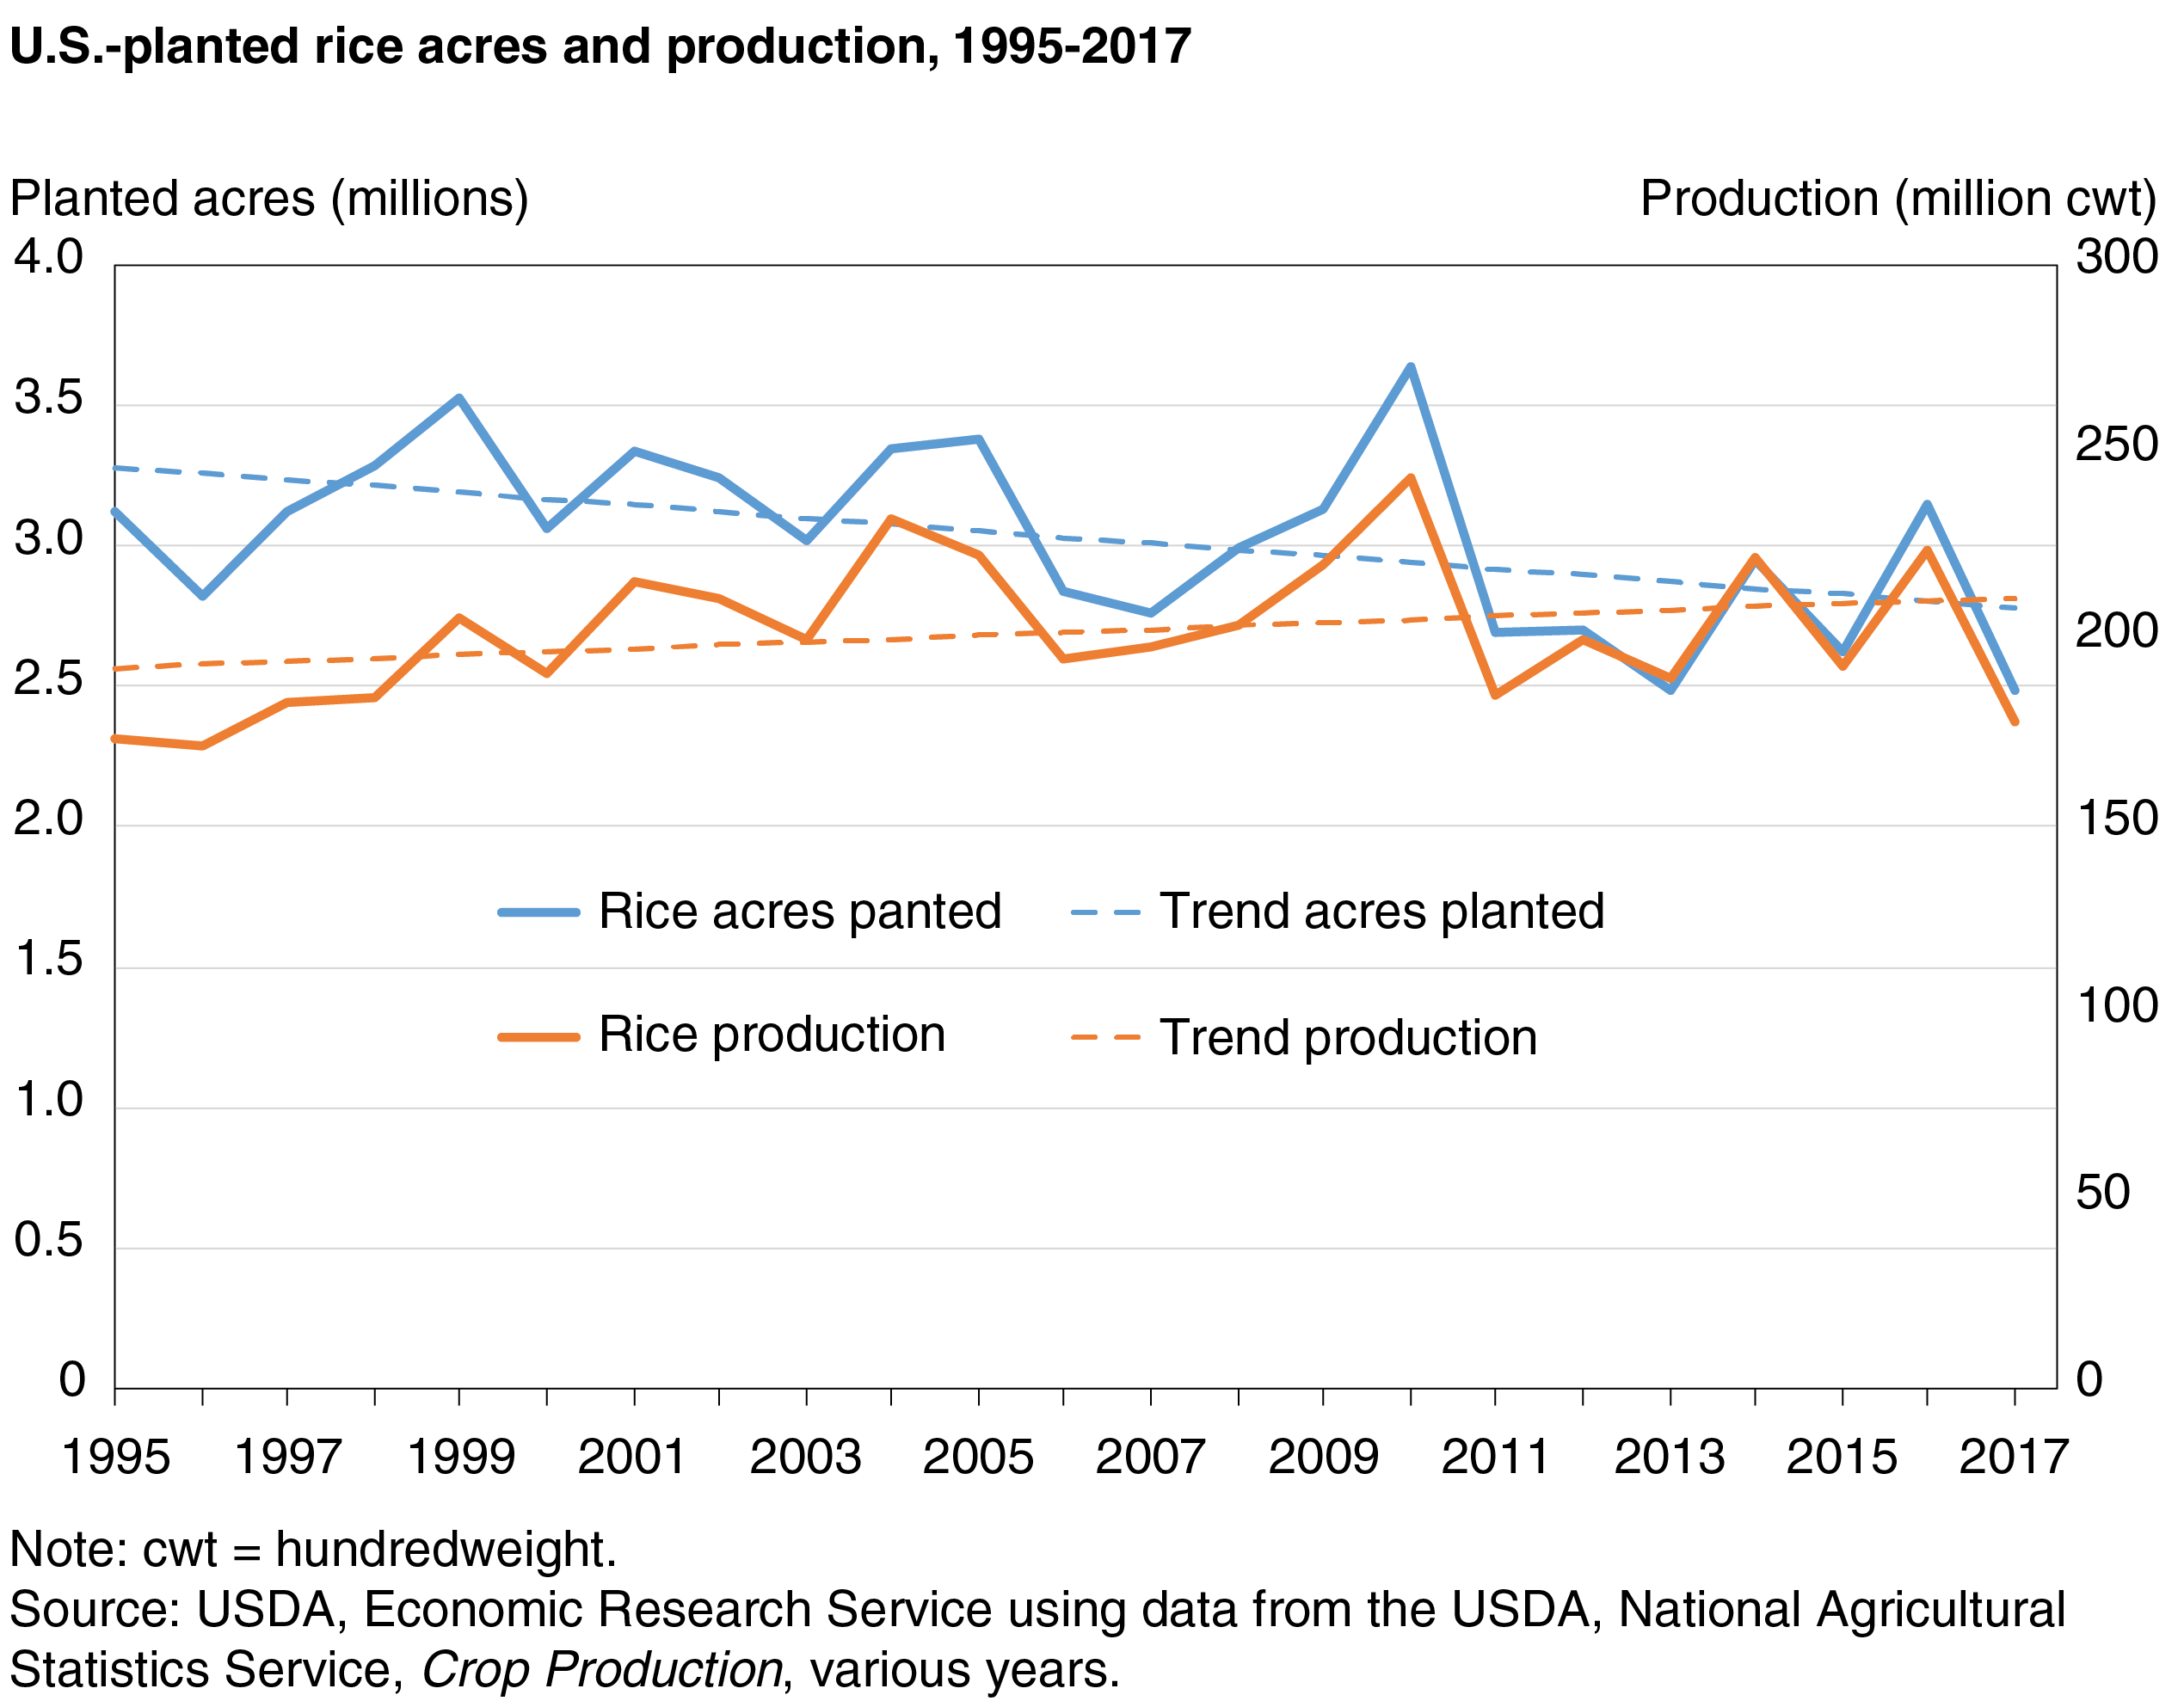
- Despite declining rice acreage from 1995 to 2017, U.S. rice production increased largely due to economies of size and the adoption of new technologies.
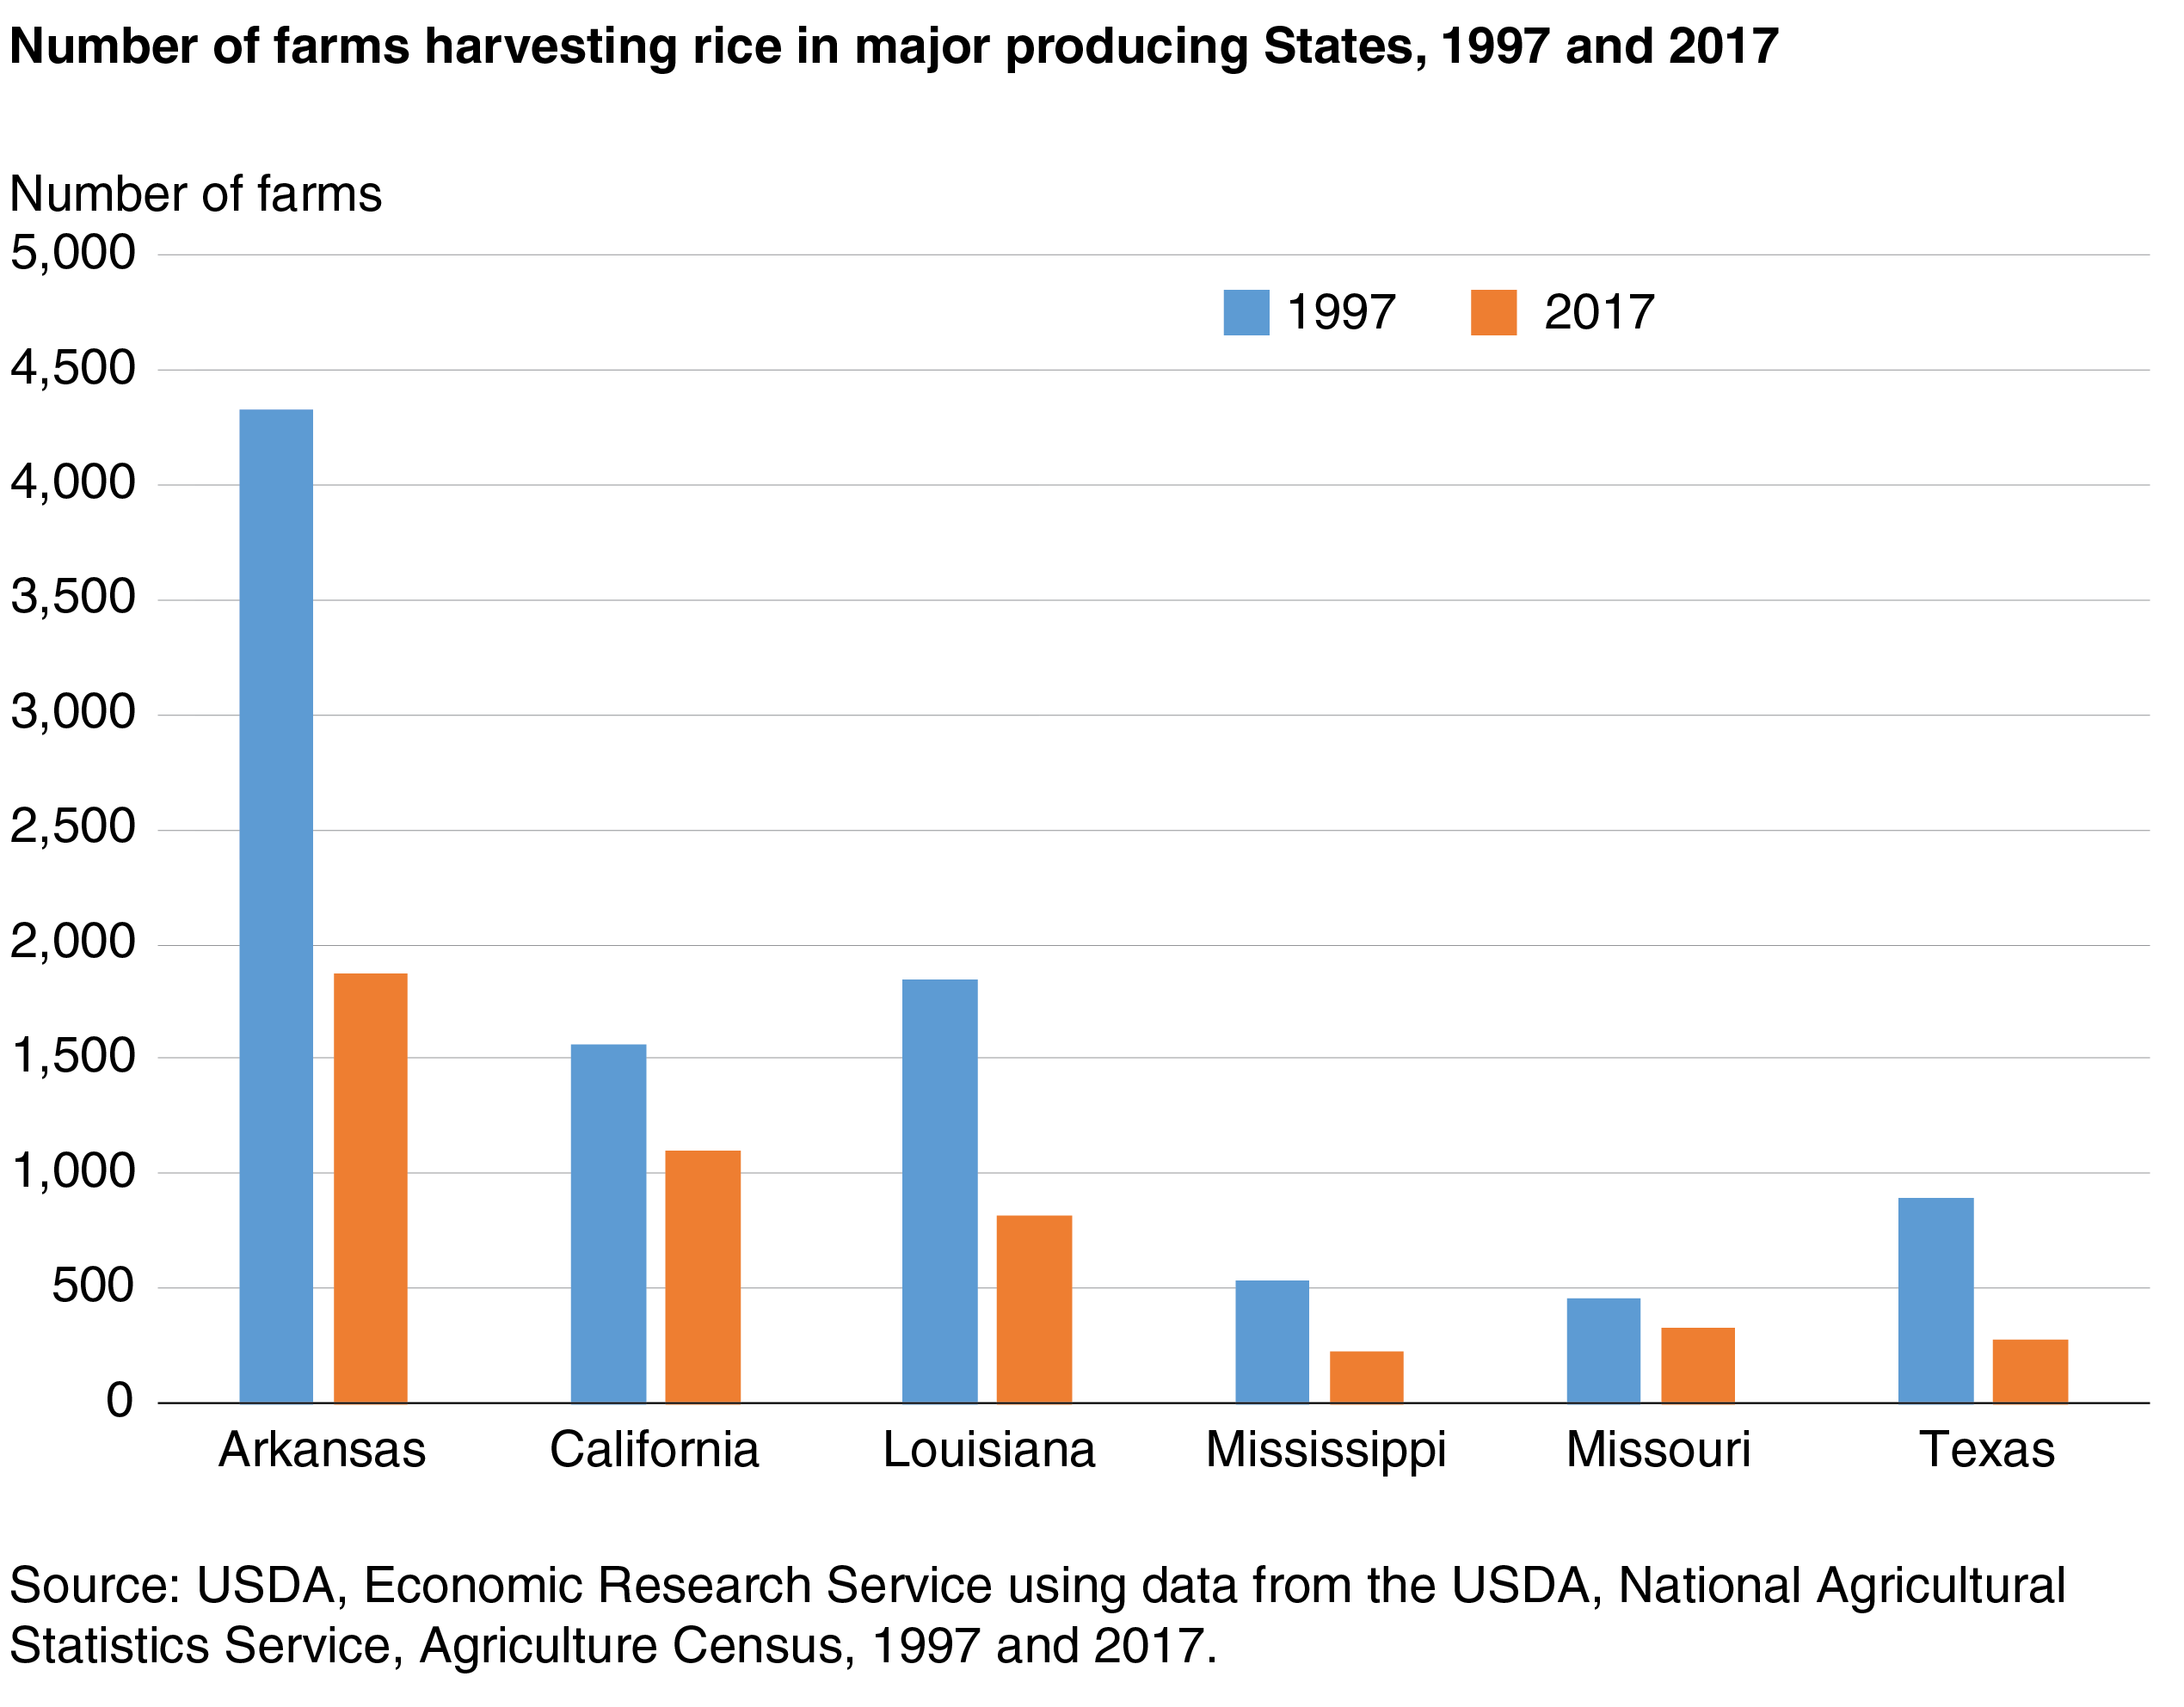
- The number of rice farms in the United States declined 52 percent from 1997 to 2017, but the size of farms planting rice continued to grow, with per farm harvested rice acreage increasing by more than 50 percent from 1997 to 2017.
- There is still a large share of small farms—those with less than 250 acres—in the Southern rice growing regions. These farms may be at a competitive disadvantage relative to larger farms due to economies of size.
For more than two decades, the U.S. rice farming industry has undergone significant changes in both structure and productivity. From 1995 to 2017, total U.S. rice acreage decreased and the number of rice farms fell, yet total U.S. rice production increased over the same time. Despite the declining number of rice farms, the adoption of new technologies and cultivation practices contributed to an overall improvement in rice productivity in the United States. The average size of a rice operation expanded, achieving economies of size—that is, when the average cost per unit of production decreases as the size of the operation increases.
Number of Rice Farms Fell From 1997 to 2017
Based on data from USDA’s Census of Agriculture, conducted every 5 years by USDA’s National Agricultural Statistics Service, the number of rice farms in the United States declined from 9,627 in 1997 to 4,637 in 2017, with all rice-growing States reporting declines. The number of rice farms in Arkansas, which accounted for 40 percent of all U.S. rice farms reported in the 2017 Census, fell by 57 percent to 1,877 from 1997. Louisiana had the second largest number of rice farms in 1997, totaling 1,844. However, by 2017, the number of farms harvesting rice in Louisiana was just 823, a decline of 55 percent. Texas reported the largest percentage decline from the 1997 Census, dropping almost 70 percent to 272 farms in 2017. The decline in Mississippi was only slightly less, dropping 58 percent to 221 farms in 2017. The decline in the number of rice farms was smaller in Missouri and California. In Missouri, there were 327 rice farms in 2017, down 28 percent from 1997. The number of rice farms in California dropped 30 percent from 1997 to 1,100 in 2017. In 2007, California surpassed Louisiana as the State with the second largest number of farms.
Overall Rice Acreage Contracted
U.S. rice-planted acreage decreased between 1995 and 2017, particularly in Texas, Mississippi, and Louisiana, which experienced average annual decreases of 3.2 percent, 2.6 percent, and 1.7 percent, respectively. Arkansas’ annual average area decline was much smaller and, conversely, area increased an average of 1.6 percent per year in Missouri. Although the change in rice acreage in California from 1995 to 2017 was not statistically significant, California acreage dropped sharply in 2014 and 2015 due to persistent drought conditions and competition from more profitable crops, especially almonds. In fact, California rice acreage has yet to return to its 2009-13 annual average of 567,000 acres, a result of both adverse weather in some years and a permanent shift in some acreage to almonds.
Farm Consolidation Trend Evident in U.S. Rice Sector
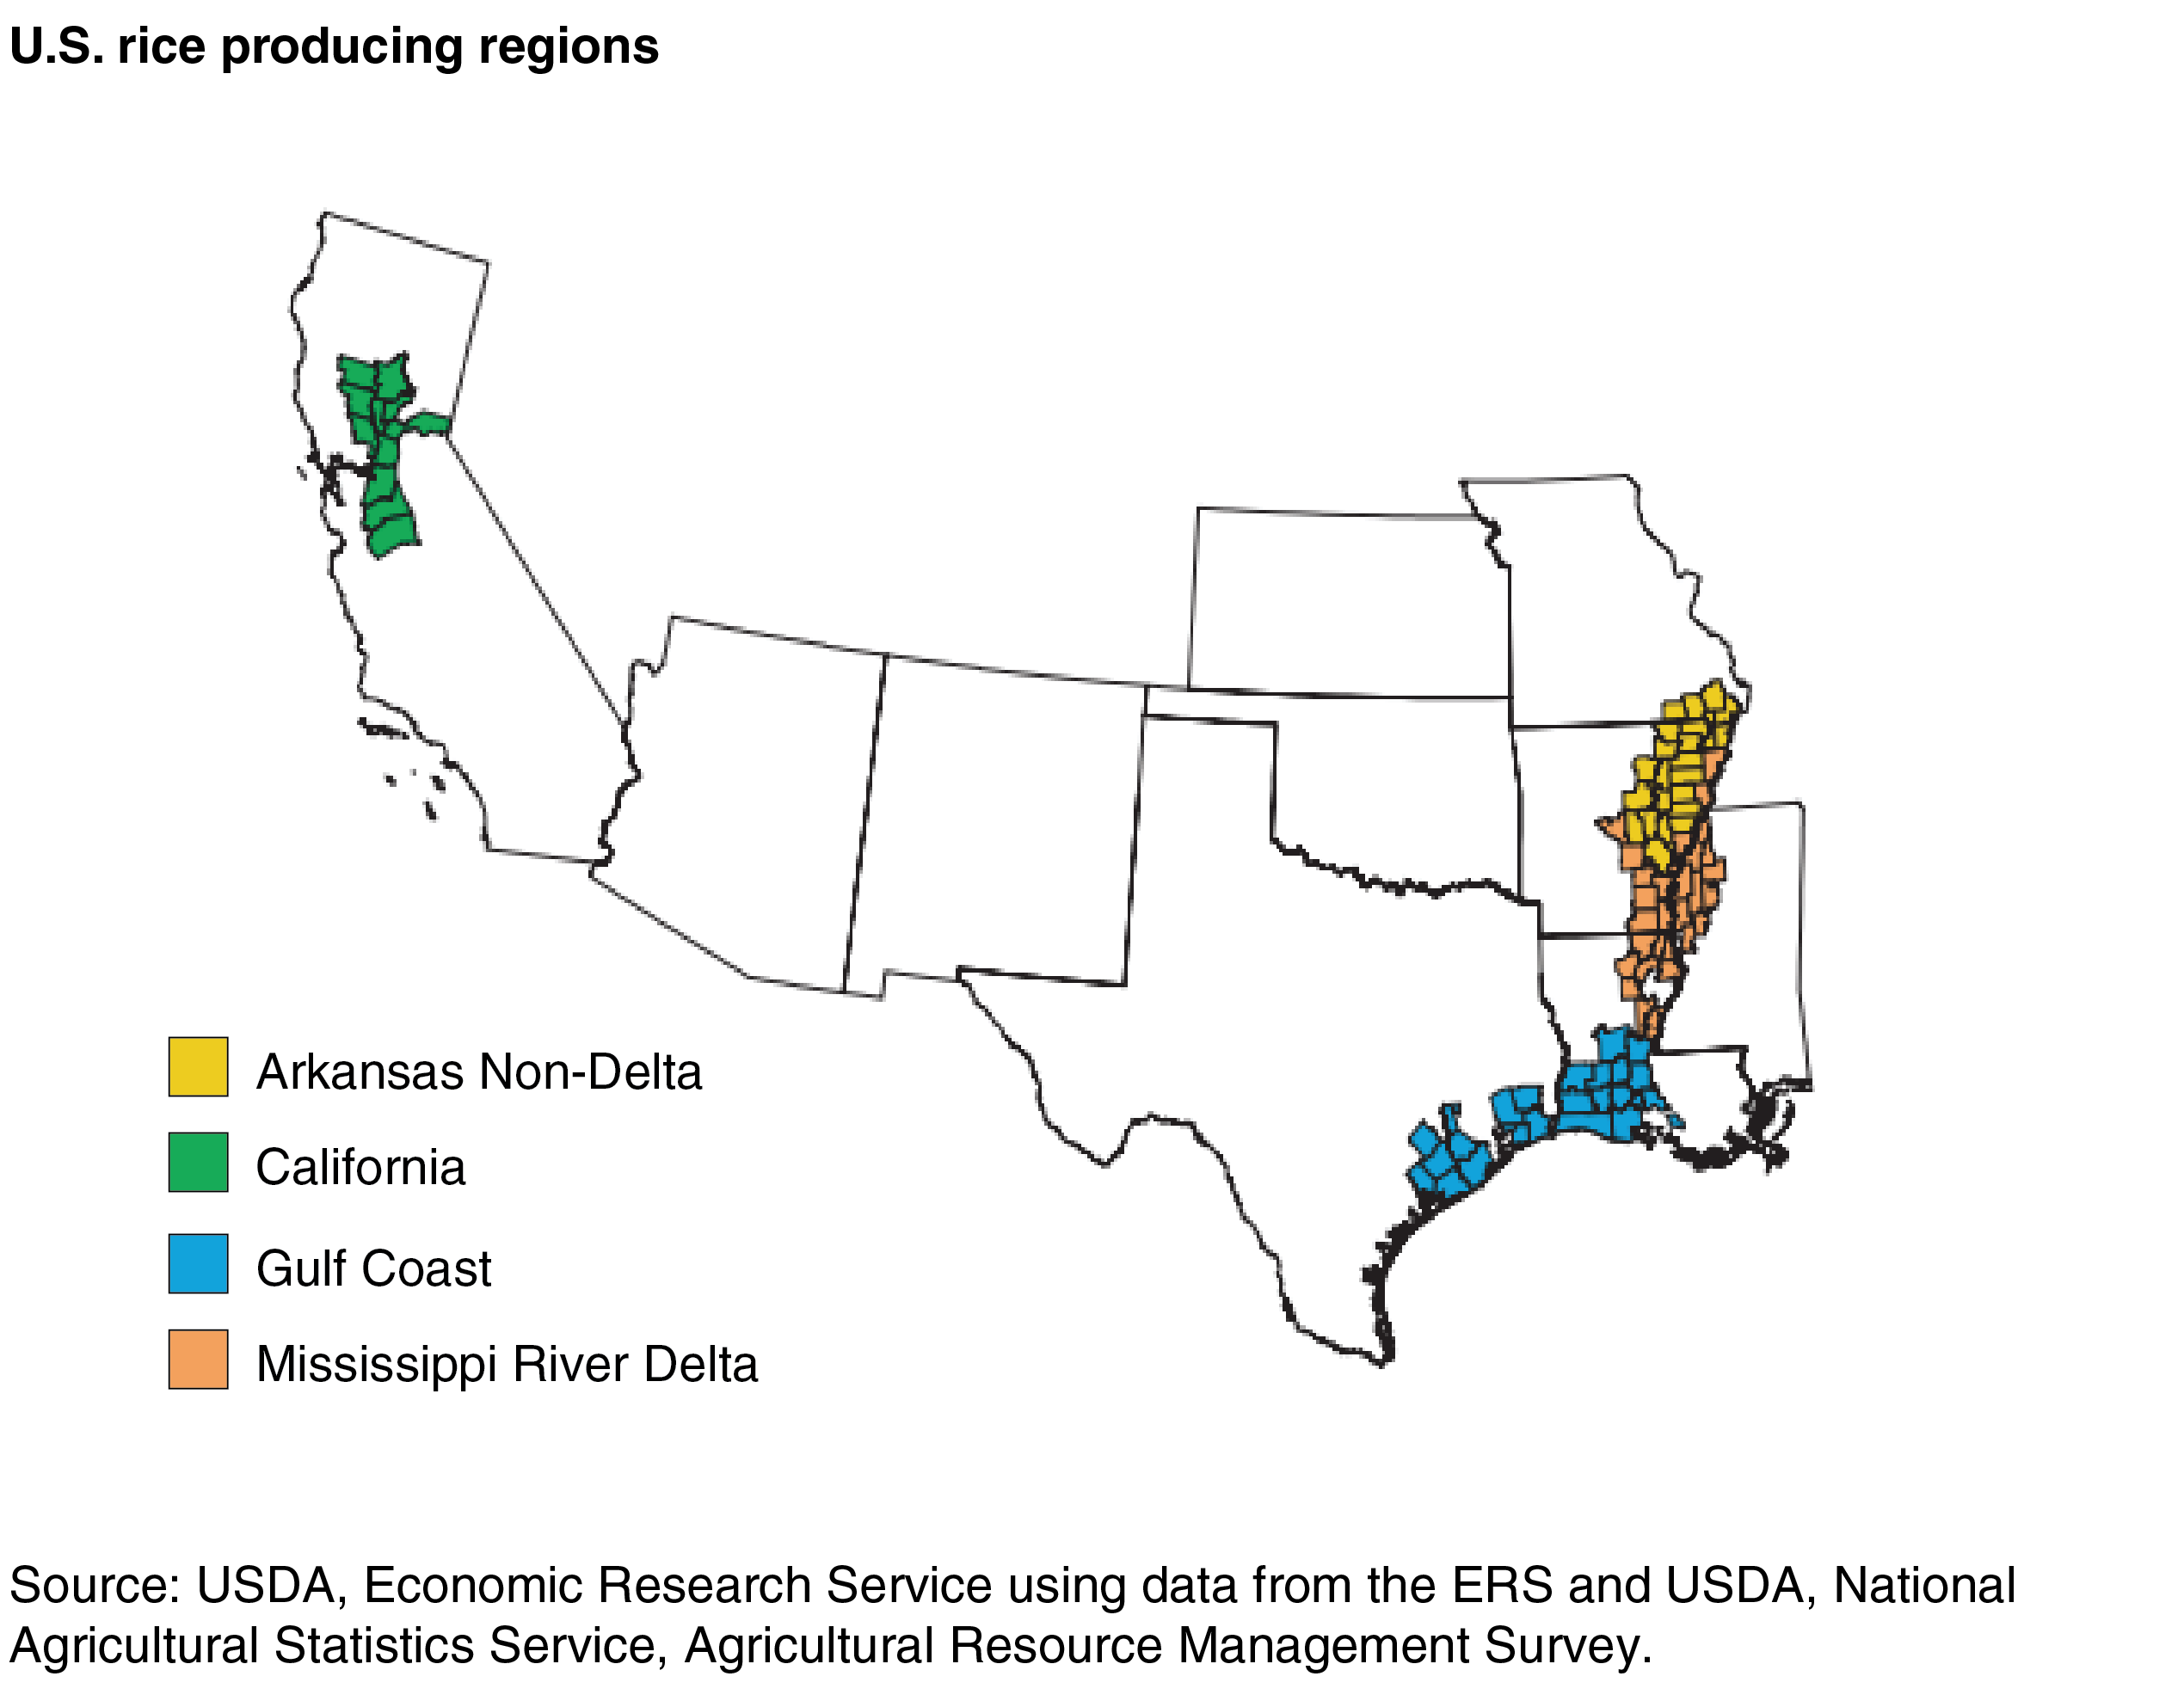
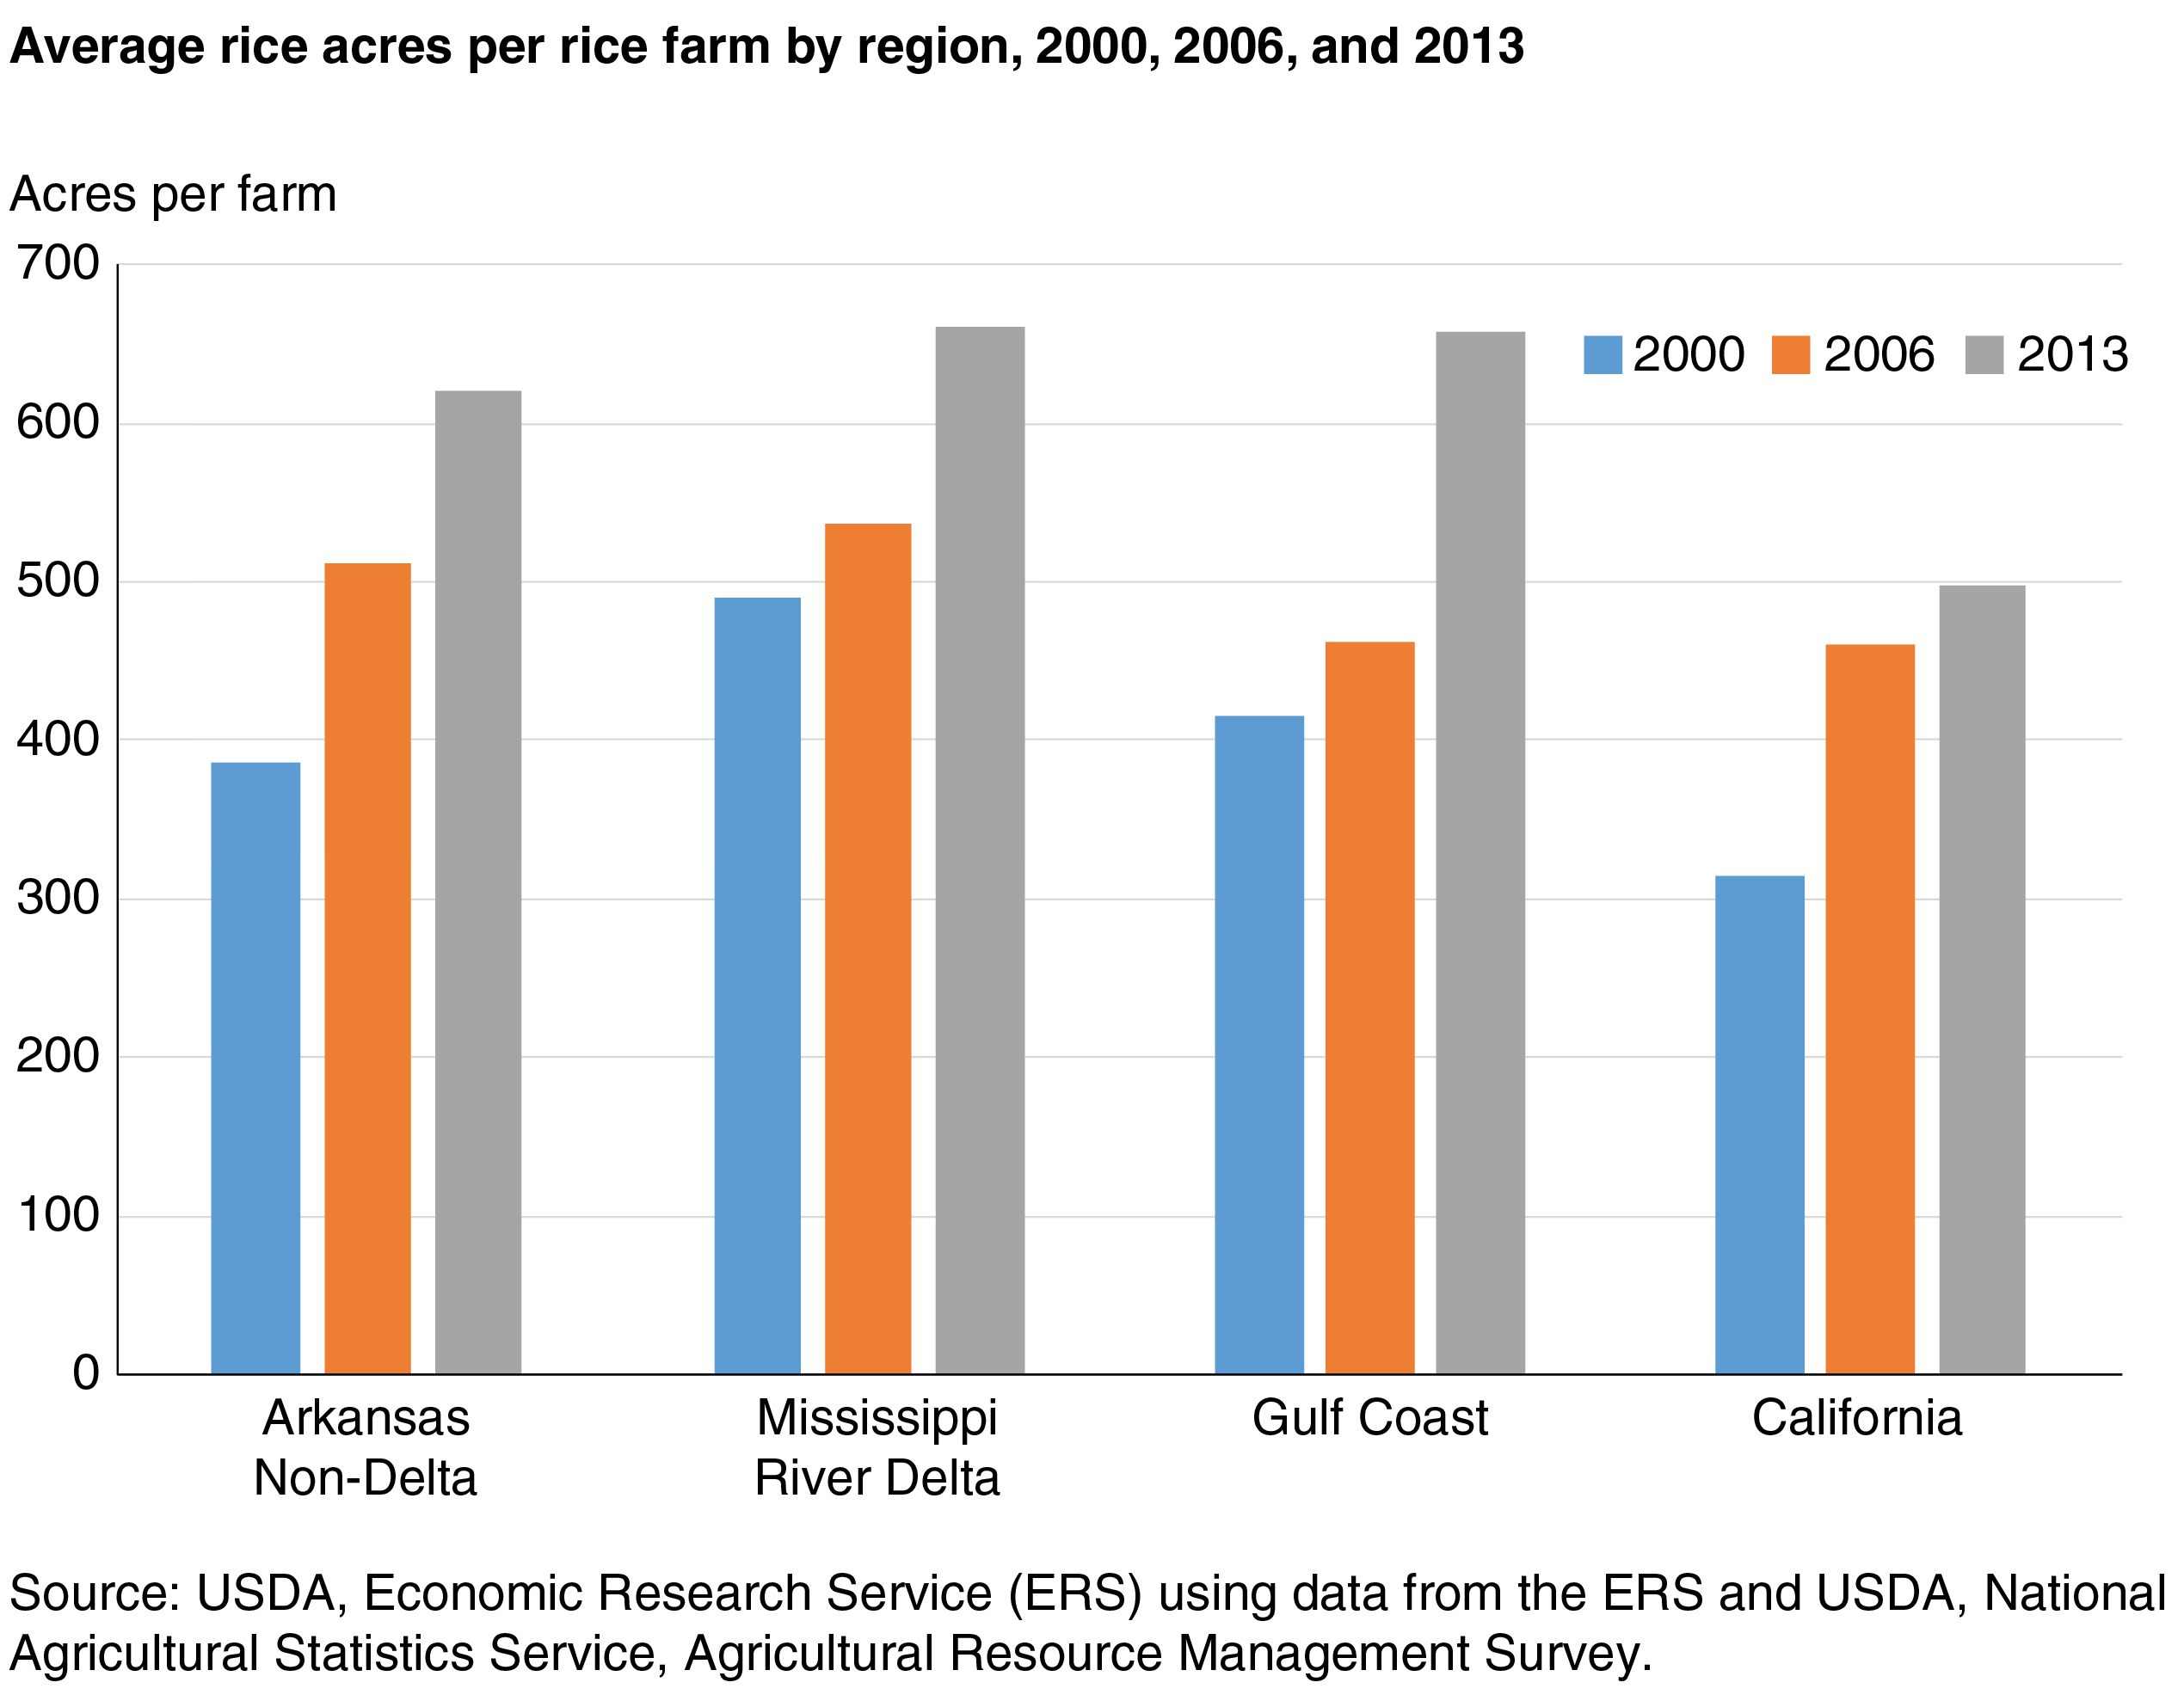
While total acreage and the number of rice farms have decreased, rice farm size has expanded, allowing producers to benefit from economies of size. USDA’s Agricultural Resource Management Survey reports that per farm harvested rice acreage increased by more than 50 percent from 2000 to 2013, from 395 acres to 600 acres. All regions reported a growth rate of more than 50 percent except for the Mississippi River Delta. The Arkansas Non-Delta—which is primarily the Arkansas Grand Prairie plus some additional counties in northeast Arkansas and southeast Missouri—had the fastest growth in per farm rice acreage, increasing by almost 61 percent to 620 acres in 2013 from 386 acres in 2000. Rice farms in the Mississippi River Delta had the slowest growth in per farm acreage, growing 34 percent to 660 acres from 2000 to 2013. The Mississippi River Delta and the Gulf Coast reported the highest number of rice acres per farm. While per farm rice acreage expanded between 2000-2013 in California, at 497 acres, the region still had the smallest number of rice acres per farm. Unlike the South, where costs per hundredweight show a sharp decline for farms exceeding 500 acres, in California, costs decline only slightly as farm size increases beyond 500 acres. As such, in 2013 about one-third of rice farms on the Gulf Coast planted 750 acres or more of rice, compared with just 17 percent in California.
Technology Driving the Shift in the Rice Industry
Along with changes in farm size, rice producers, particularly in the South, have adopted a variety of new technologies, including hybrid seed, herbicide-tolerant seed, and precision farming technologies. Incentives for adopting new technologies include increases in yield and decreases in input costs, which increase the ability of producers to supply rice in a competitive global rice market.
New Rice Seed Varieties Gained Favor
The release of both hybrid rice varieties and herbicide-tolerant rice varieties over the past two decades have had major positive impacts for Southern rice growers. The first commercial hybrid rice seed was released in 2000; by 2013 they accounted for 29 percent of U.S. rice acreage. Hybrid rice gained favor primarily because it is typically higher yielding than conventional rice, although sometimes of a lower quality. Hybrid rice is only planted in the South and is mostly long grain. Long-grain accounts for almost 90 percent of the rice planted acreage in the South, with medium-grain accounting for most of the remainder. California produces almost exclusively medium- and short-grain rice, with medium-grain the dominant variety in the State.
Herbicide-tolerant rice has been bred to withstand applications of specific herbicides that kill targeted weeds. This feature allows producers to apply herbicides after both the rice and weeds that have emerged, killing targeted weeds without harming the rice. For example, the Clearfield (CL) variety was the first herbicide-tolerant rice developed to help Southern producers manage “red rice.” Red rice is a weed unique to rice production, being the same genus and species as rice, but having an off-color seed coat that is undesirable to consumers and competes with rice for nutrients.
Herbicide-tolerant CL rice was first made available in 2001, and by 2013 was planted on 43 percent of all U.S. rice acreage. As with hybrid rice, adoption of herbicide-tolerant rice was extensive in the Southern rice regions, reaching nearly 50 percent of acreage in the Gulf Coast and about 60 percent of acreage in the other Southern regions by 2013. Red rice is absent in California, where herbicide-tolerant rice has not been planted, as flooding is used as the main method of weed control.
Precision Technologies Became Integral
U.S. rice farmers have steadily adopted precision farming technologies for use in the field, and most notably in guidance systems. These systems guide the operators through the field, reducing fatigue, replacing visual marking systems, and potentially reducing input use by more precisely identifying needed coverage. Guidance systems were rarely used in 2000, but by 2013 were used on more than 50 percent of rice acreage.
Yield monitors, devices used to calculate crop yields during harvesting, also showed a pronounced increase in use. Monitors were utilized on only 18 percent of U.S. rice acres in 2000 but were used on 58 percent of U.S. rice acres by 2013; this included use on almost 70 percent of acreage in the Arkansas Non-Delta and Mississippi River Delta. The spatial data created by yield monitors can be used to generate yields maps and can also be used for variable rate application of inputs such as fertilizer.
However, data from yield monitors was used to create yield maps on just 18 percent of rice acreage in 2013, and only 16 percent of rice acreage utilized variable rate fertilizer applications, with California reporting the highest share at 30 percent. While these adoption rates were still rather low, they exceeded rates for peanuts and cotton, the other major field crops grown in the South.
New Technology Came at a Sizeable Expense but Gains in Productivity Were Offsetting
The expense of adopting these new technologies improved rice yields but increased operating costs more than 100 percent per acre. From 2000 to 2013, the combined per acre costs—not adjusted for inflation—of seed and fertilizer increased more than 200 percent, and per acre chemical costs increased 108 percent. Production costs grew the fastest where the new technologies were the most readily adopted: in the Arkansas Non-Delta and Mississippi River Delta.
This expense had a silver lining in that on balance, the combination of farm consolidation and the adoption of new technologies caused farm productivity, which is defined as the amount of inputs needed to produce a given level of output, to significantly increase. U.S. rice productivity increased 29 percent from 2000 to 2013. With an annual average of 2.2 percent, the increase in rice productivity was second only to peanuts (at 3.5 percent annually) among major U.S. field crops.
However, rice productivity growth varied by region. The Gulf Coast, which experienced the largest increases in farm consolidation, showed productivity growth of 43 percent from 2000 to 2013. The Gulf Coast was followed by California (25 percent), the Mississippi River Delta (24 percent), and the Arkansas Non-Delta (18 percent). The Southern growing regions, which still have a large share of farms with less than 250 acres, have additional potential for economies of size and technology adoption. The ability to further boost yields and productivity in California is more limited by comparison.
Data from the USDA, Economic Research Service’s Commodity Costs and Returns estimates for 2009-2018 (see USDA’s Commodity Costs and Returns Data Set below) shows that rice remained a profitable planting option. U.S. rice producers experienced positive net returns (total value of production minus total costs) in 8 out of the 10 years and had positive returns in all 10 years when only accounting for the variable operating costs. In 2018, expanded acreage and an increase in rice yields were largely responsible for boosting the total value of production to the highest level since 2014, an increase of 14 percent from a year earlier. High net returns over the long term were largely driven by rising yields which have offset much of the increased costs in producing rice with improvements in technology. Based on USDA, National Agricultural Statistics Service-reported annual average yields, U.S. rice yields in 2018 were 22 percent higher than they were in 2000, and almost 2 percent above levels achieved in 2014. Annual yield growth for rice averaged around 1 percent from 2009 to 2018. Generally, rice yields are less volatile than yields for other major field crops because of prevalence of irrigation practices.
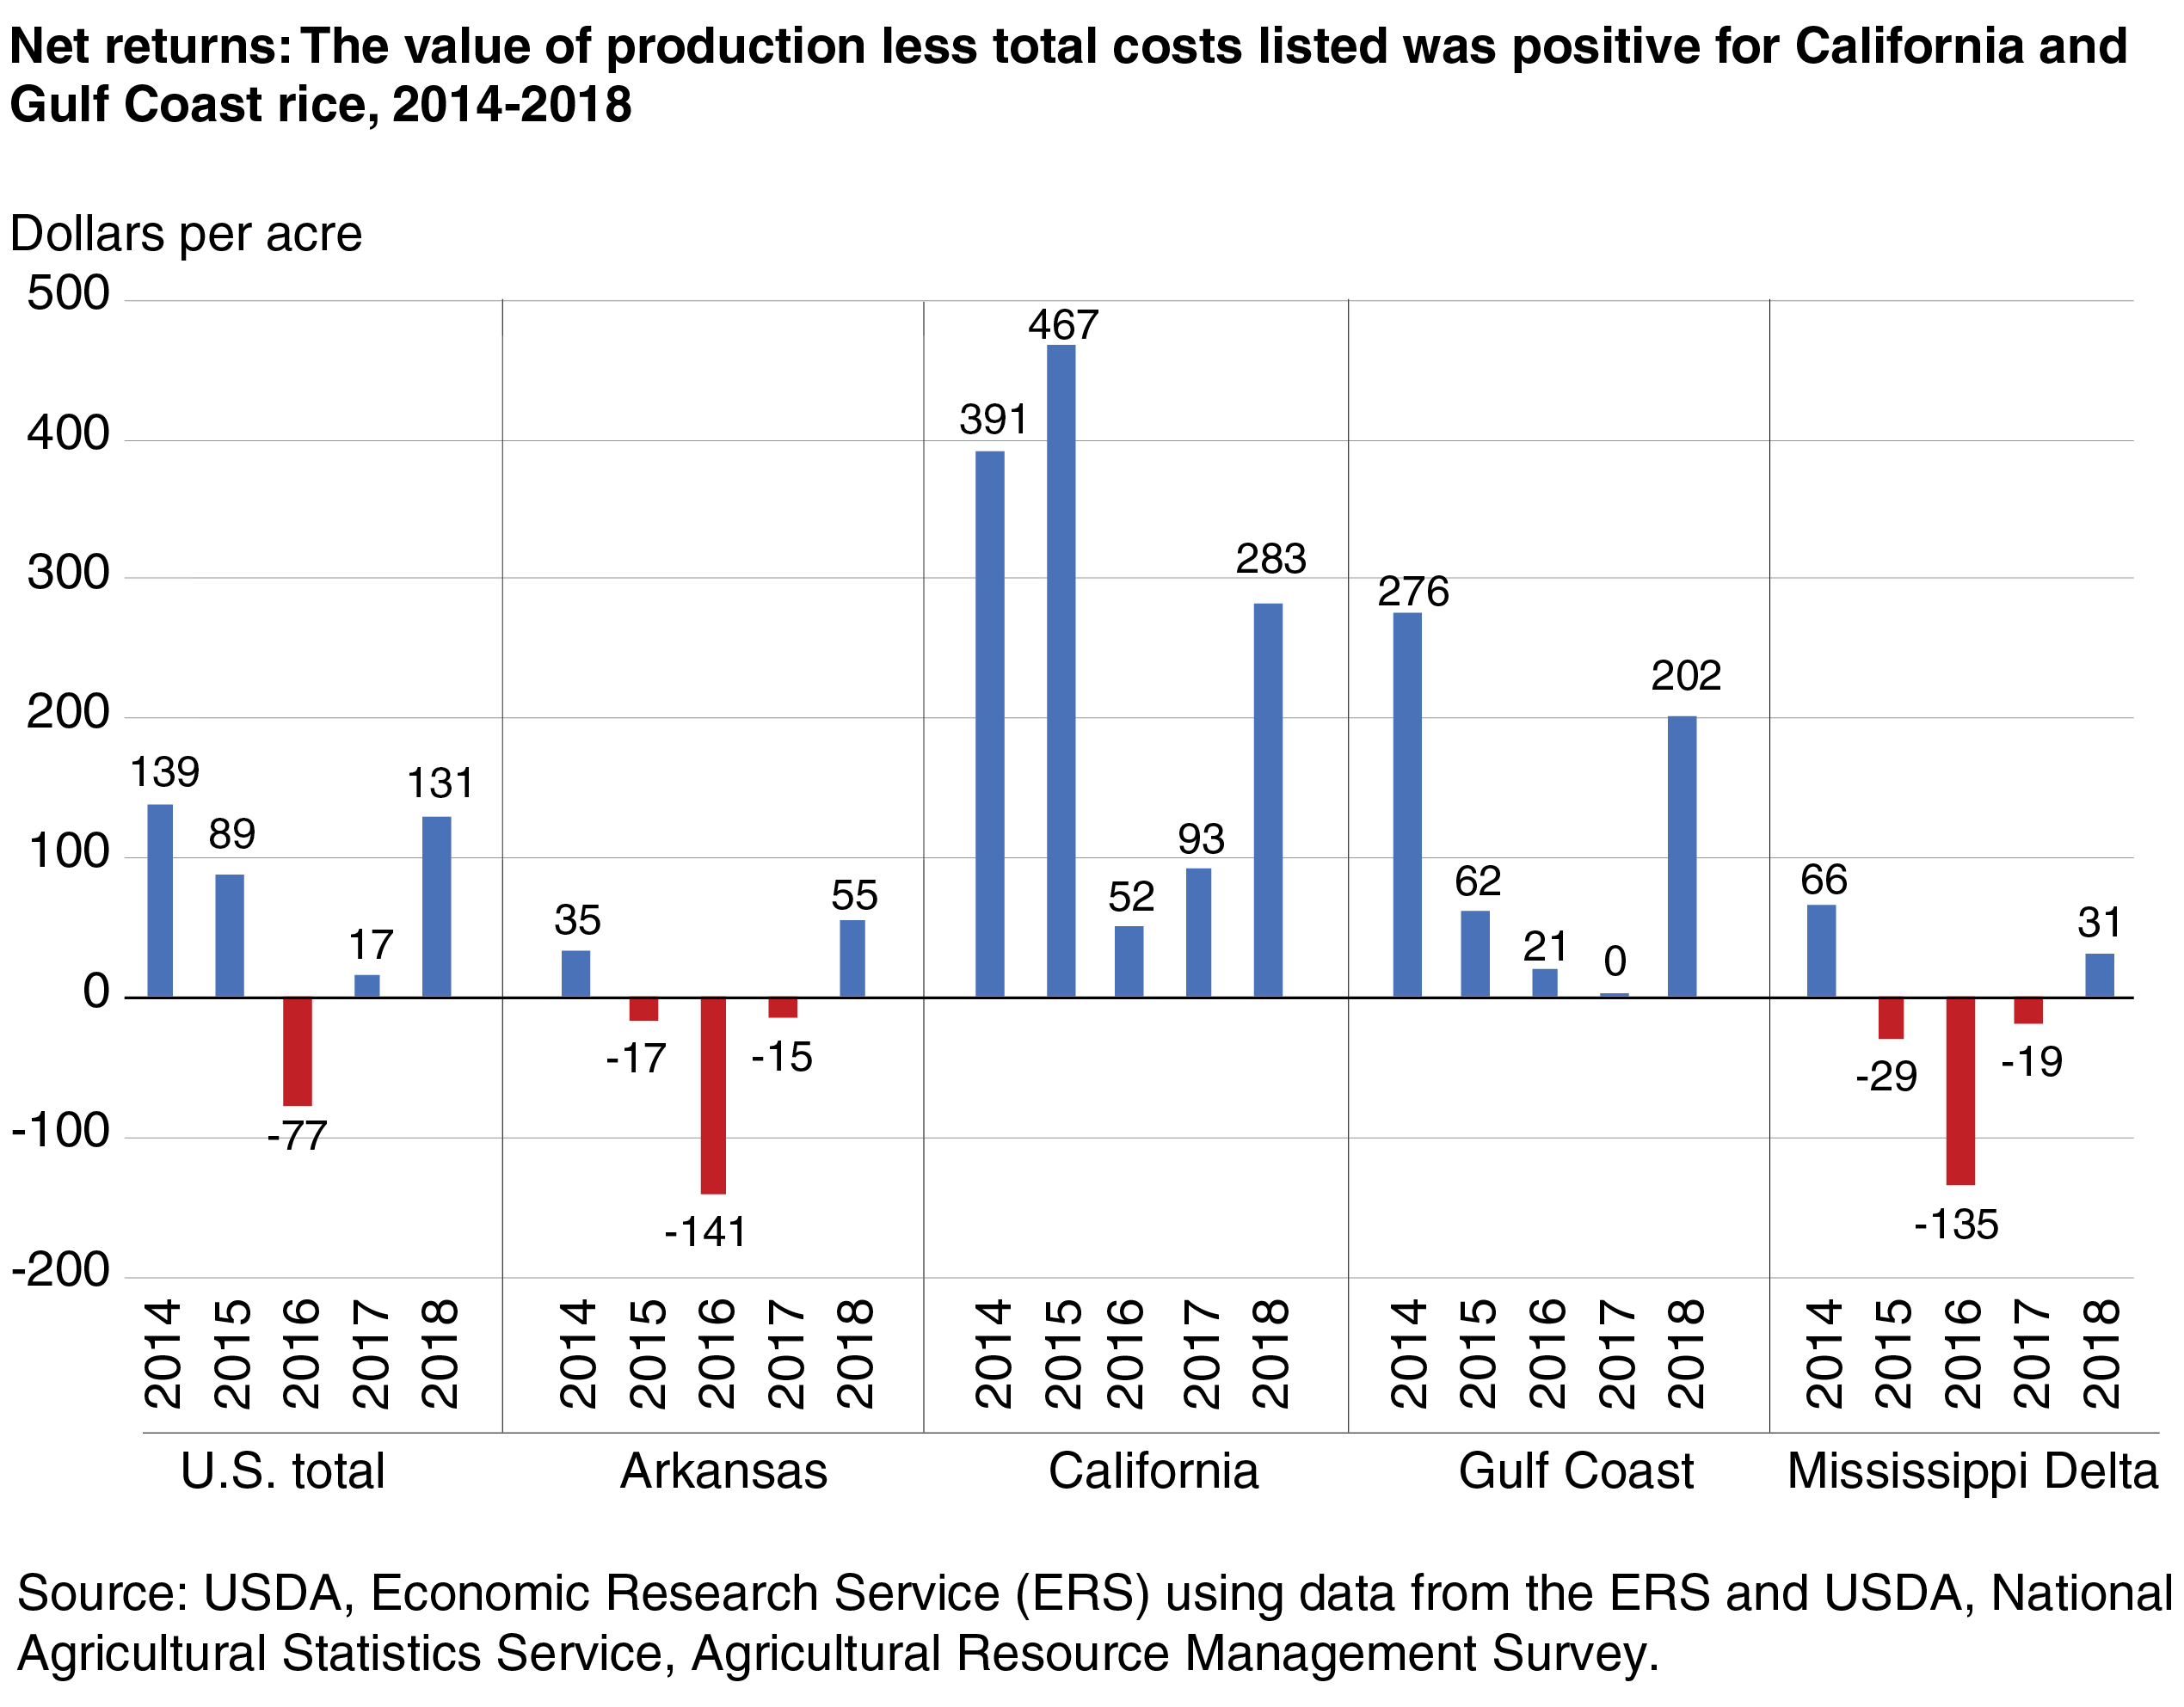
However, net returns to rice production were not constant across the growing regions. While California and the Gulf Coast experienced positive net returns each year from 2014 to 2018, Arkansas and the Mississippi River Delta experienced negative net returns from 2015 to 2017. All rice areas achieved positive net returns in 2018, averaging $131 per acre. Consistent positive returns from rice suggest that rice farming is likely to remain viable in the future despite rising costs and only slight expected-price increases.
This article is drawn from:
- McBride, W.D., Raszap Skorbiansky, S. & Childs, N. (2018). U.S. Rice Production in the New Millennium: Changes in Structure, Practices, and Costs. U.S. Department of Agriculture, Economic Research Service. EIB-202.