A Shift to Healthier Diets Likely To Affect Use of Natural Resources
- by Patrick Canning and Rosanna Mentzer Morrison
- 5/7/2020
Highlights
- To accommodate U.S. diets, it is estimated that the “farm-to-fork” food system accounted for between 7 to 28 percent of the Nation’s 2007 use of four natural resources—forest products, fossil fuels, land, and freshwater withdrawals—and contributed 18 percent of greenhouse gas emissions to the atmosphere.
- For this resource use, food-related farming and ranching accounted for over half of all agricultural land use, used the largest share of freshwater withdrawals, and accounted for the highest share of greenhouse gases; households were the largest users of fossil fuels for storing food, cooking it, and cleaning up afterwards.
- If all Americans, on average, were to adopt a diet that meets Federal recommendations, indications are that food system use of agricultural land, fossil fuels, and forestry products would fall, more freshwater would be withdrawn, and greenhouse gas emissions would essentially remain the same.
Natural resources play a central role throughout the system that produces the food we eat, from the farmland and freshwater used to grow crops and raise livestock, to the air that provides nitrogen for fertilizers and stores byproducts of production and consumption, to the fossil fuels used to power tractors, food manufacturing plants, and home refrigerators. Total resource requirements of national food systems are determined by three main factors: what foods are consumed by the “average” resident (diet), the number of residents in the country (population), and how foods are produced, marketed, and preserved (technology). If any of these three factors are altered—such as by a change in dietary patterns—the food produced, and the resources used to produce that food, are likely to change as well.
A recent Economic Research Service (ERS) study draws on findings from several earlier studies by ERS and research partners to analyze the effects of a change in the average American diet on the U.S. food system’s use of five natural resources: agricultural land, fresh ground and surface water, fossil fuels, forest products, and air, where air use is estimated in terms of emissions of greenhouse gases into the atmosphere. The U.S. food system comprises all businesses that are either directly or indirectly involved in producing and marketing food products, such as the producers of farm inputs like fertilizers and machinery, the farmers growing food and feed commodities, the processors making food products, plus food distributors, retailers, and eating-out places.
The study found mixed effects on the five resources if Americans were to adopt a diet in keeping with the Federal Dietary Guidelines for Americans. This healthier diet would, under baseline production and marketing practices, decrease use of agricultural land, fossil fuels, and forest products. Greenhouse gas emissions would remain essentially unchanged, and more freshwater would be withdrawn from rivers, lakes, and aquifers.
Calorie Sources Differ Between Baseline and Healthy American Diets
It is well documented that the average American does not follow many of the recommendations in the Dietary Guidelines for Americans. Analyses of National Health and Nutrition Examination Survey data find that many Americans exceed Federal recommendations for added sugars, saturated fats, and sodium, and could improve their diets by eating more vegetables, fruits, dairy products, and whole grains. For this study, researchers consider a Healthy American diet scenario where the average American eats the foods and beverages that were consumed by Americans who, in 2007, met the Dietary Guidelines for Americans.
To analyze the use of natural resources to produce the “baseline” American diet—the average diet in 2007—ERS researchers built a model that identifies the diet choices of 16 different age/gender population groups (8 age ranges by gender) among just over 4,000 food items. These 4,000 plus food items are linked to 74 broad food commodity groups and 344 industry groups that provide inputs to the food system. At the time of the research, the 2007 National Benchmark Make and Use Tables, published in 2015 by the Bureau of Economic Analysis, provided the latest data with enough detail on resource use to calculate the natural resources used by businesses that produce and market food. Thus, the Baseline and Healthy American diets reflect the food preferences of U.S. consumers in 2007, given prices and incomes at that time.
To identify their Healthy American diet, the researchers set up calorie targets, food group targets, and 33 nutrient targets. Calorie targets were allowed to vary by plus or minus 5 percent to give the model flexibility to meet all of the constraints. In addition to the dietary constraints, researchers also imposed a cost constraint requiring that the wholesale cost of the Healthy American diet not exceed that of the Baseline diet.
The Healthy American diet is the least disruptive route to eating healthfully for the average American because it was the most common diet among U.S. consumers in 2007 whose diets aligned with the Dietary Guidelines. Because of this minimum change objective, the Healthy American diet contains many of the same food items consumed in the Baseline diet. For example, fluid milk, bananas, and tortillas are popular food items in both diets, but the quantities consumed vary.
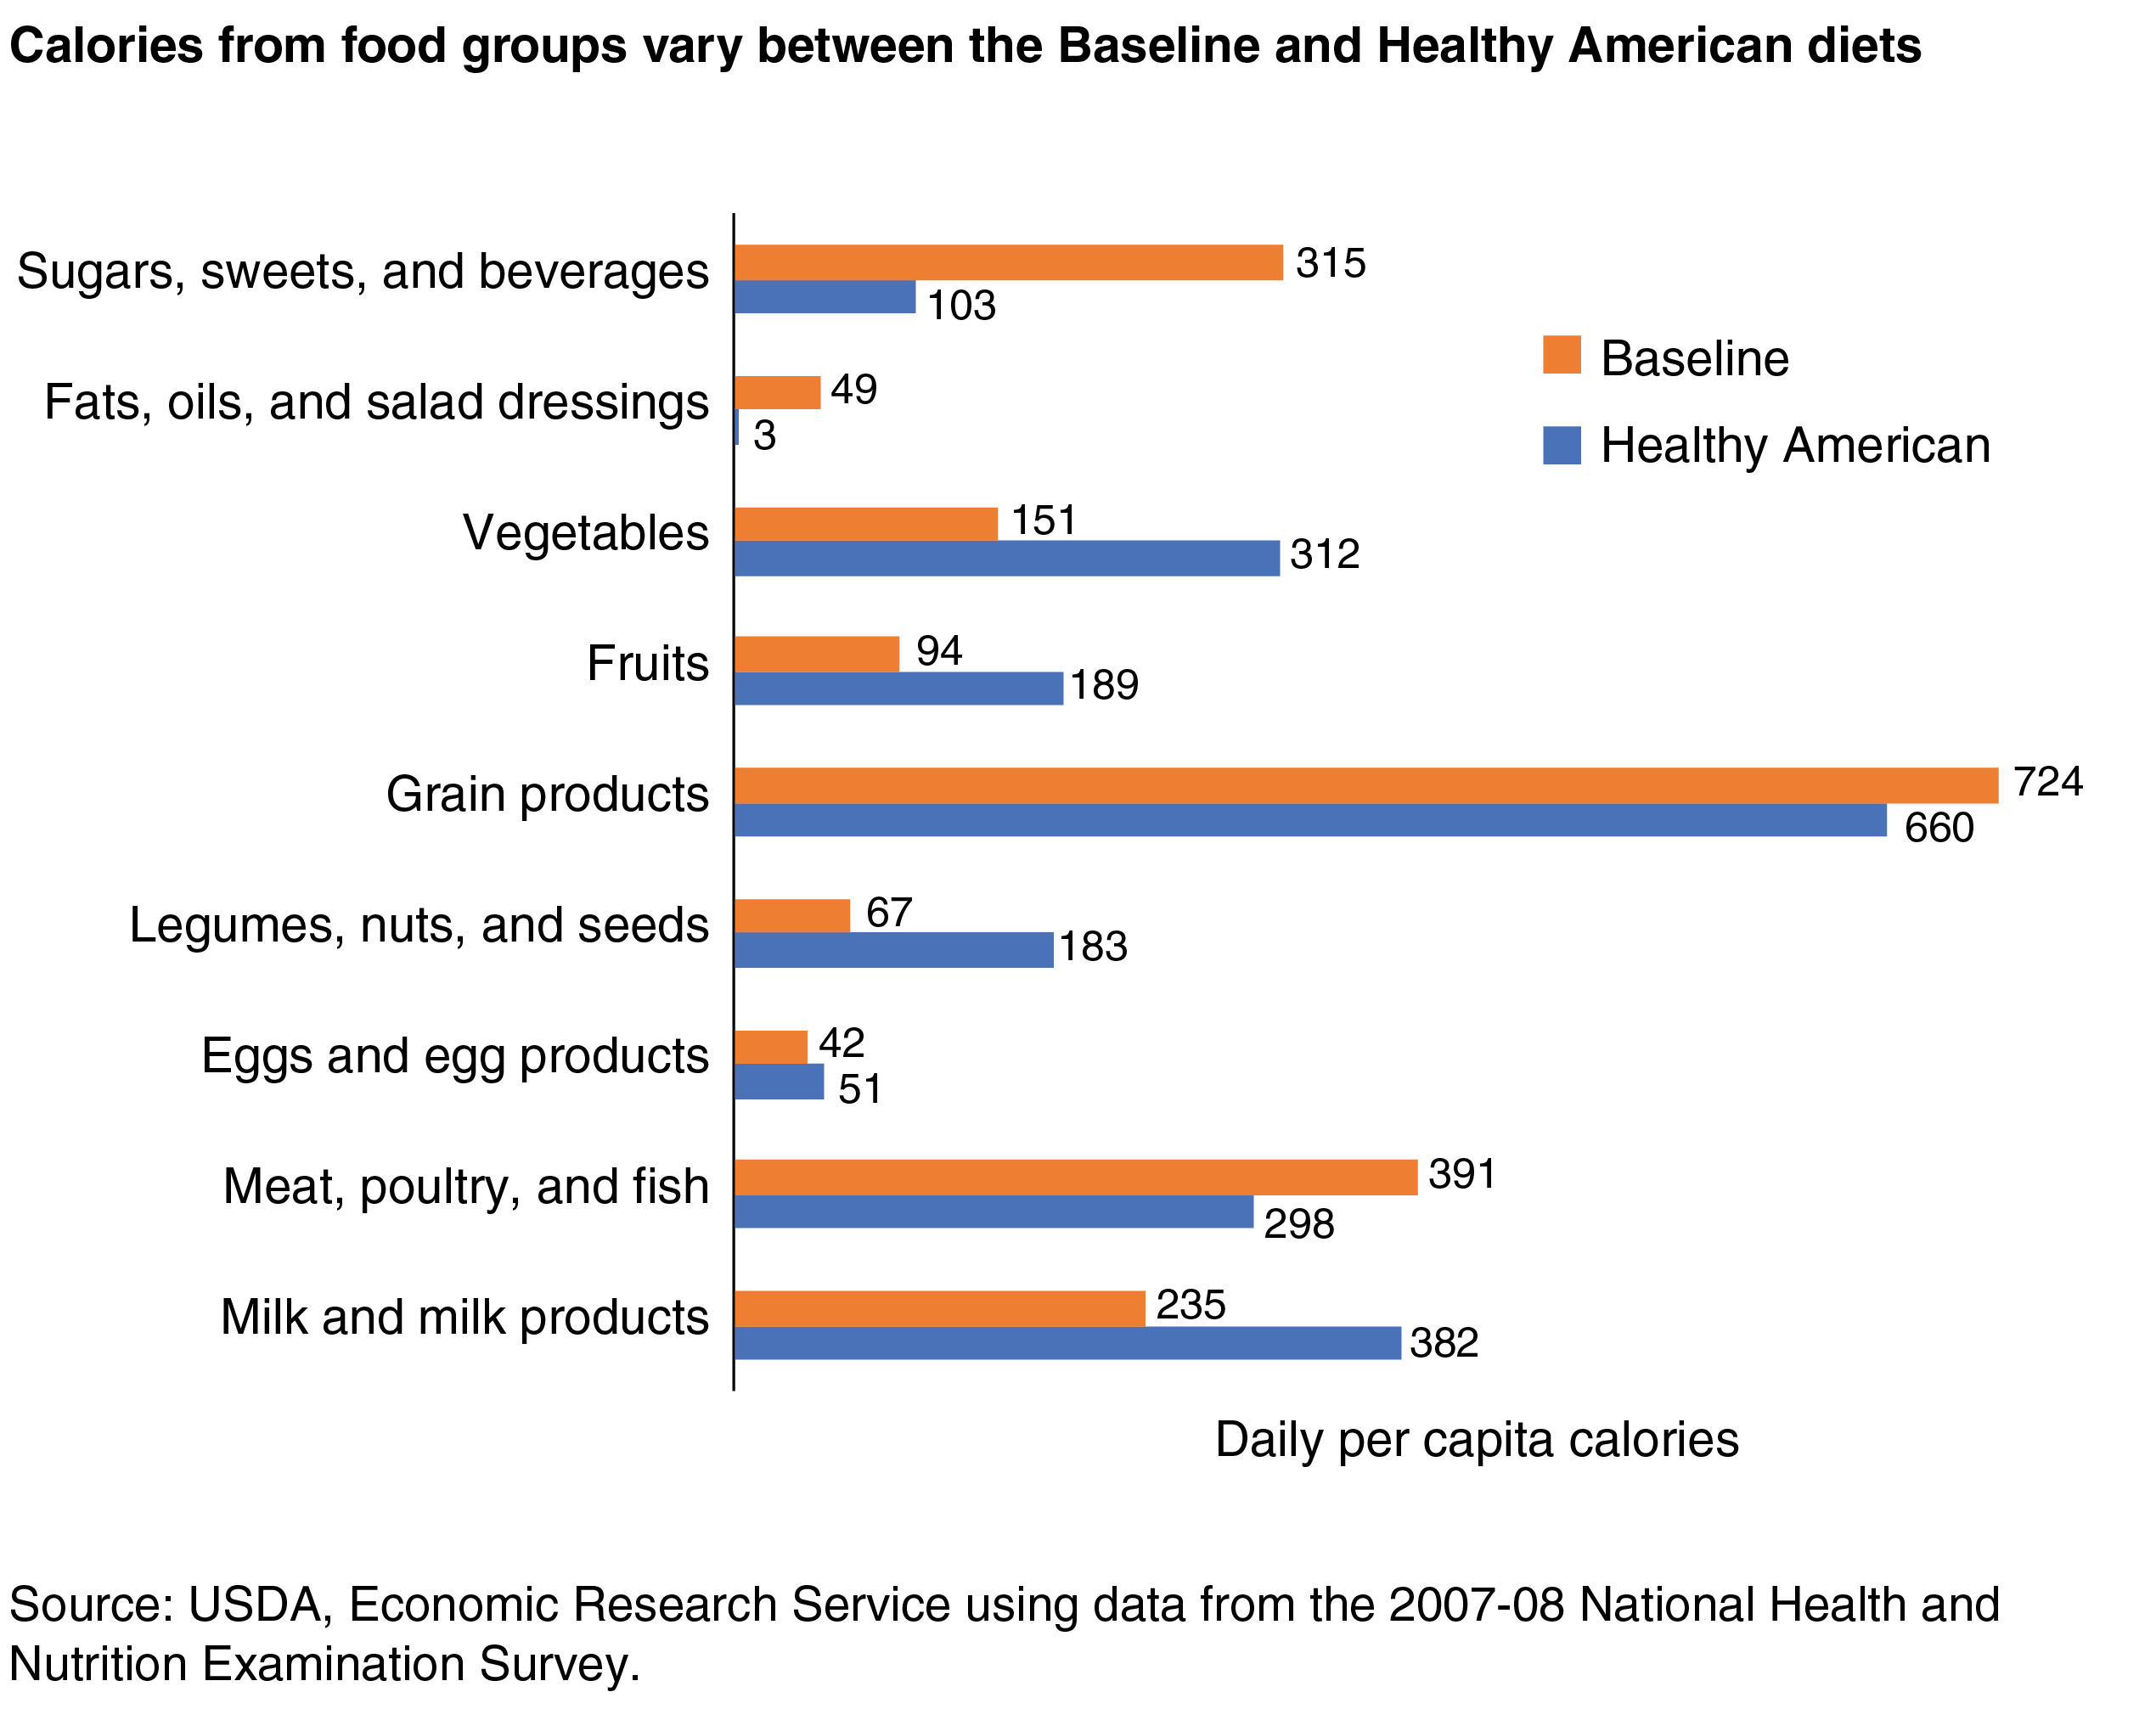
In moving from the Baseline to the Healthy American diet, the largest percentage reductions in consumption occur in the “Sugars, sweets, and beverages” and “Fats, oils, and salad dressings” categories, while the largest increases are for “Legumes, nuts, and seeds,” “Fruits,” and “Vegetables.” Consumption of “Milk and milk products” is also higher in the Healthy American diet. In addition to calorie changes in overall food categories, there are shifts within categories of individual food items, changing the dietary composition. Differences between the two diets are substantial, which suggests potentially large differences in use of the natural resources required to produce the foods that make up each diet.
Identifying and Estimating Resources Used in the U.S. Food System
ERS researchers defined the U.S. food system as all businesses that are either directly or indirectly involved in producing and marketing food products purchased by American consumers. They also included the operating of home kitchens (including travel to purchase food). Restaurants and other eating-out places are included in the study’s definition of the food system, although not the travel required for eating out due to difficulties measuring this travel.
To estimate resource requirements in the U.S. food system, ERS economists developed the Food Environment Data System. This data system incorporates both dollar units and physical units of measurement. The data system estimates resources used throughout the food supply chain from the production of farm inputs, such as fertilizers and feed, through points of consumer food purchases in grocery stores and eating-out places, to the operation of home kitchens.
For example, researchers can use the data system to estimate total freshwater withdrawals associated with a home-prepared hamburger, such as the beef animal’s drinking needs, irrigation of the crops that become livestock feed, water used in electricity generation that ultimately runs the refrigerated meat case at the grocery store, and water for rinsing dishes in the kitchen sink. Land use was estimated using a biophysical model called Foodprint. The land requirement for producing each food commodity in the Baseline and Healthy American diets was calculated based on national estimates of crop yields, grazing land productivity, and livestock feed efficiencies. The boundary of their land use analysis was agricultural land. The analysis did not include, for example, the use of land for producing food-related forest products and mining fossil fuels.
For this analysis of the natural resources used to feed the entire U.S. population ages 2 and above, the researchers excluded the resources used to produce farm commodities and foods for the export market and for the nonfood domestic market. Their analysis does not include resource use in other countries to produce foods and ingredients imported to the United States and purchased by U.S. consumers, although it does include the resources used to transport and market these imports once they enter the country. Finally, the analysis does not include the resources used to produce the food and beverages purchased by Americans when traveling abroad or by tourists visiting the United States.
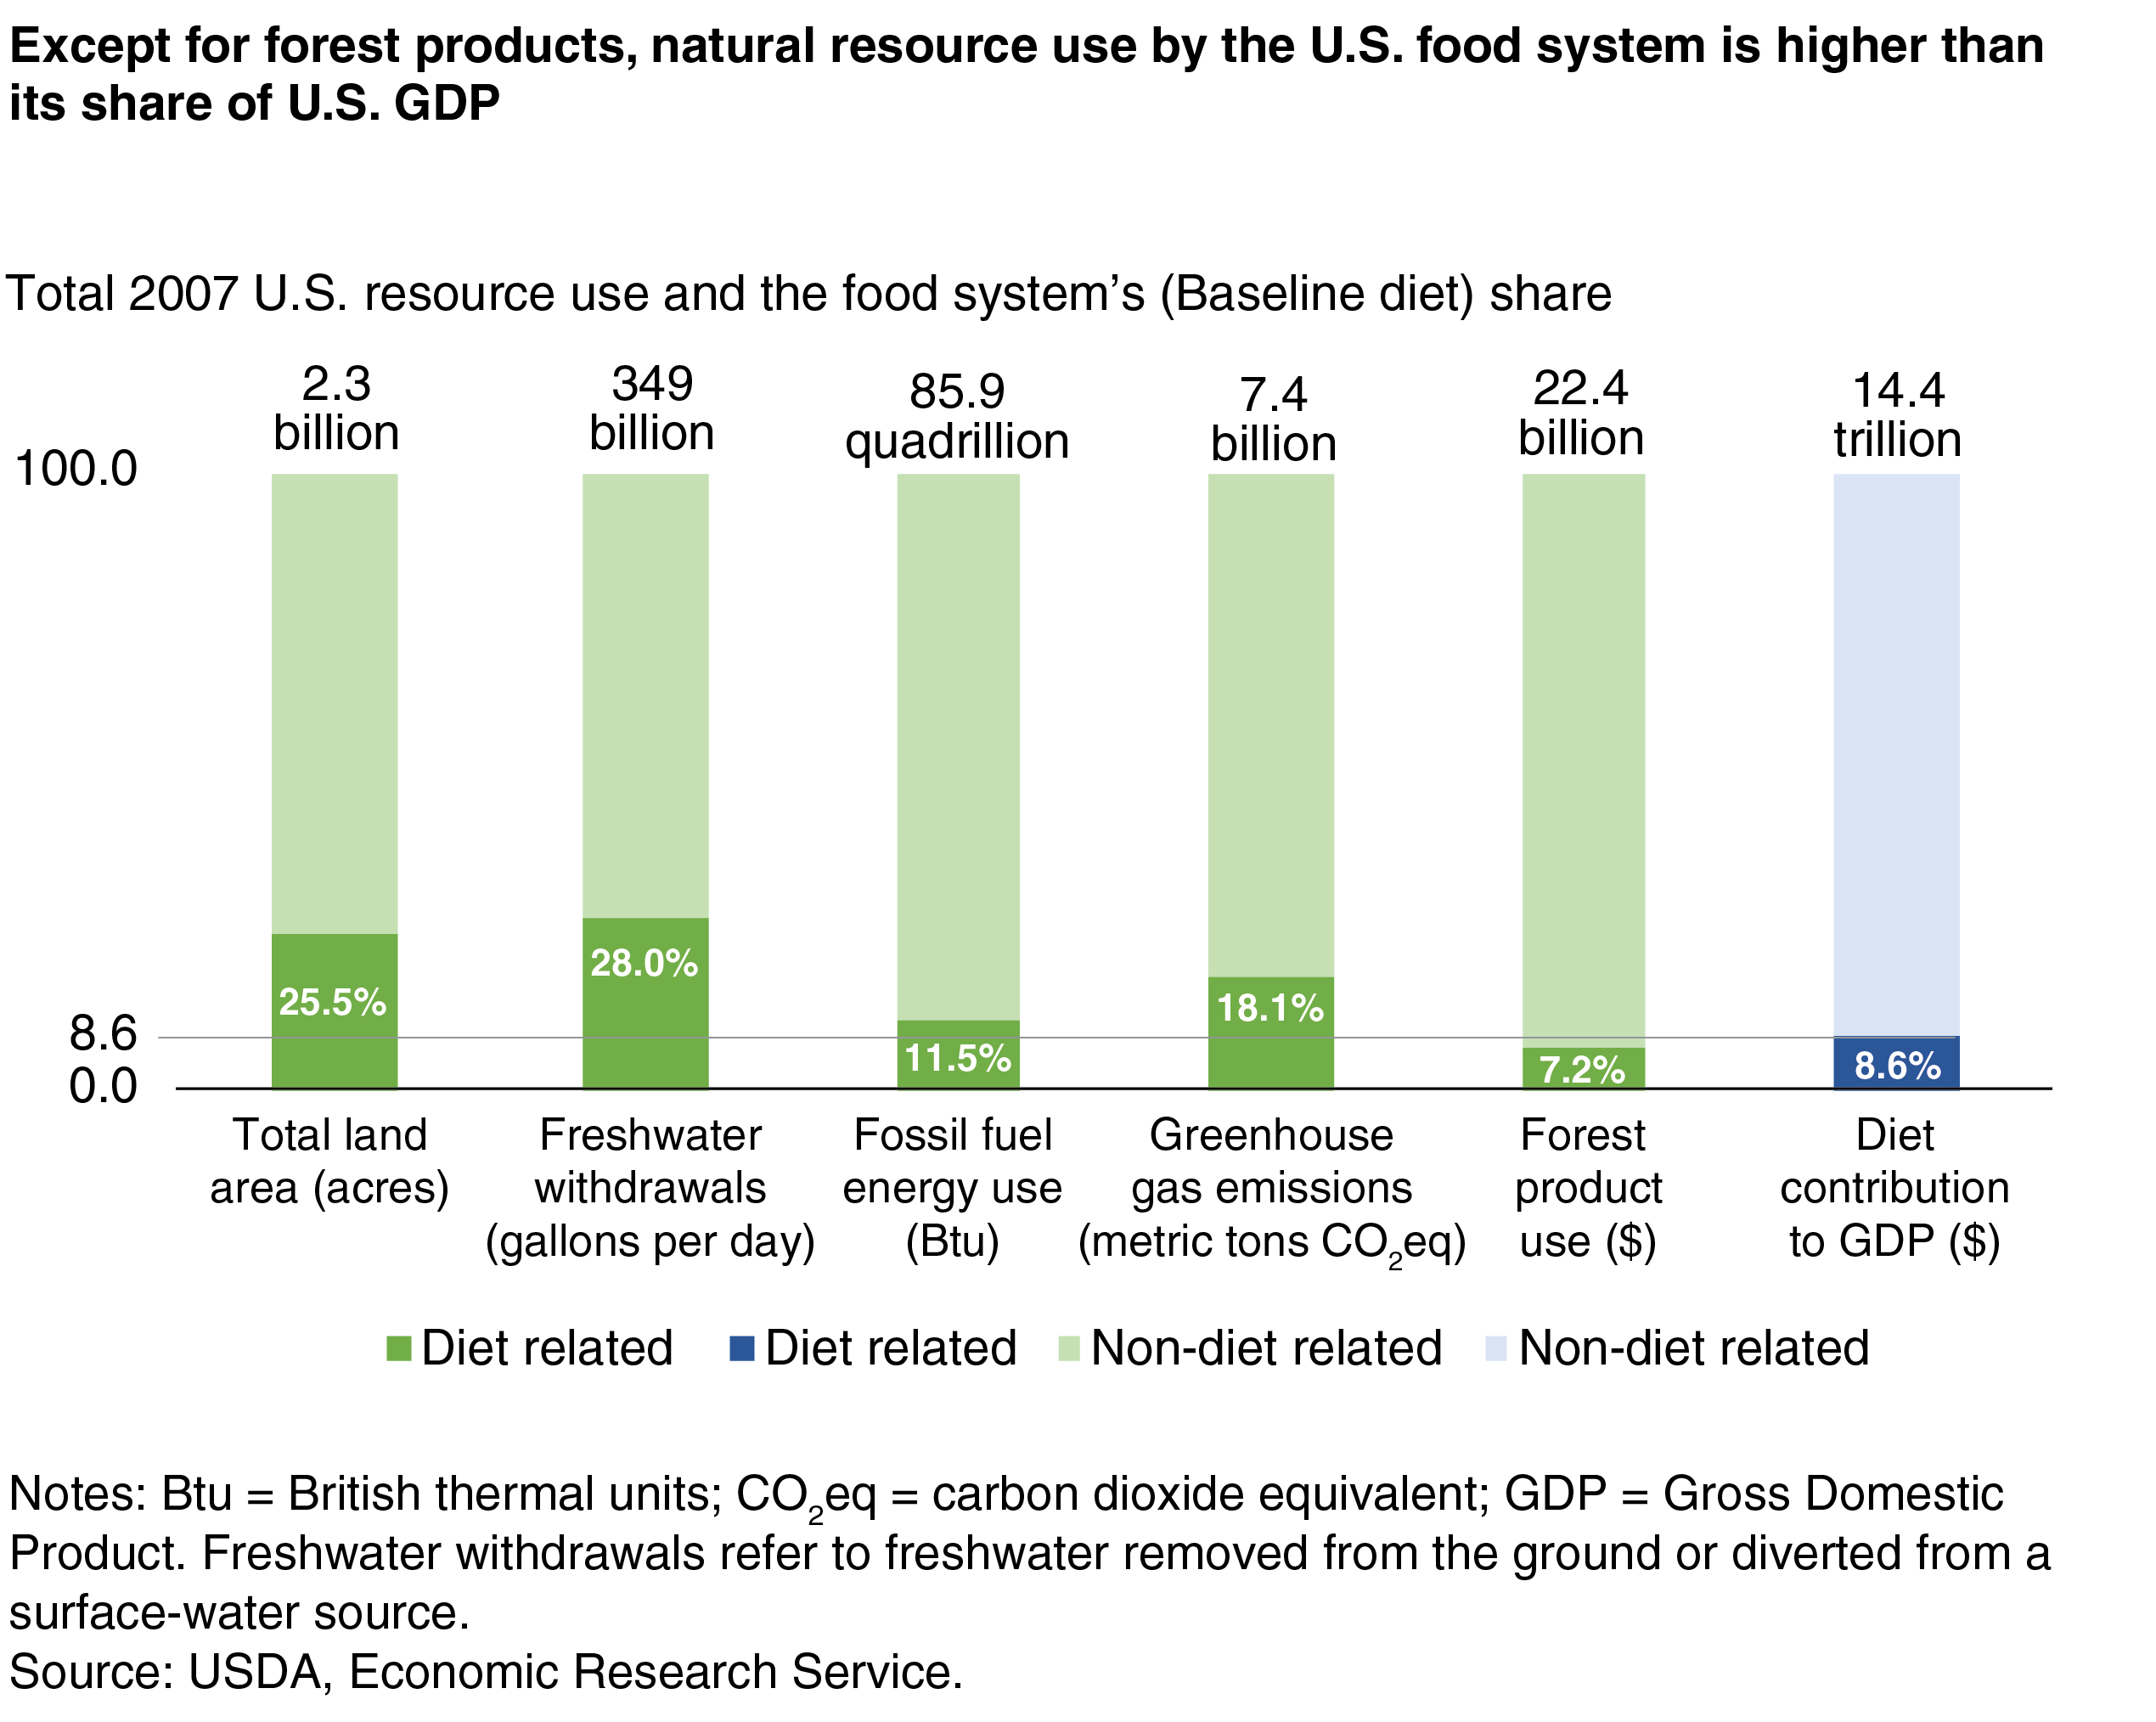
To accommodate all U.S. diets in 2007, the U.S. food system used 25.5 percent of the country’s nearly 2.3 billion acres of total land area, including over half (53 percent) of agricultural land. This finding partially reflects the fact that much of U.S. cropland is devoted to nonfood crops, like cotton and corn for producing ethanol, and to export crops like soybeans.
In 2007, the U.S. food system also used an estimated 28 percent of total freshwater withdrawals, 11.5 percent of the country’s 85.9 quadrillion British thermal unit (Btu) annual fossil fuel budget, and 7.2 percent of the $22.4 billion of marketed forest products. Forest products used throughout the food system include lumber for building materials and paper products used as packaging and for office supplies.
Air represents a natural resource that is degraded by the addition of greenhouses gases. The food system produces greenhouse gas emissions from both the burning of fossil fuels in food production and from biogenic sources, including methane and nitrous oxide emissions from cropland and the digestive process of livestock. The food system accounted for an estimated 18.1 percent of the roughly 7.4 billion metric tons of annual U.S. greenhouse gas emissions in 2007.
Hydrofluorocarbons, a group of very potent greenhouse gases, are used as coolants in refrigeration and air conditioning. The researchers were only able to account for hydrofluorocarbon emissions for the transportation sector of the food system because of data limitations. Including hydrofluorocarbon emissions from outside the transportation sector would increase the estimate of greenhouse gas emissions produced by the food system.
Total annual expenditures on food in the United States was 8.6 percent of U.S. gross domestic product (GDP) in 2007. Any natural resource having greater than 8.6 percent of its 2007 domestic supply dedicated to producing or marketing food is referred to by the researchers as an intensive use of the resource by the food system. With the exception of forest products, each resource was an intensive-use resource.
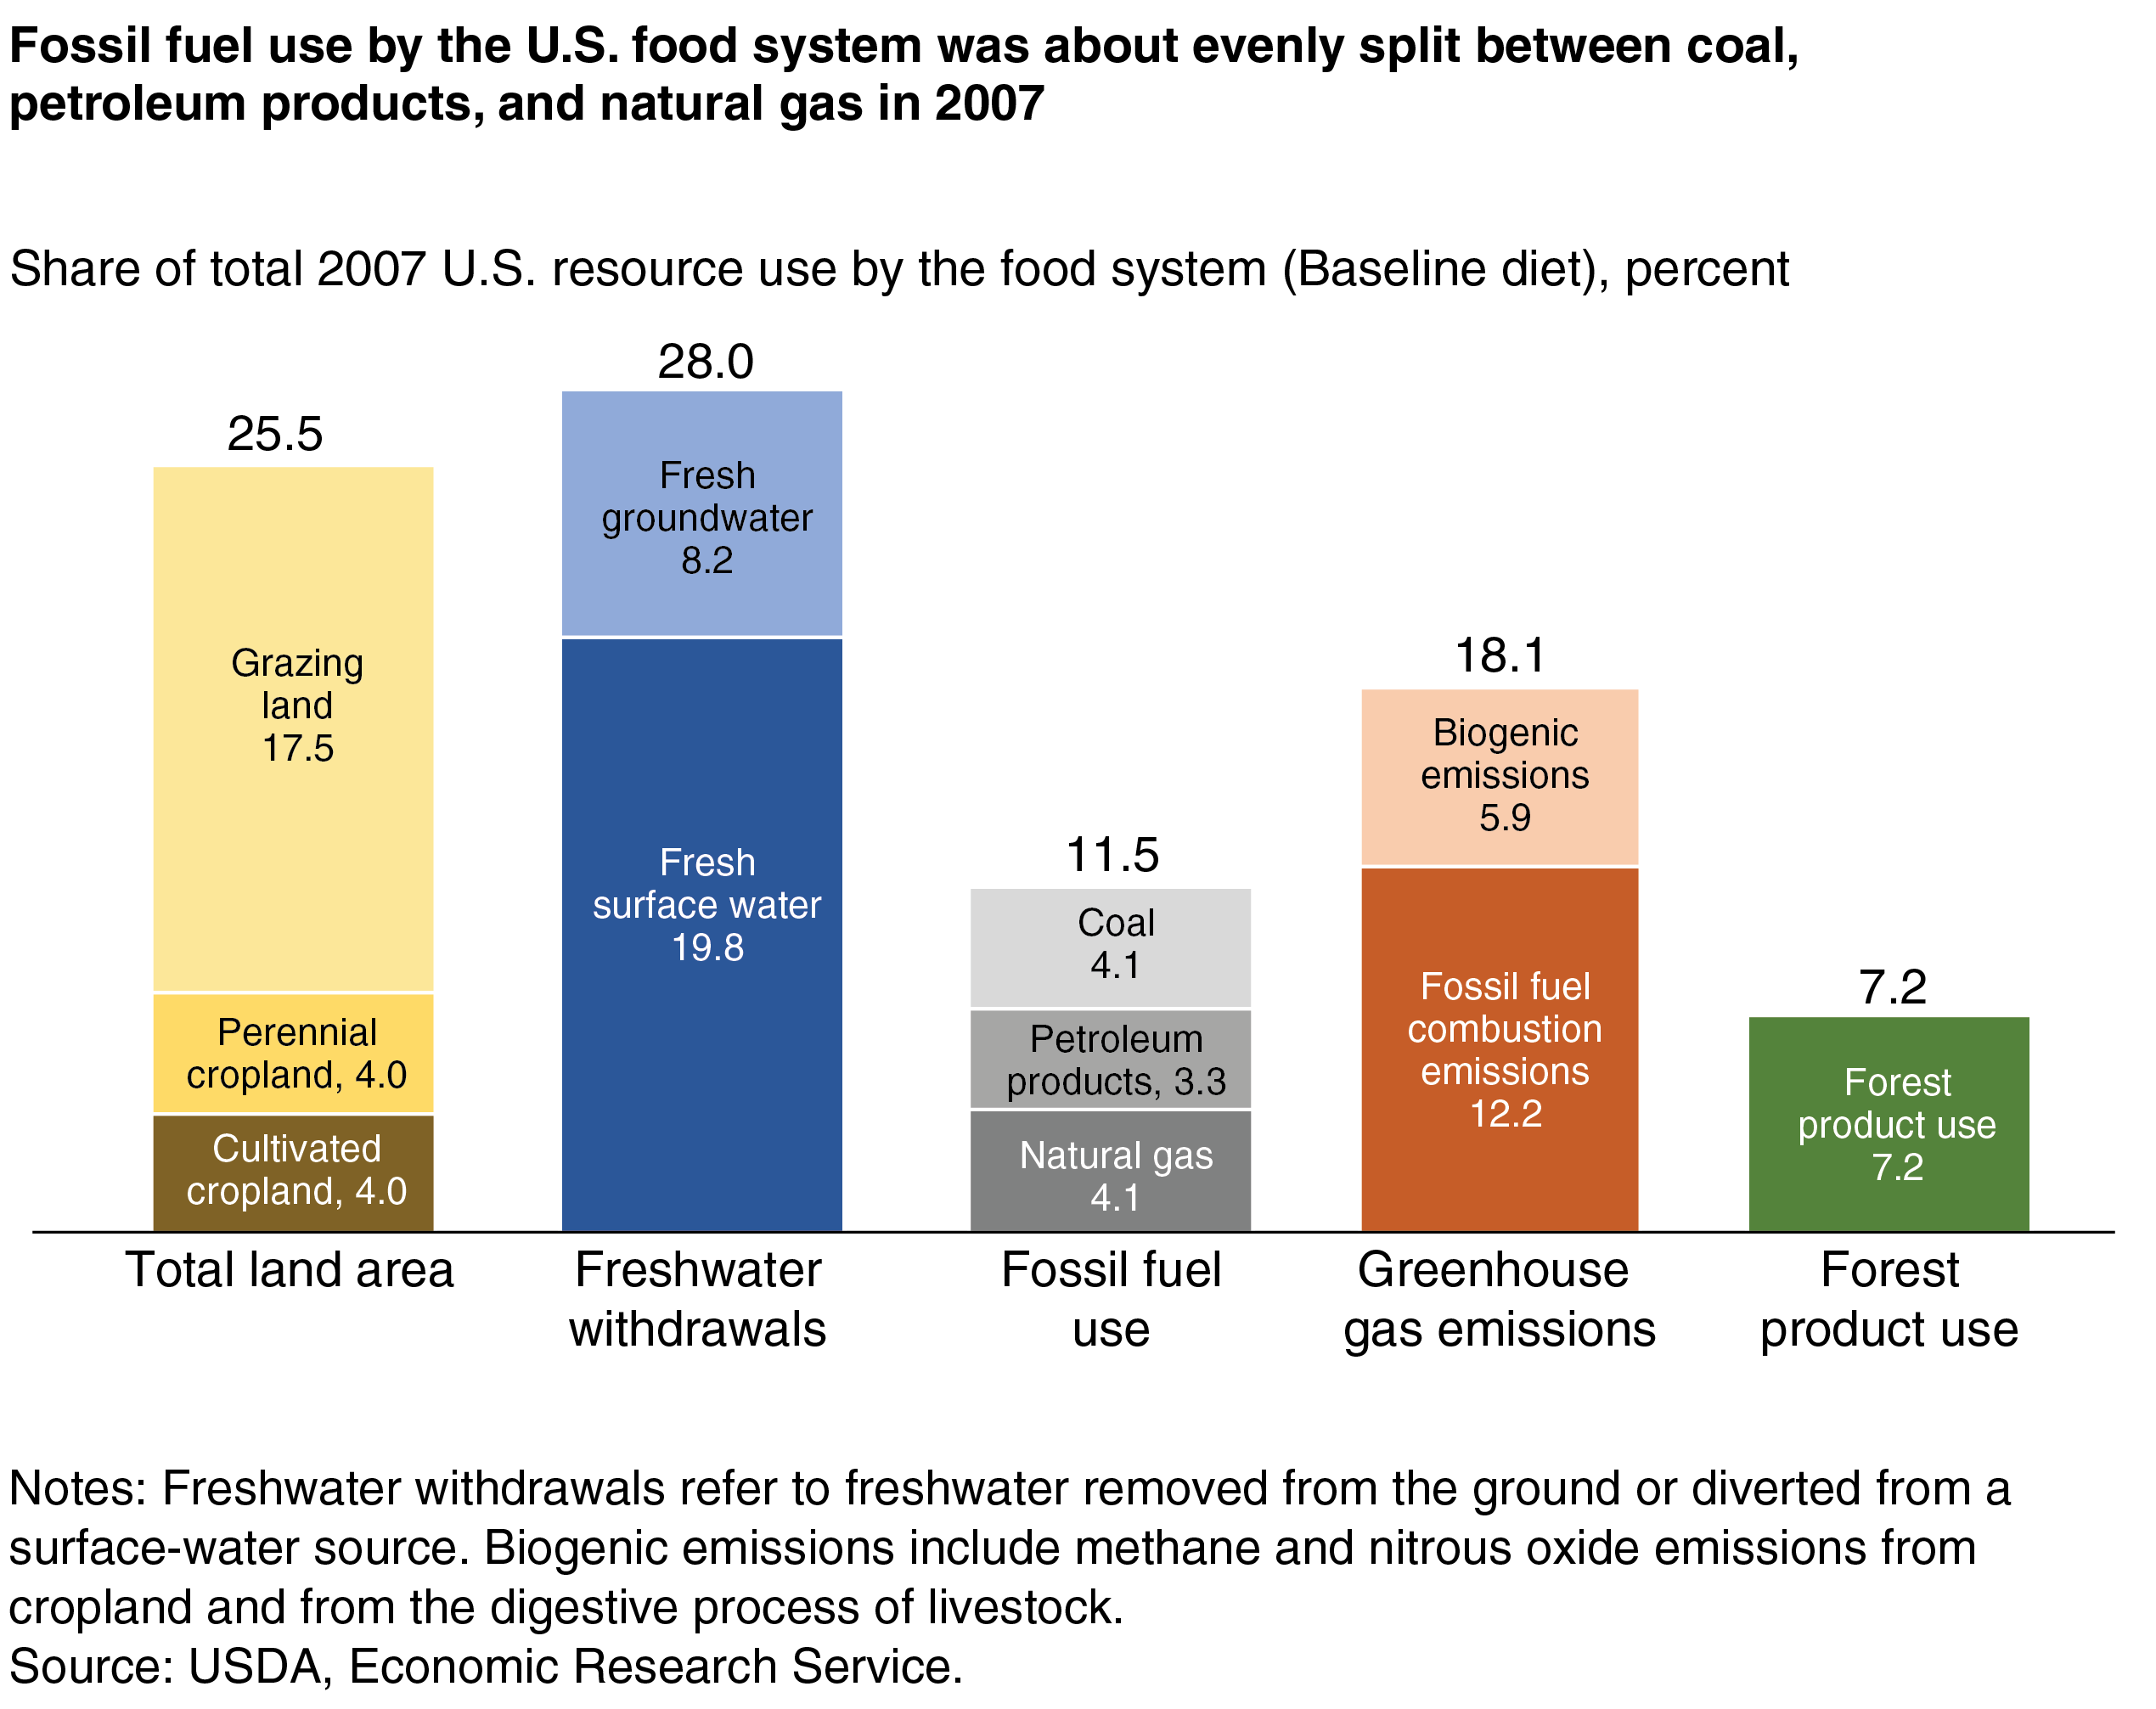
Grazing land is the largest portion of the land dedicated to the Baseline diet. Its 397-million-acre requirement in 2007 represents about two-thirds of the land used to produce the Baseline diet. Land used to grow crops that are alive year-round (perennial crops) and are fed to livestock, such as alfalfa and other hay crops, totaled 91 million acres. Diet-related cultivated cropland similarly totaled about 90 million acres.
For freshwater, about 70 percent of food-related withdrawals came from surface water sources, with the remainder coming from ground water. According to data from the U.S. Geological Survey, over 75 percent of all freshwater withdrawals in 2005 were from surface water, which indicates that the U.S. food system is somewhat more reliant on groundwater sources than the nonfood economy.
Two-thirds of the greenhouse gas emissions from producing the Baseline diet come from the use of fossil fuels by the food system; biogenic emissions from livestock and crops account for the remaining one-third. Biogenic greenhouse gas emissions associated with the Baseline diet account for 5.9 percent of U.S. total greenhouse gas emissions. Because it is not their objective to estimate greenhouse gas emissions related to the production of cotton, biofuel feedstocks, and food items exported to other countries, the researchers obtained a lower estimate than the U.S. Environmental Protection Agency’s estimate of biogenic greenhouse gas emissions of 8.1 percent for 2007.
Resource Use Varies Across the Food System
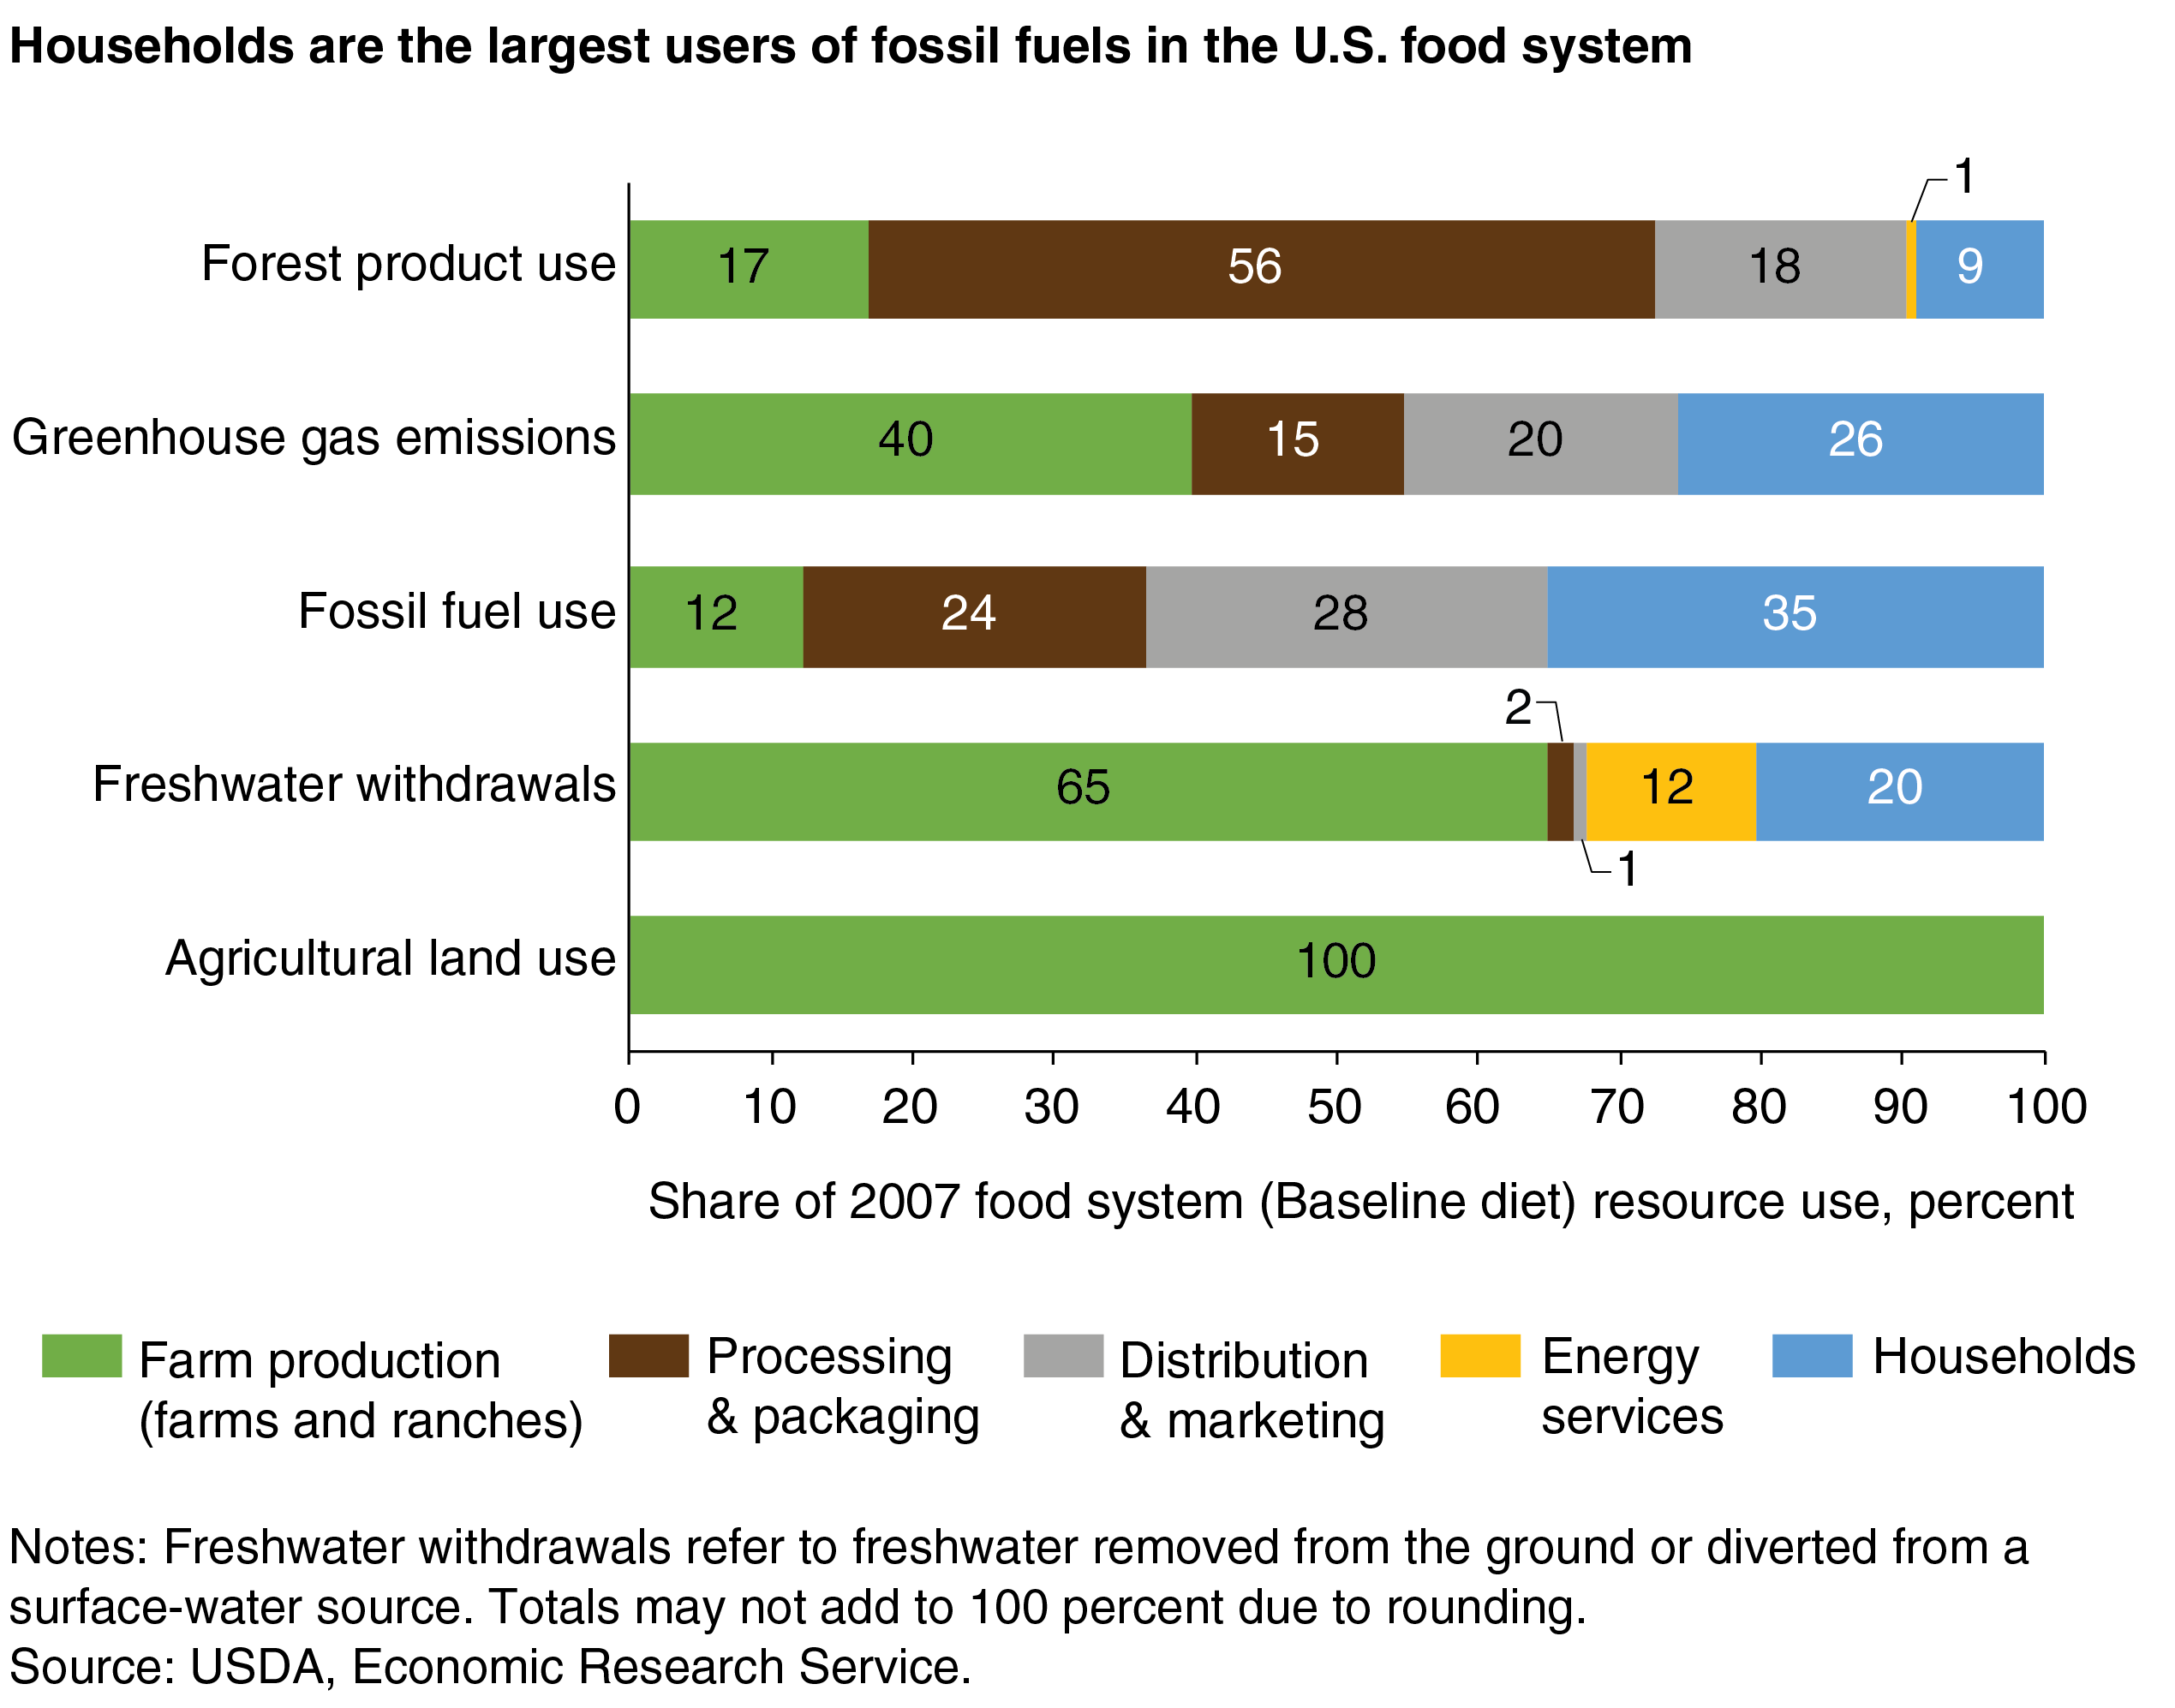
Knowing where resource use accumulates is fundamental to understanding what factors influence resource-use decisions. For freshwater withdrawals, it is not surprising that farm production (farms and ranches) is the dominant user because of irrigation, but perhaps it is surprising that slightly over a third of water withdrawals in the Baseline diet occurs after the farm, including in household kitchen use (20 percent) and in the energy industry (12 percent). By comparison, water use at the processing and packaging and the distribution and marketing stages are relatively small.
Farm production (including inputs such as fossil fuels used to produce chemical fertilizers) is the first and the smallest user of fossil fuels; households are the last and largest user. Forty percent of greenhouse gas emissions in food production are from farms and ranches, followed by households and then companies that distribute and market food. For forest products, the greatest use occurs during processing and packaging, with paper-based packaging accounting for most of this use.
Resource Use Tradeoffs Between the Two Diets
For the next part of their analysis, ERS researchers posed this question: How would use of natural resources change in the United States if the Healthy American diet became the average national diet? Under the Healthy American diet, consumers would obtain more of their calories from vegetables, fruits, dairy products, and legumes, nuts, and seeds. They would consume fewer grain products, meats and poultry, sweets, soft drinks, and fats and oils.
In their analysis of the Healthy American diet, the researchers did not estimate changes in resource use by households because little research has been conducted on how household resource use is allocated to different parts of the diet. The analysis assumes that the U.S. population and the technology to grow, process, and market each unit of food do not change. External factors that could affect resource-use decisions, such as changes in import market shares or natural disasters, are also assumed to remain unchanged. For example, under the Healthy American diet, more domestic and imported fruits would be consumed to the extent that the share of the fruit market supplied by imports would remain the same.
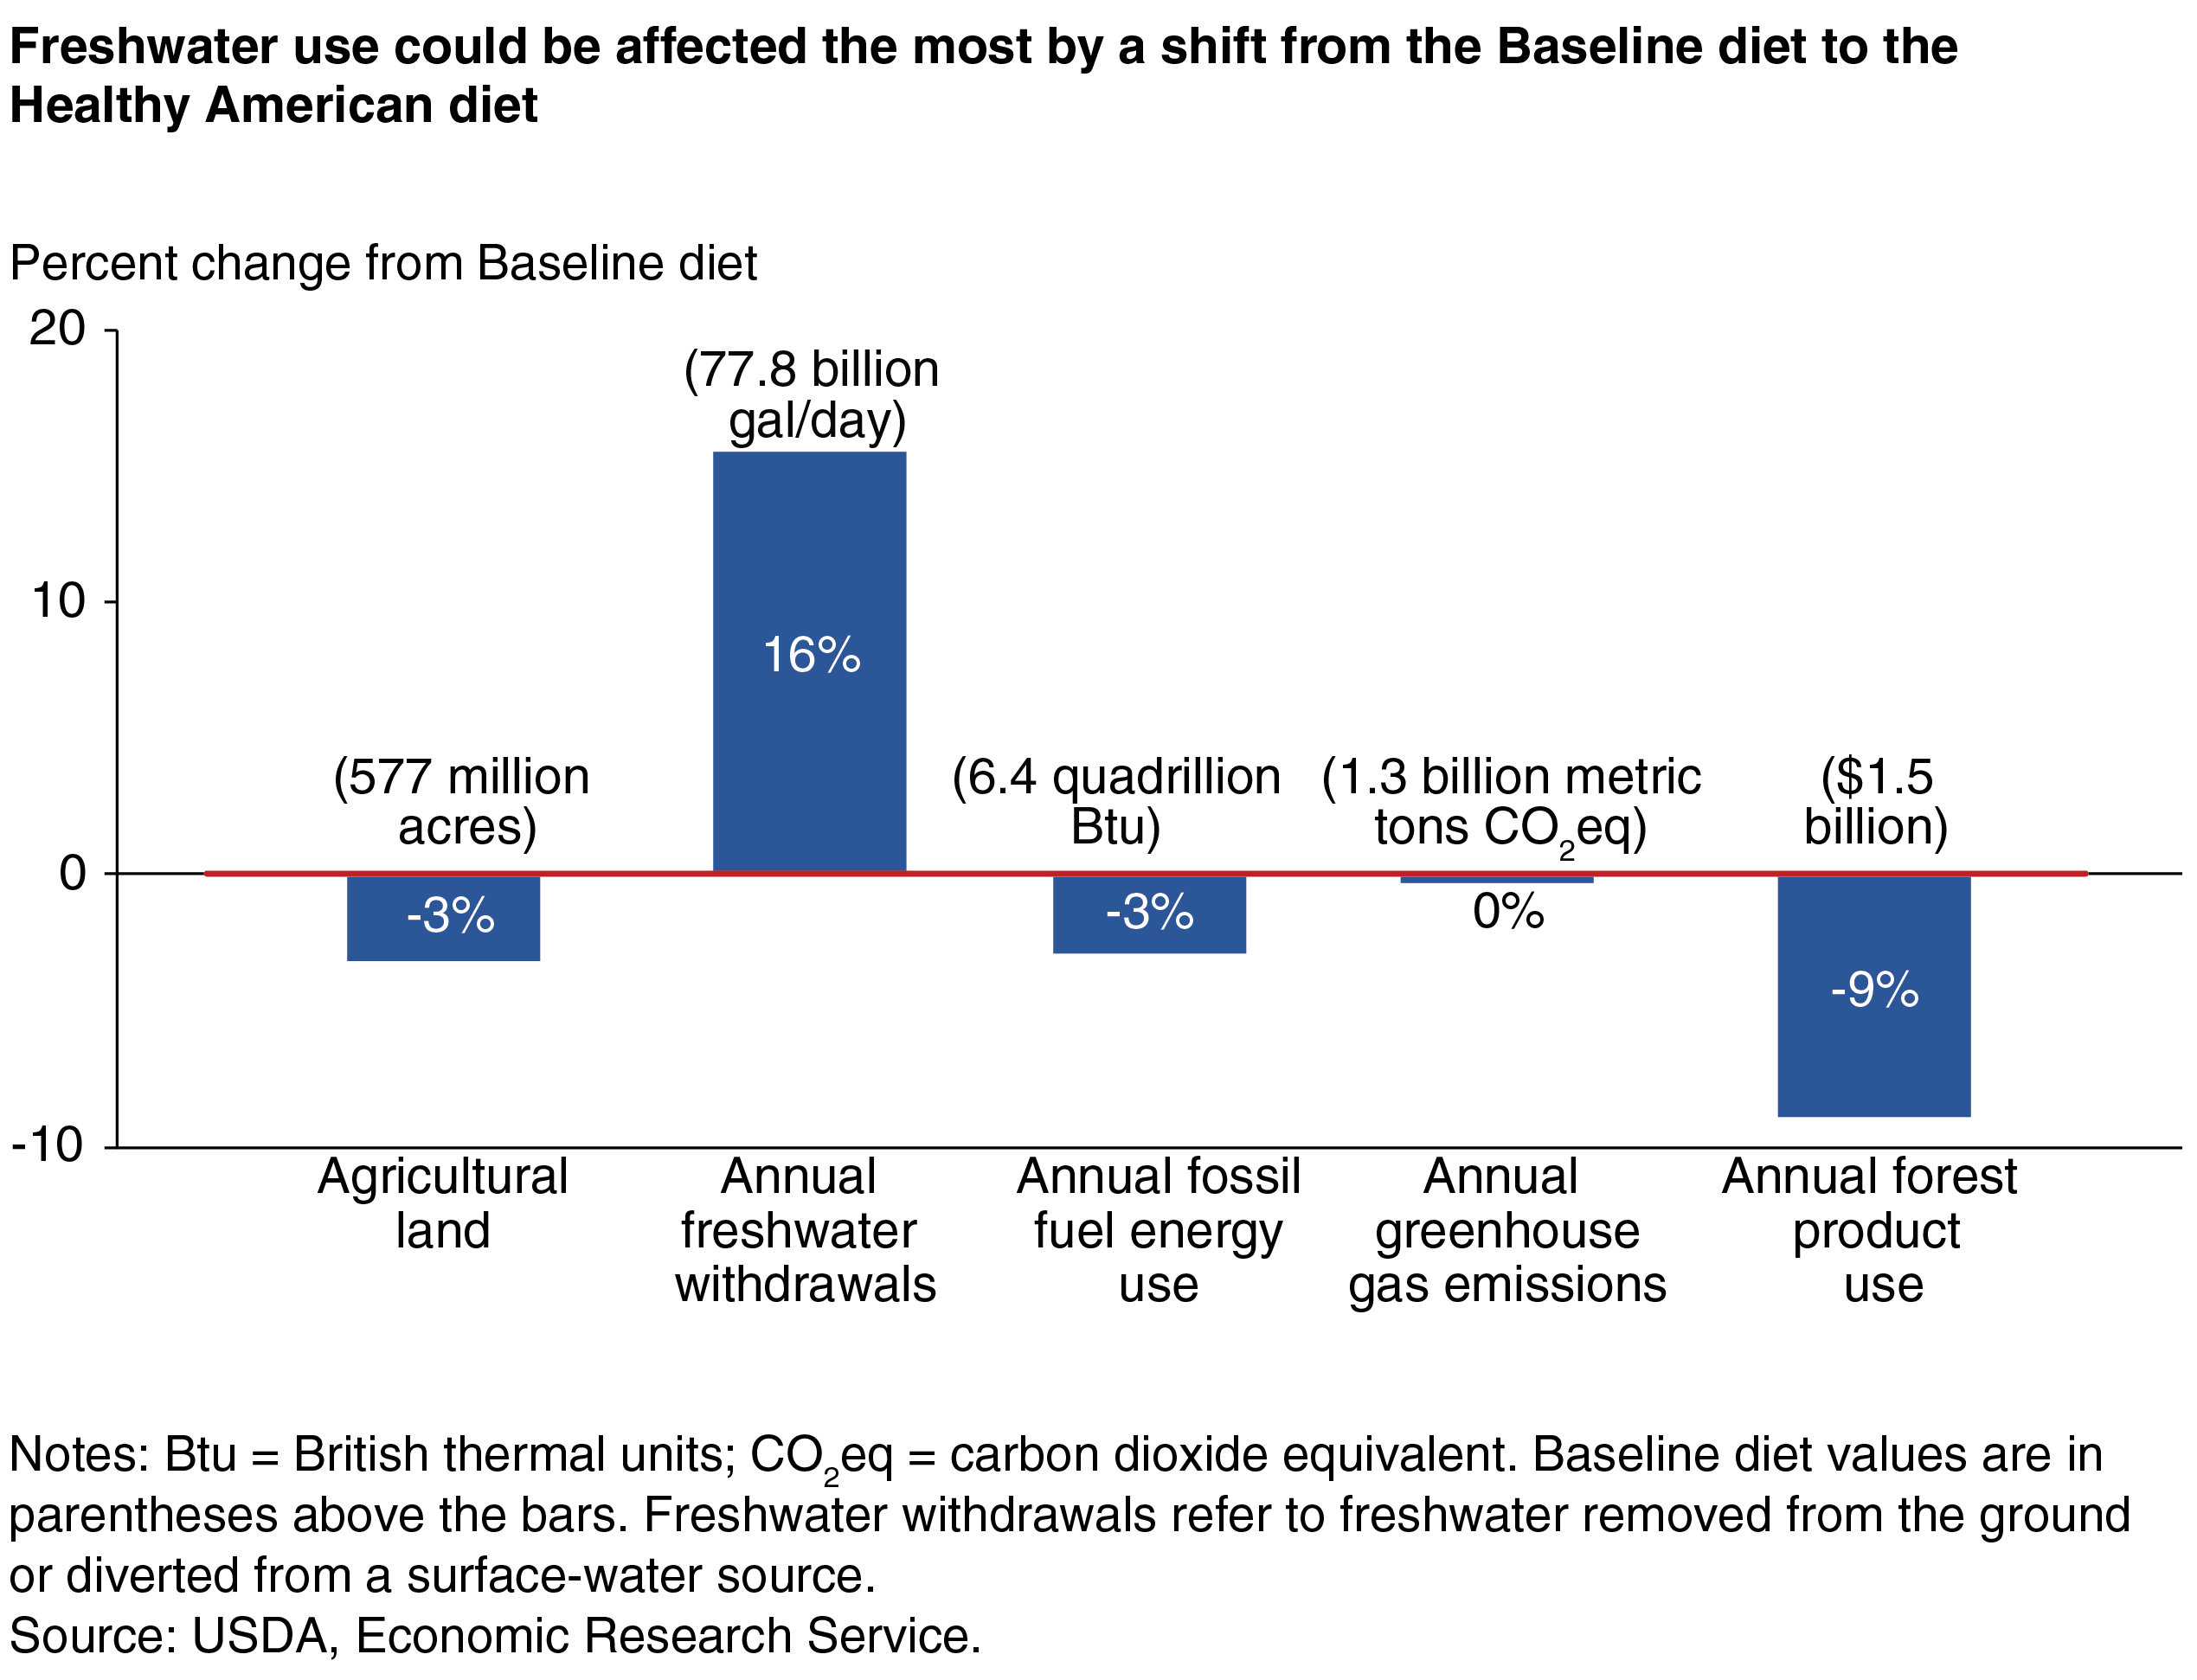
If Americans adopt the Healthy American diet, agricultural land use by the food system is estimated to decline by 3 percent—about 19 million acres, roughly the total land area of South Carolina. In particular, grazing land and perennial cropland use estimates show a decline by about 13 and 8 million acres respectively, as meat and poultry consumption falls and cultivated cropland use increases by about 2 million acres.
The effect of the overall estimated reduction in agricultural land use on resource conservation depends on what happens to the land that is taken out of agricultural production. The reduction in grazing land and perennial cropland could result in improved environmental outcomes, for example, if the land is enrolled in USDA’s Conservation Reserve Program. If it is instead converted to developed land with buildings, the environmental effect of this land use change would likely be negative, resulting in a loss of wildlife habitat, for example. The increase in cultivated cropland, if it comes from less-intensive land uses such as grazing land, would likely result in an increase in environmental costs, such as greater erosion potential and a loss of sequestered soil carbon. However, the net effect would depend on the type of practices put in place on the converted land (e.g., conventional versus conservation tillage).
Other estimated impacts on natural resource use from a shift from the Baseline to the Healthy American diet include:
- A 3-percent decline in the use of fossil fuels—about equal to the average annual gasoline consumption of 3 million cars in 2015;
- A minimal decline in the use of air to store diet-related greenhouse gases (about 0.4 percent) as emissions reductions from the production of sugars, sweets, and soft drinks are offset by increased emissions from dairy, fruit, vegetable, and nut production;
- A 9-pecent decline in the use of forest products, with most of the savings coming from the processing and packaging stage of the food system. This reduction is equivalent to 11 percent of total U.S. timber product production in 2007; and
- An increase of 16 percent in freshwater withdrawals to grow the larger quantities of fruits, vegetables, legumes, nuts, seeds, and dairy products consumed in the Healthy American diet. This 16-percent increase translates to an additional withdrawal of 12.1 billion gallons of freshwater per day. Acquiring additional freshwater could prove particularly challenging for the arid Western part of the United States where a significant share of U.S. fruits, vegetables, and nuts are grown.
The ERS study found mixed impacts on the five natural resources if Americans were to adopt a diet in keeping with the Dietary Guidelines for Americans. Use of agricultural land, fossil fuels, and forest products would decrease, while freshwater withdrawals would increase. Use of air as a repository for diet-related greenhouse gas emissions would remain essentially unchanged if all Americans, on average, shifted to the Healthy American diet. These findings are informative in considering resource requirements of food demand in the United States. A more complete assessment of resource requirements for future U.S. food demand would need to incorporate population growth or decline and changes in the technologies used to produce and market the foods that consumers demand.
Errata: On September 15, 2020, this article was revised to correctly identify the units for greenhouse gasses as metric tons throughout the article.
This article is drawn from:
- Canning, P., Rehkamp, S., Hitaj, C. & Peters, C.J. (2020). Resource Requirements of Food Demand in the United States. U.S. Department of Agriculture, Economic Research Service. ERR-273.
You may also like:
- Canning, P., Rehkamp, S., Waters, A. & Etemadnia, H. (2017). The Role of Fossil Fuels in the U.S. Food System and the American Diet. U.S. Department of Agriculture, Economic Research Service. ERR-224.
- Hitaj, C., S. Rehkamp, P. Canning, and C. Peters. “Greenhouse Gas Emissions in the US Food System: Current and Healthy Diets,” Environmental Science & Technology 53. (2019). (9): 5493-5503 (doi: 10.1021/acs.est.8b06828).
- Peters, C.J., J. Picardy, A.F. Darrouzet-Nardi, J.L. Wilkins, T. Griffin, and G.W. Fick.. (2016). “Carrying capacity of U.S. agricultural land: Ten diet scenarios,” Elementa: Science of the Anthropocene (4: 000116):1-15 (doi.org/10.12952/journal.elementa.000116).
- Rehkamp, S., and P. Canning. “Measuring Embodied Blue Water in American Diets: An EIO Supply Chain Approach”. (2018). Ecological Economics (147):179-88 (doi: 10.1016/j.ecolecon.2017.12.028).


