

Taking a Closer Look at Supplemental Nutrition Assistance Program (SNAP) Participation and Expenditures
- by Laura Tiehen
- 8/3/2020
In fiscal year 2020 (October 1, 2019–September 30, 2020), participation in USDA’s Supplemental Nutrition Assistance Program (SNAP) is expected to rise with higher unemployment during the COVID-19 pandemic. In addition to higher participation, higher benefit levels authorized during the pandemic will contribute to increased spending levels. Legislation enacted in March 2020 provided funding to accommodate increased food assistance program caseloads and temporarily boosted benefits for many SNAP participants. Preliminary national data available at the time this article was published showed 43.0 million Americans receiving SNAP benefits in April 2020.
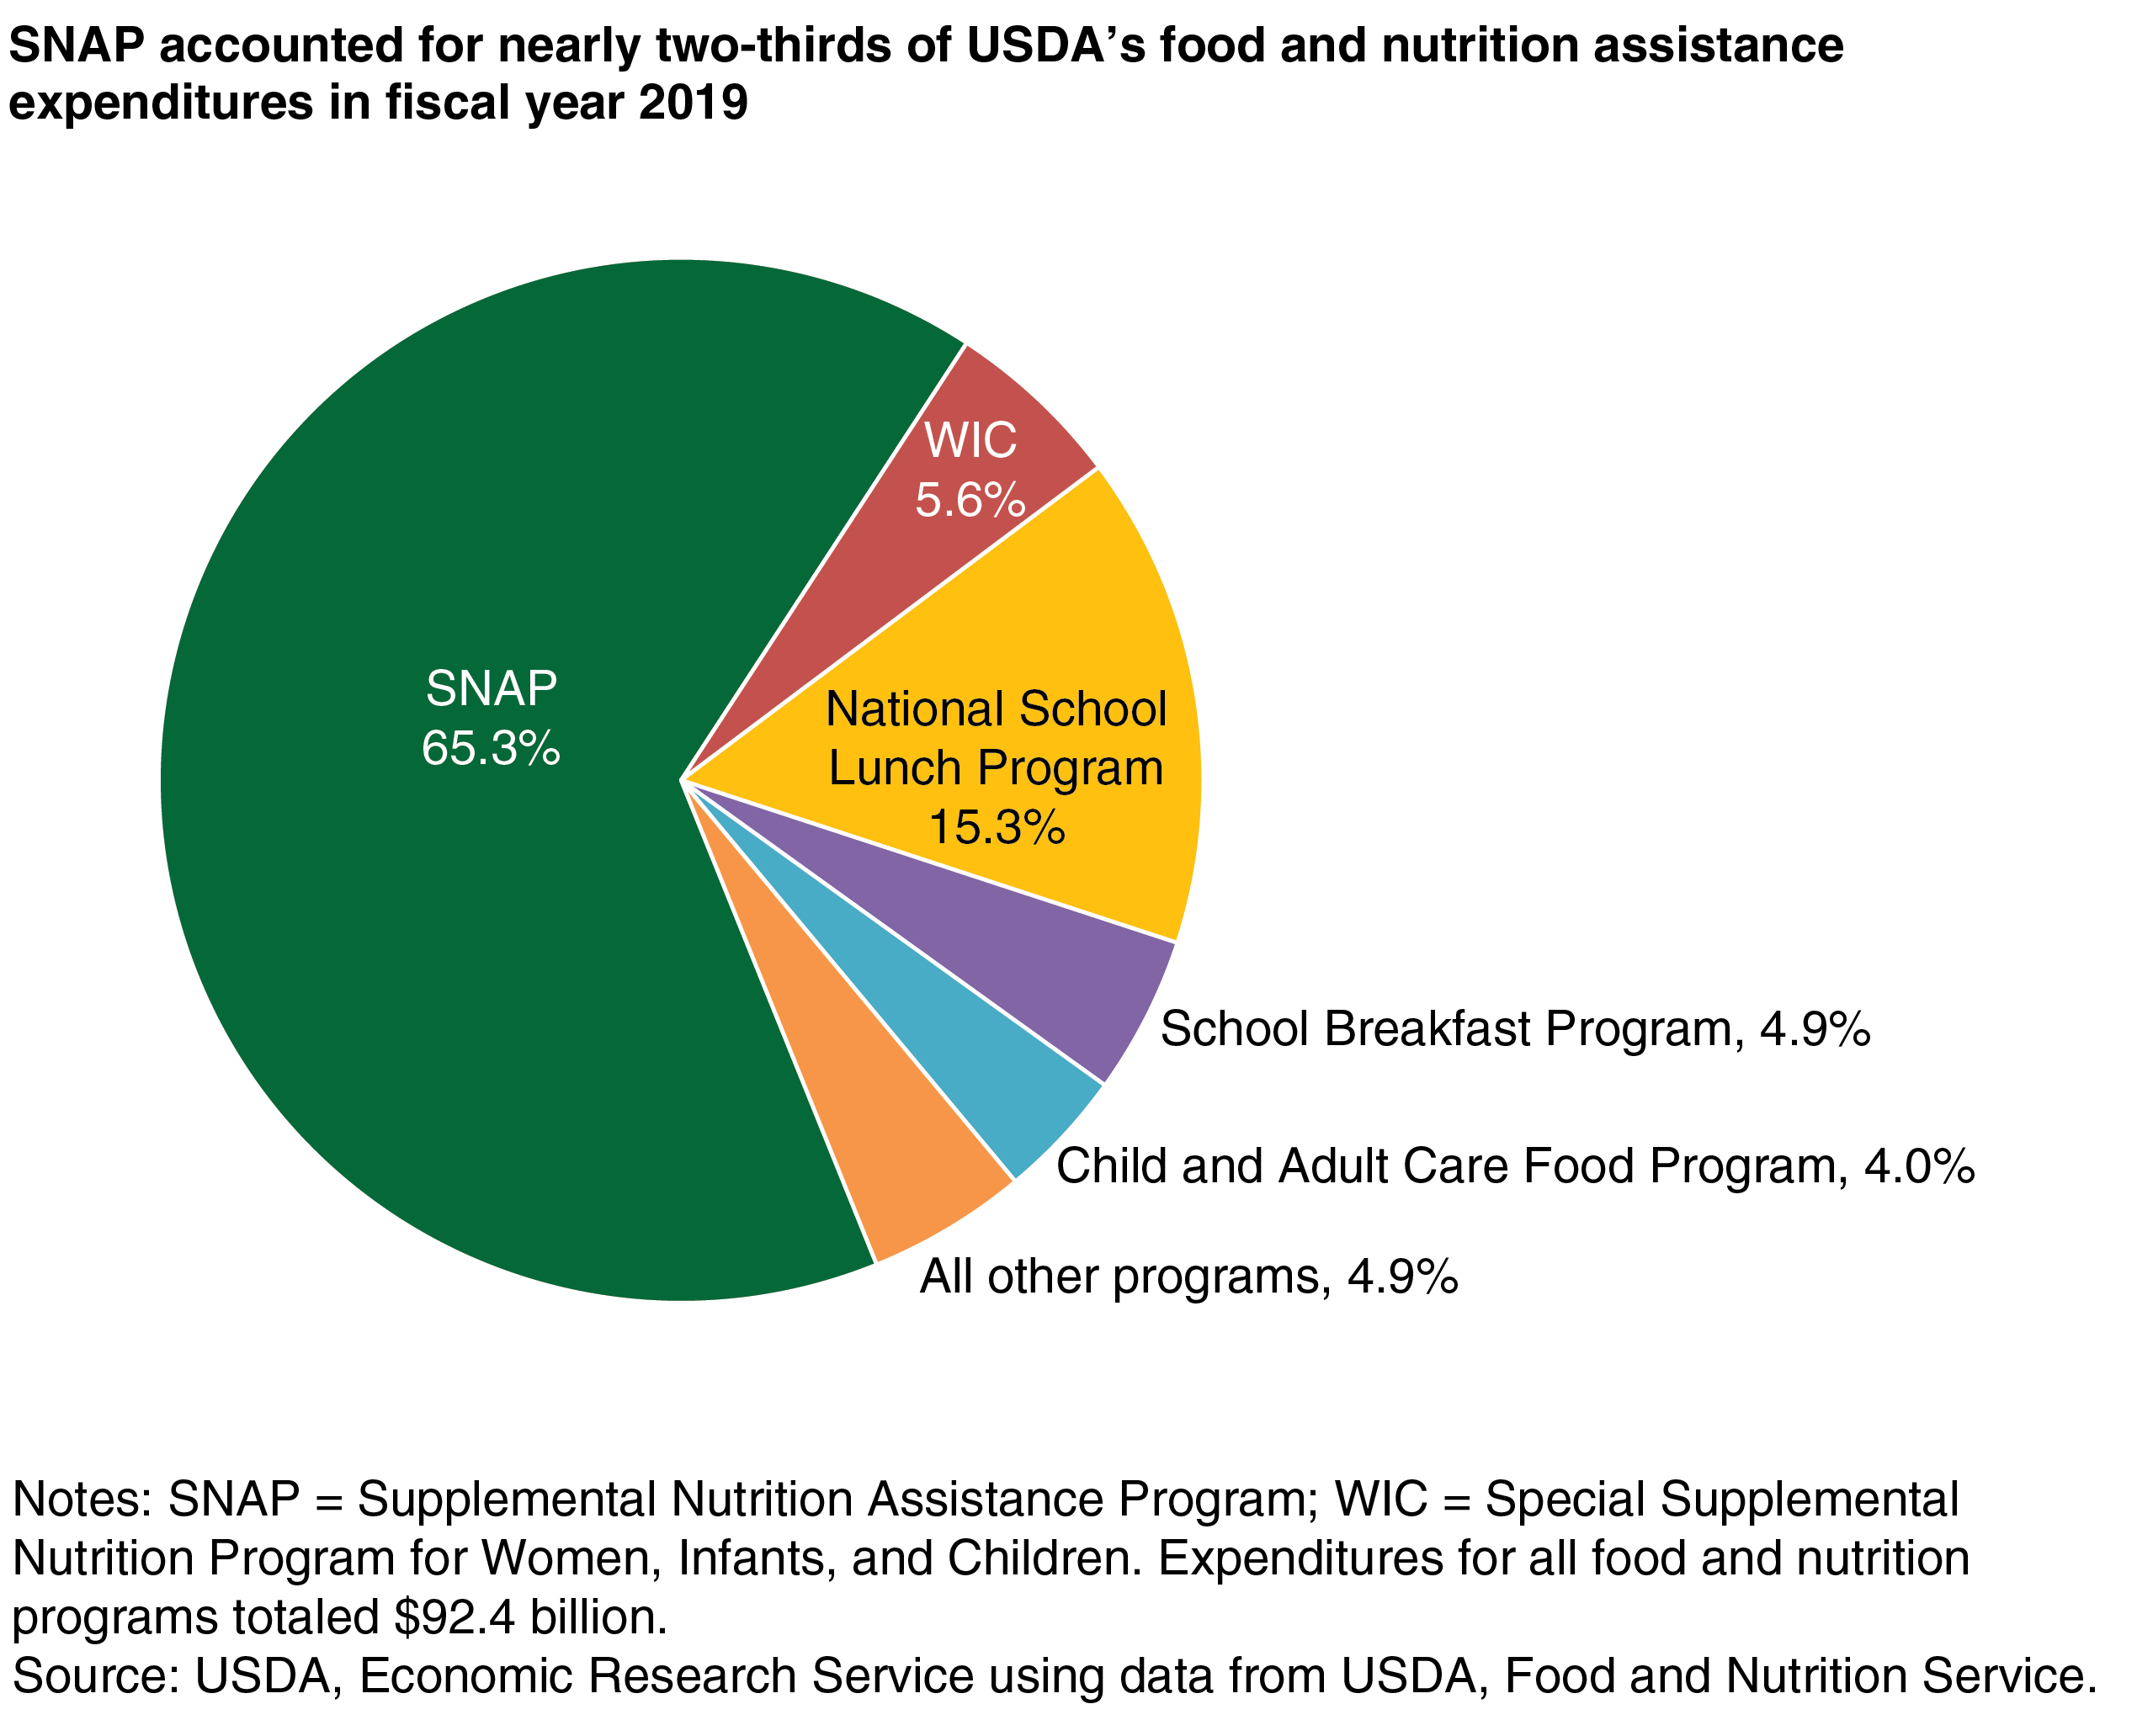
USDA administers 15 domestic food and nutrition assistance programs that affect the lives of millions of people. In fiscal year 2019 (October 1, 2018–September 30, 2019), about 1 in 4 Americans participated in at least one of these 15 programs at some time during the year. Food and nutrition assistance programs also represent a significant Federal investment. At $92 billion, these programs accounted for roughly two-thirds of USDA’s fiscal year 2019 budget. Expenditures for SNAP totaled $60.4 billion, down from a peak of $79.9 billion in 2013 following the Great Recession.
Data on participation and program costs in USDA’s food and nutrition assistance programs are collected by USDA’s Food and Nutrition Service (FNS), the agency responsible for administering the programs at the Federal level. Each fiscal year, USDA’s Economic Research Service (ERS) uses these data to provide a brief, nontechnical overview of USDA’s major food assistance programs. ERS supplements the FNS program data with U.S. Government data on population, inflation, and economic conditions to report program measures that allow for consistent comparisons over time and across population groups.
SNAP, the cornerstone of USDA’s food and nutrition assistance programs, accounted for 65 percent of all USDA food and nutrition assistance spending in fiscal year 2019. On average, 35.7 million people participated in the program each month in fiscal year 2019, or about 11 percent of the U.S. population.
Unlike other food and nutrition assistance programs that target specific groups—such as low-income school children or pregnant women—SNAP is available to most needy households with limited incomes and assets, subject to certain work and immigration status requirements. SNAP provides monthly benefits for participants to purchase food items at authorized retail food stores. SNAP benefits can be redeemed for most types of food but cannot be used to purchase tobacco, alcohol, hot foods, or foods intended to be eaten in the store (except by people who cannot cook for themselves).
Participation in SNAP is influenced by two major factors—economic conditions and program policies. Stronger economic conditions typically lead to increased employment and higher wages, decreasing the need for assistance. Differing policies related to SNAP can also influence participation. For example, allowing households to use a “simplified reporting” option that reduces requirements for reporting changes in their financial circumstances has been shown to increase participation.
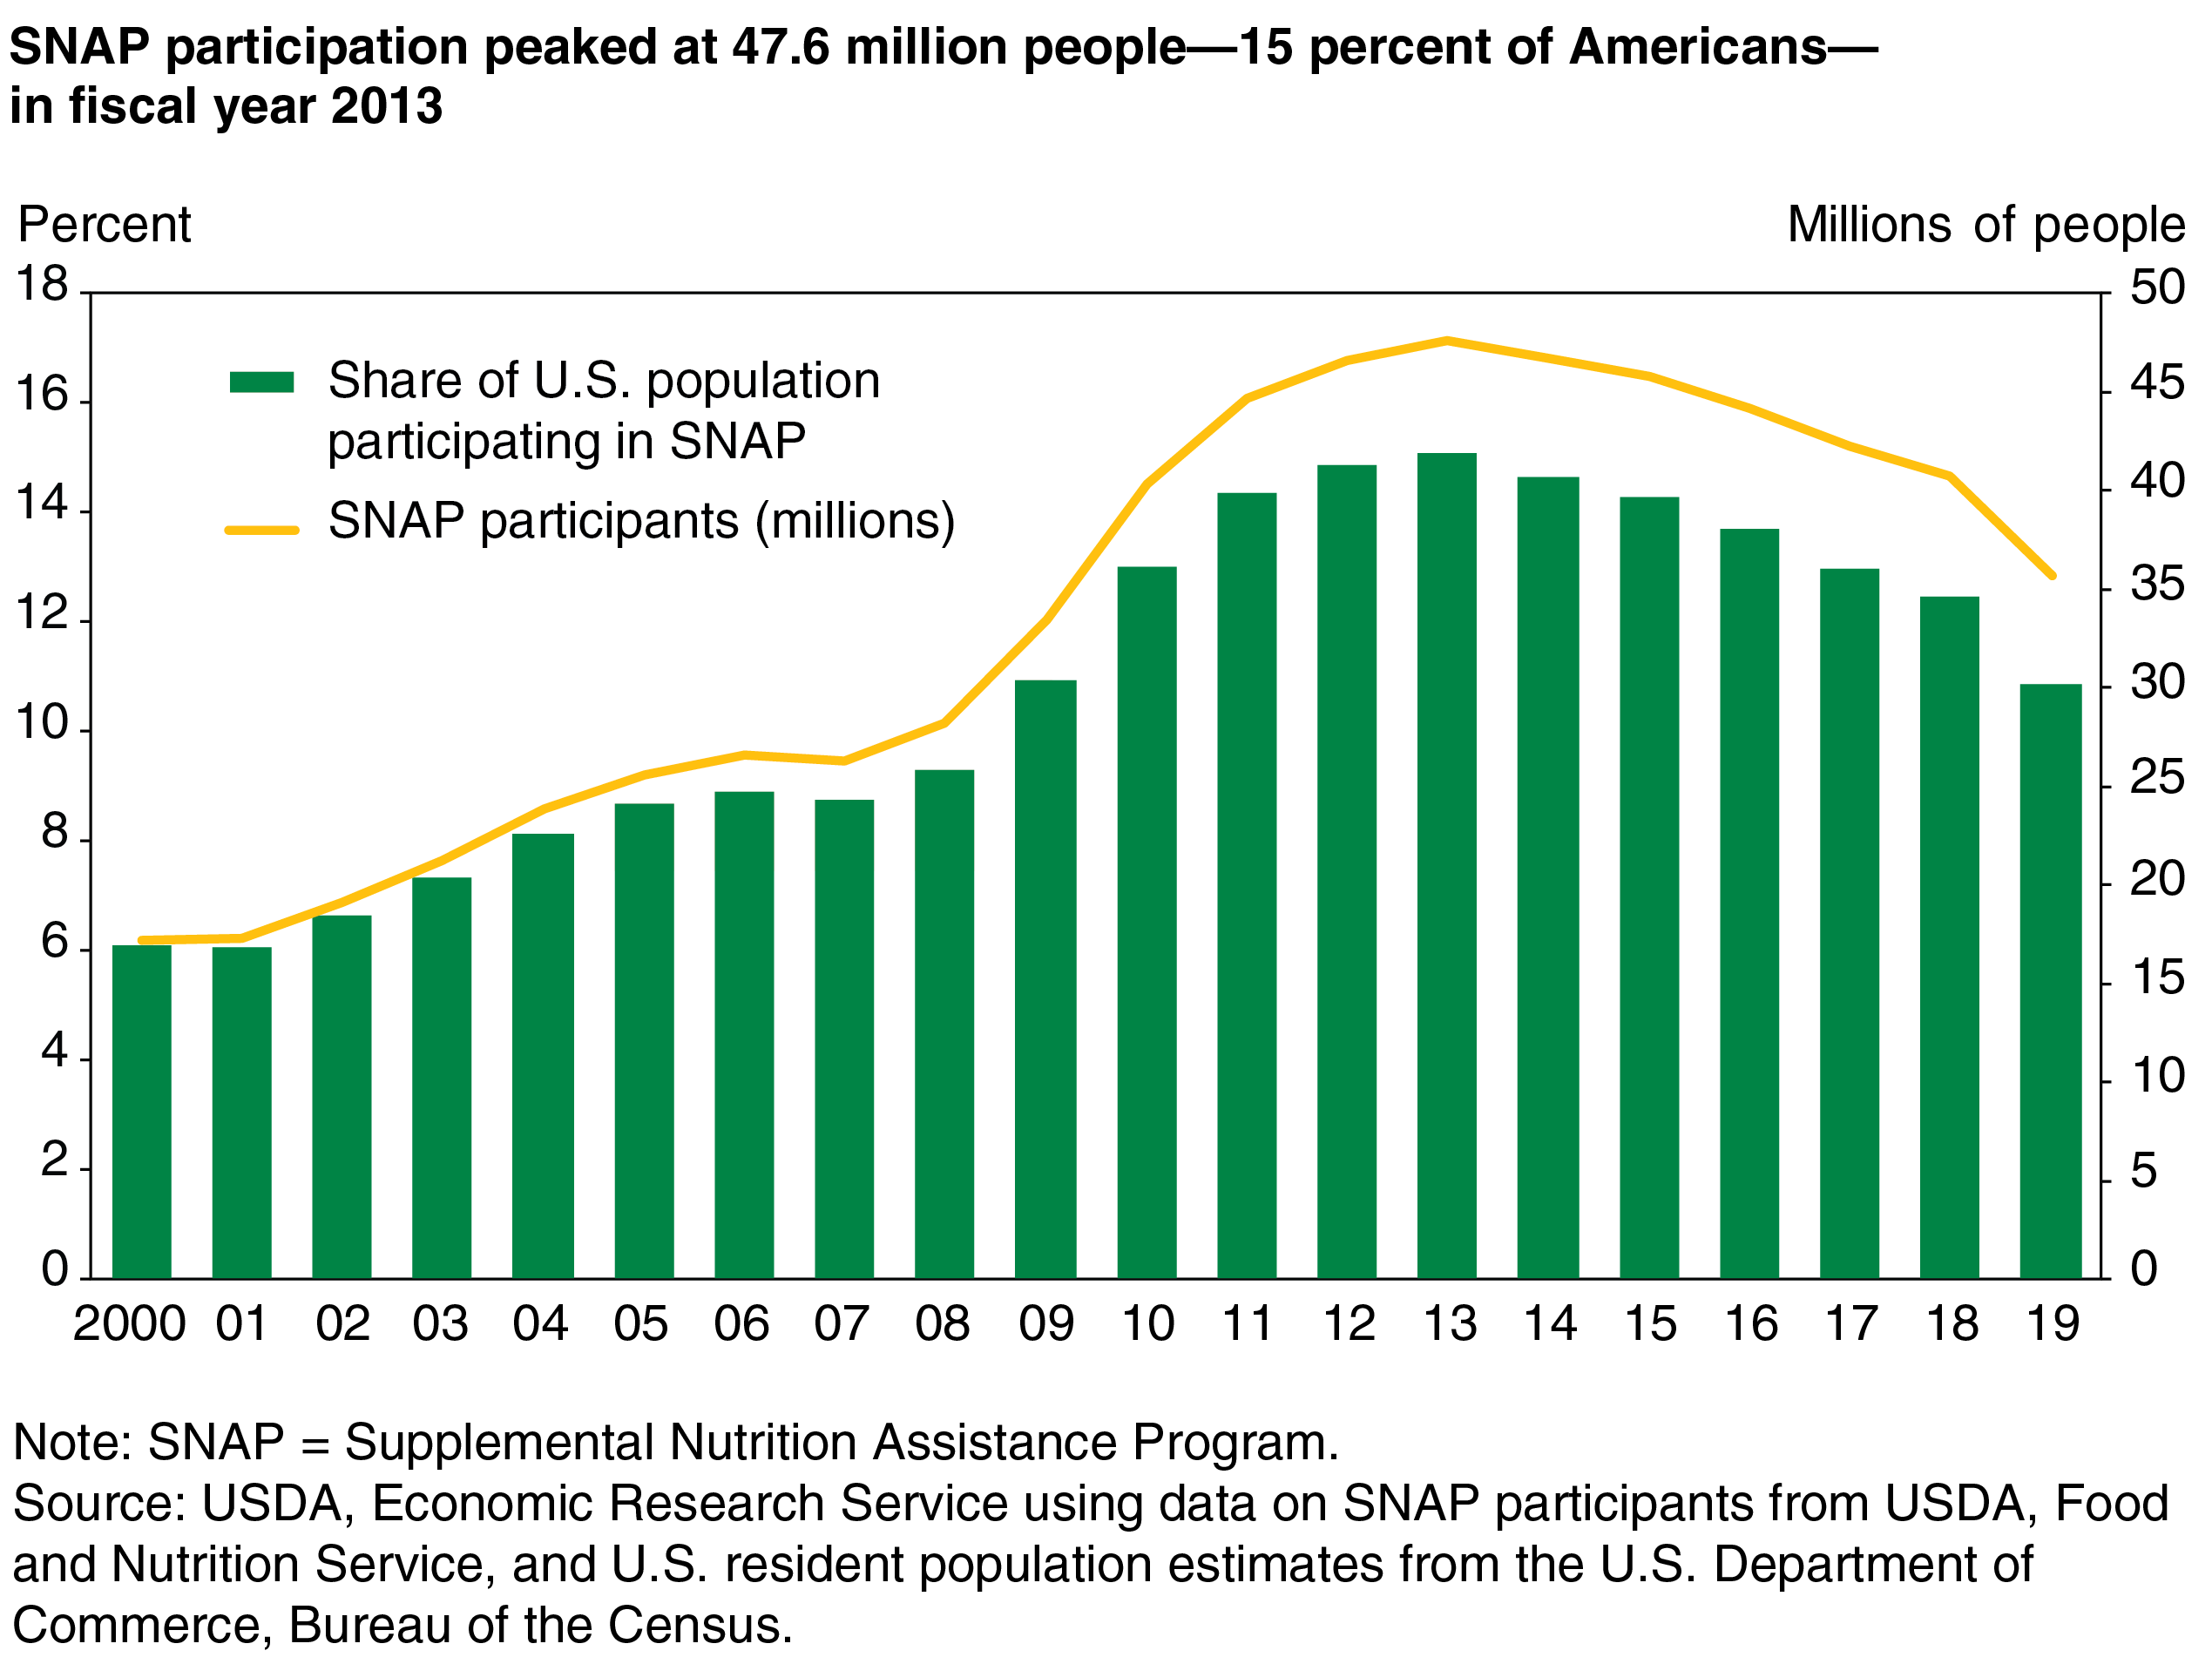
Even if economic conditions and SNAP policies remain the same, the number of SNAP participants would likely increase over time because of population growth. Focusing on the share of the Nation’s population that participates in SNAP—the ratio of the number of SNAP participants to the number of U.S. residents—accounts for the role of population change on the SNAP caseload. The number of SNAP participants grew by 108 percent between fiscal year 2000 and 2019. That is, from 17.2 million to 35.7 million—reflecting in part the 16-percent increase in the U.S. population over the same time period.
From fiscal year 2000 to 2007, between 6 and 9 percent of Americans participated in SNAP. As economic conditions deteriorated during and immediately after the Great Recession (December 2007 to June 2009), the share of Americans participating in SNAP rose, peaking in fiscal year 2013 when 15 percent of the U.S. population participated in the program each month. Between fiscal year 2013 and 2019, SNAP’s share of the population steadily fell each year as economic conditions improved. In fiscal year 2019, 10.9 percent of the population participated in the program, the lowest level since 2009, though still above pre-recession levels.
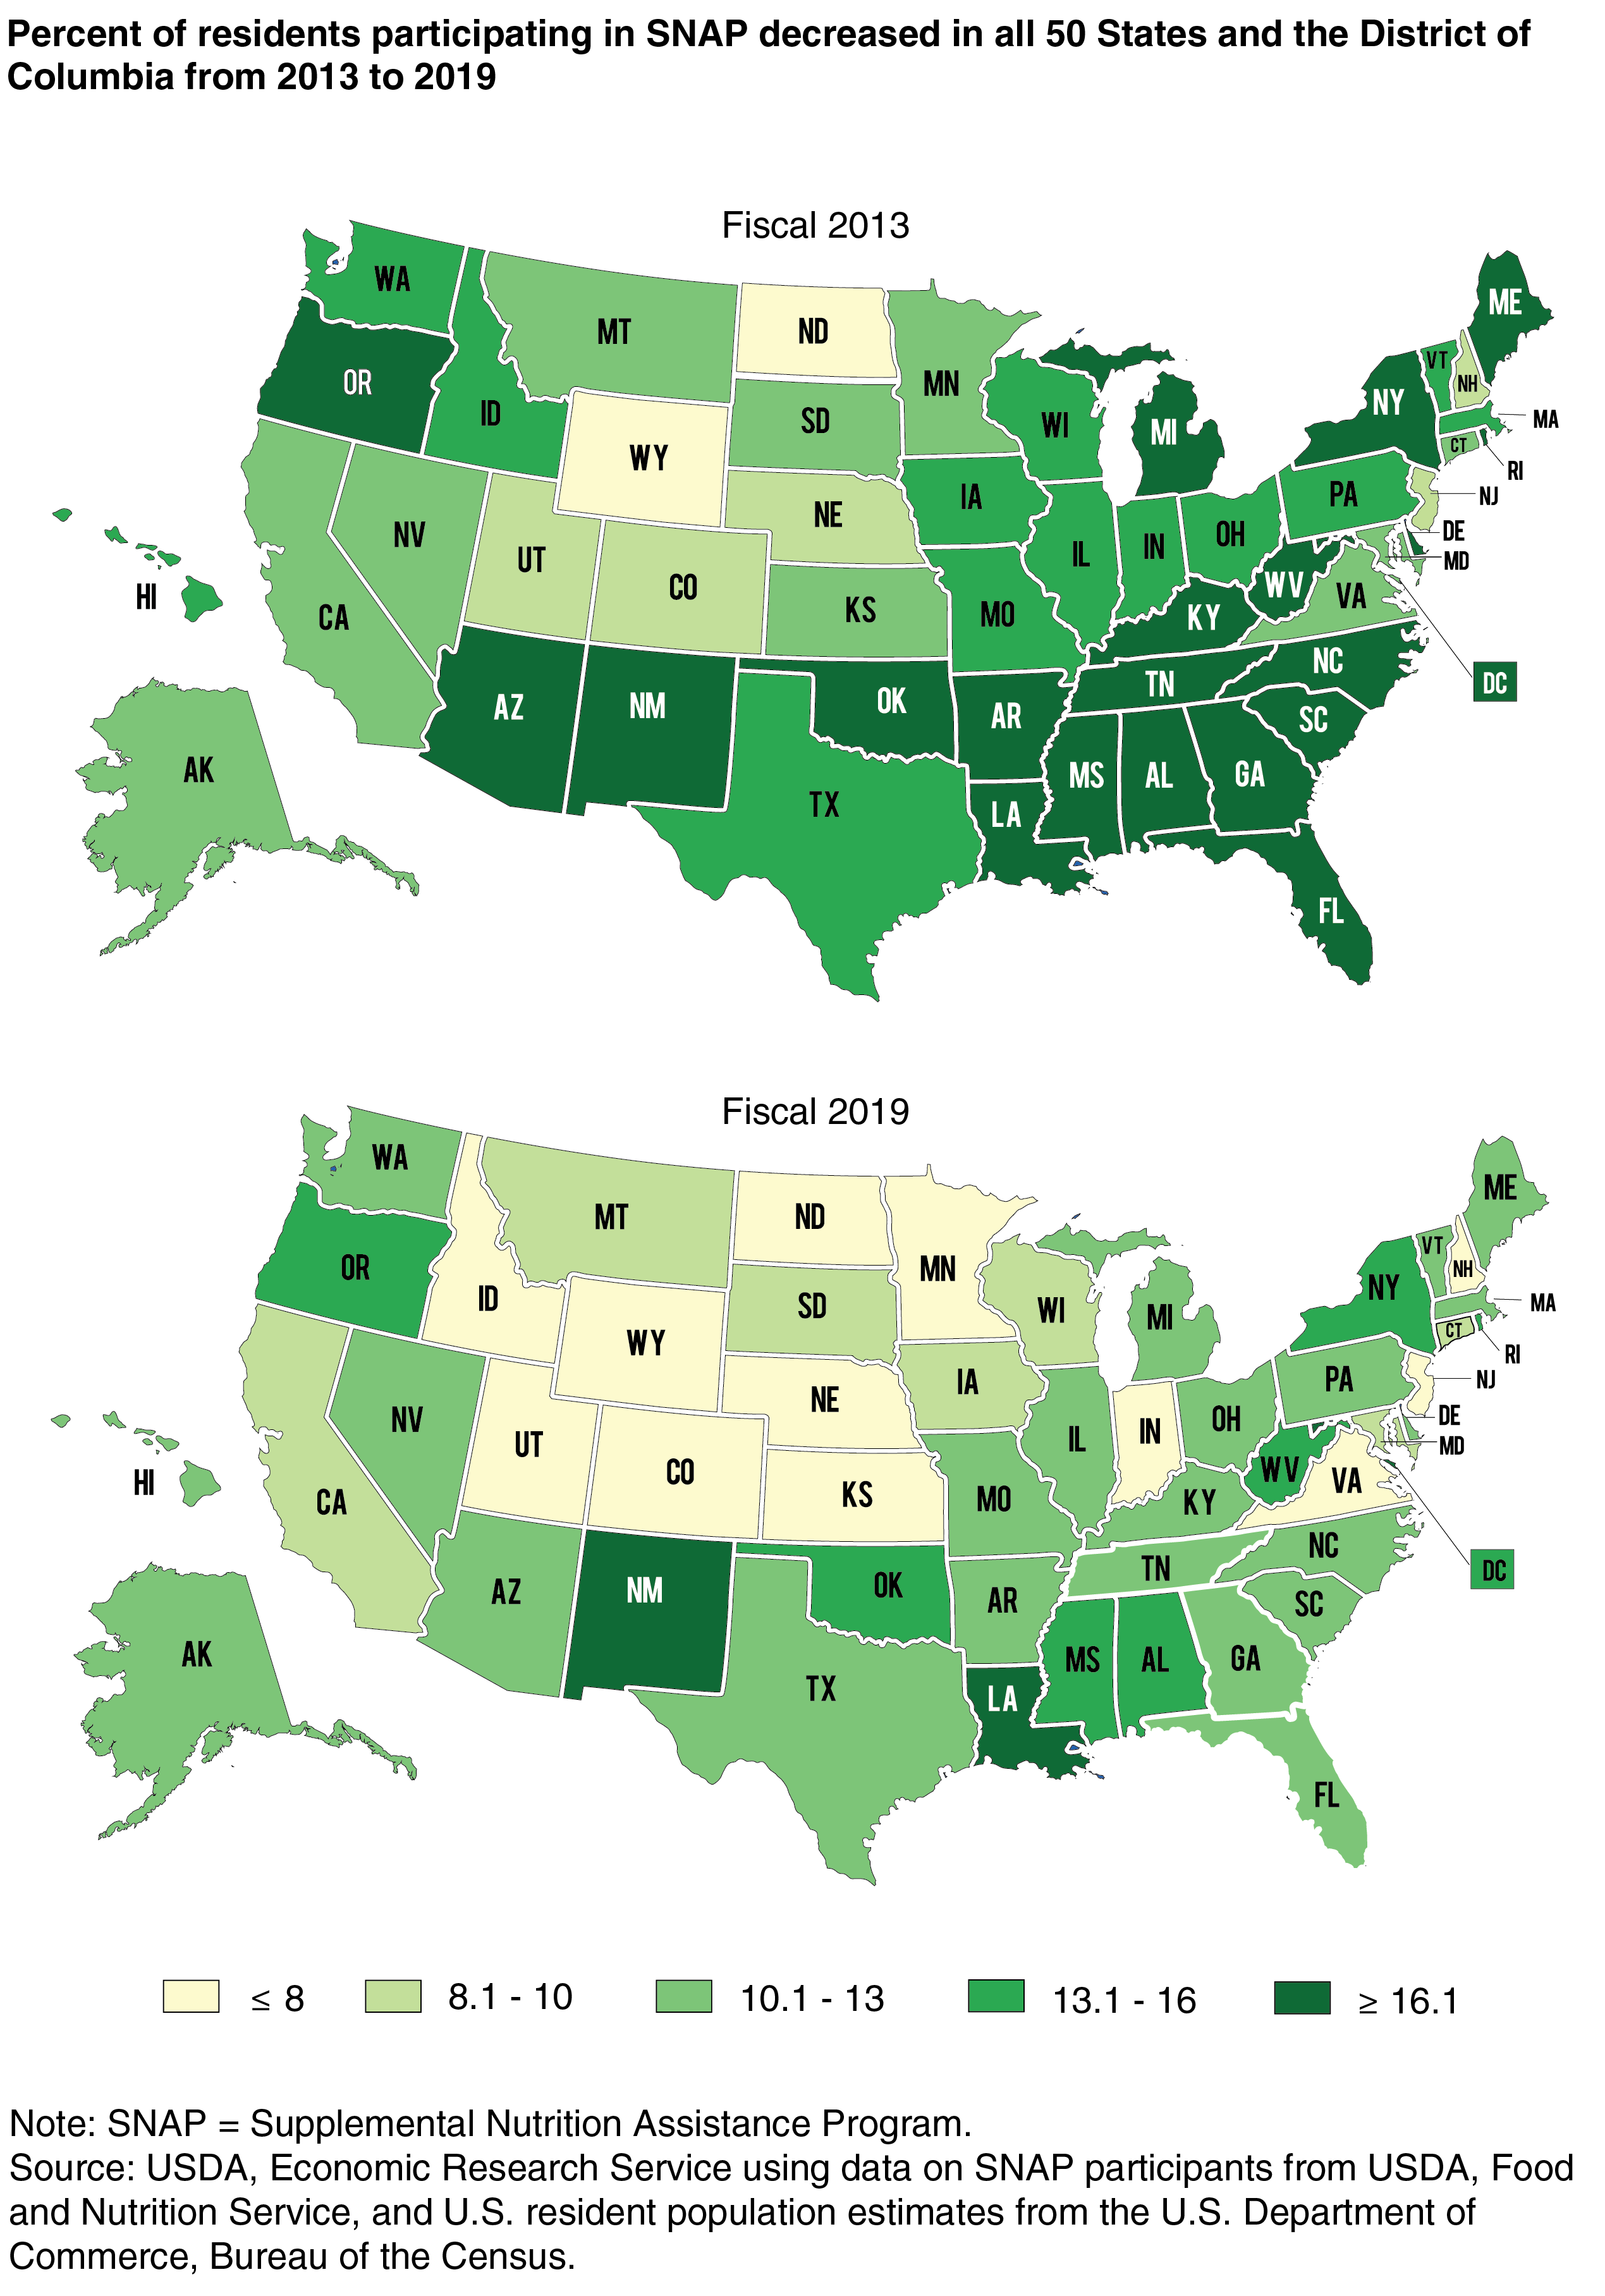
FNS works with State partners to administer SNAP. States face different economic conditions and are allowed by Federal law and FNS regulations to exercise unique policy options that can affect participation as well. The percent of State residents receiving SNAP benefits in fiscal year 2019 ranged from 19.8 percent in New Mexico to 4.2 percent in Wyoming, reflecting in part the higher rates of unemployment and poverty in New Mexico relative to Wyoming. Between 2013 and 2019, all 50 States and the District of Columbia saw a decrease in the share of residents receiving SNAP benefits as economic conditions improved in the United States and job opportunities expanded.
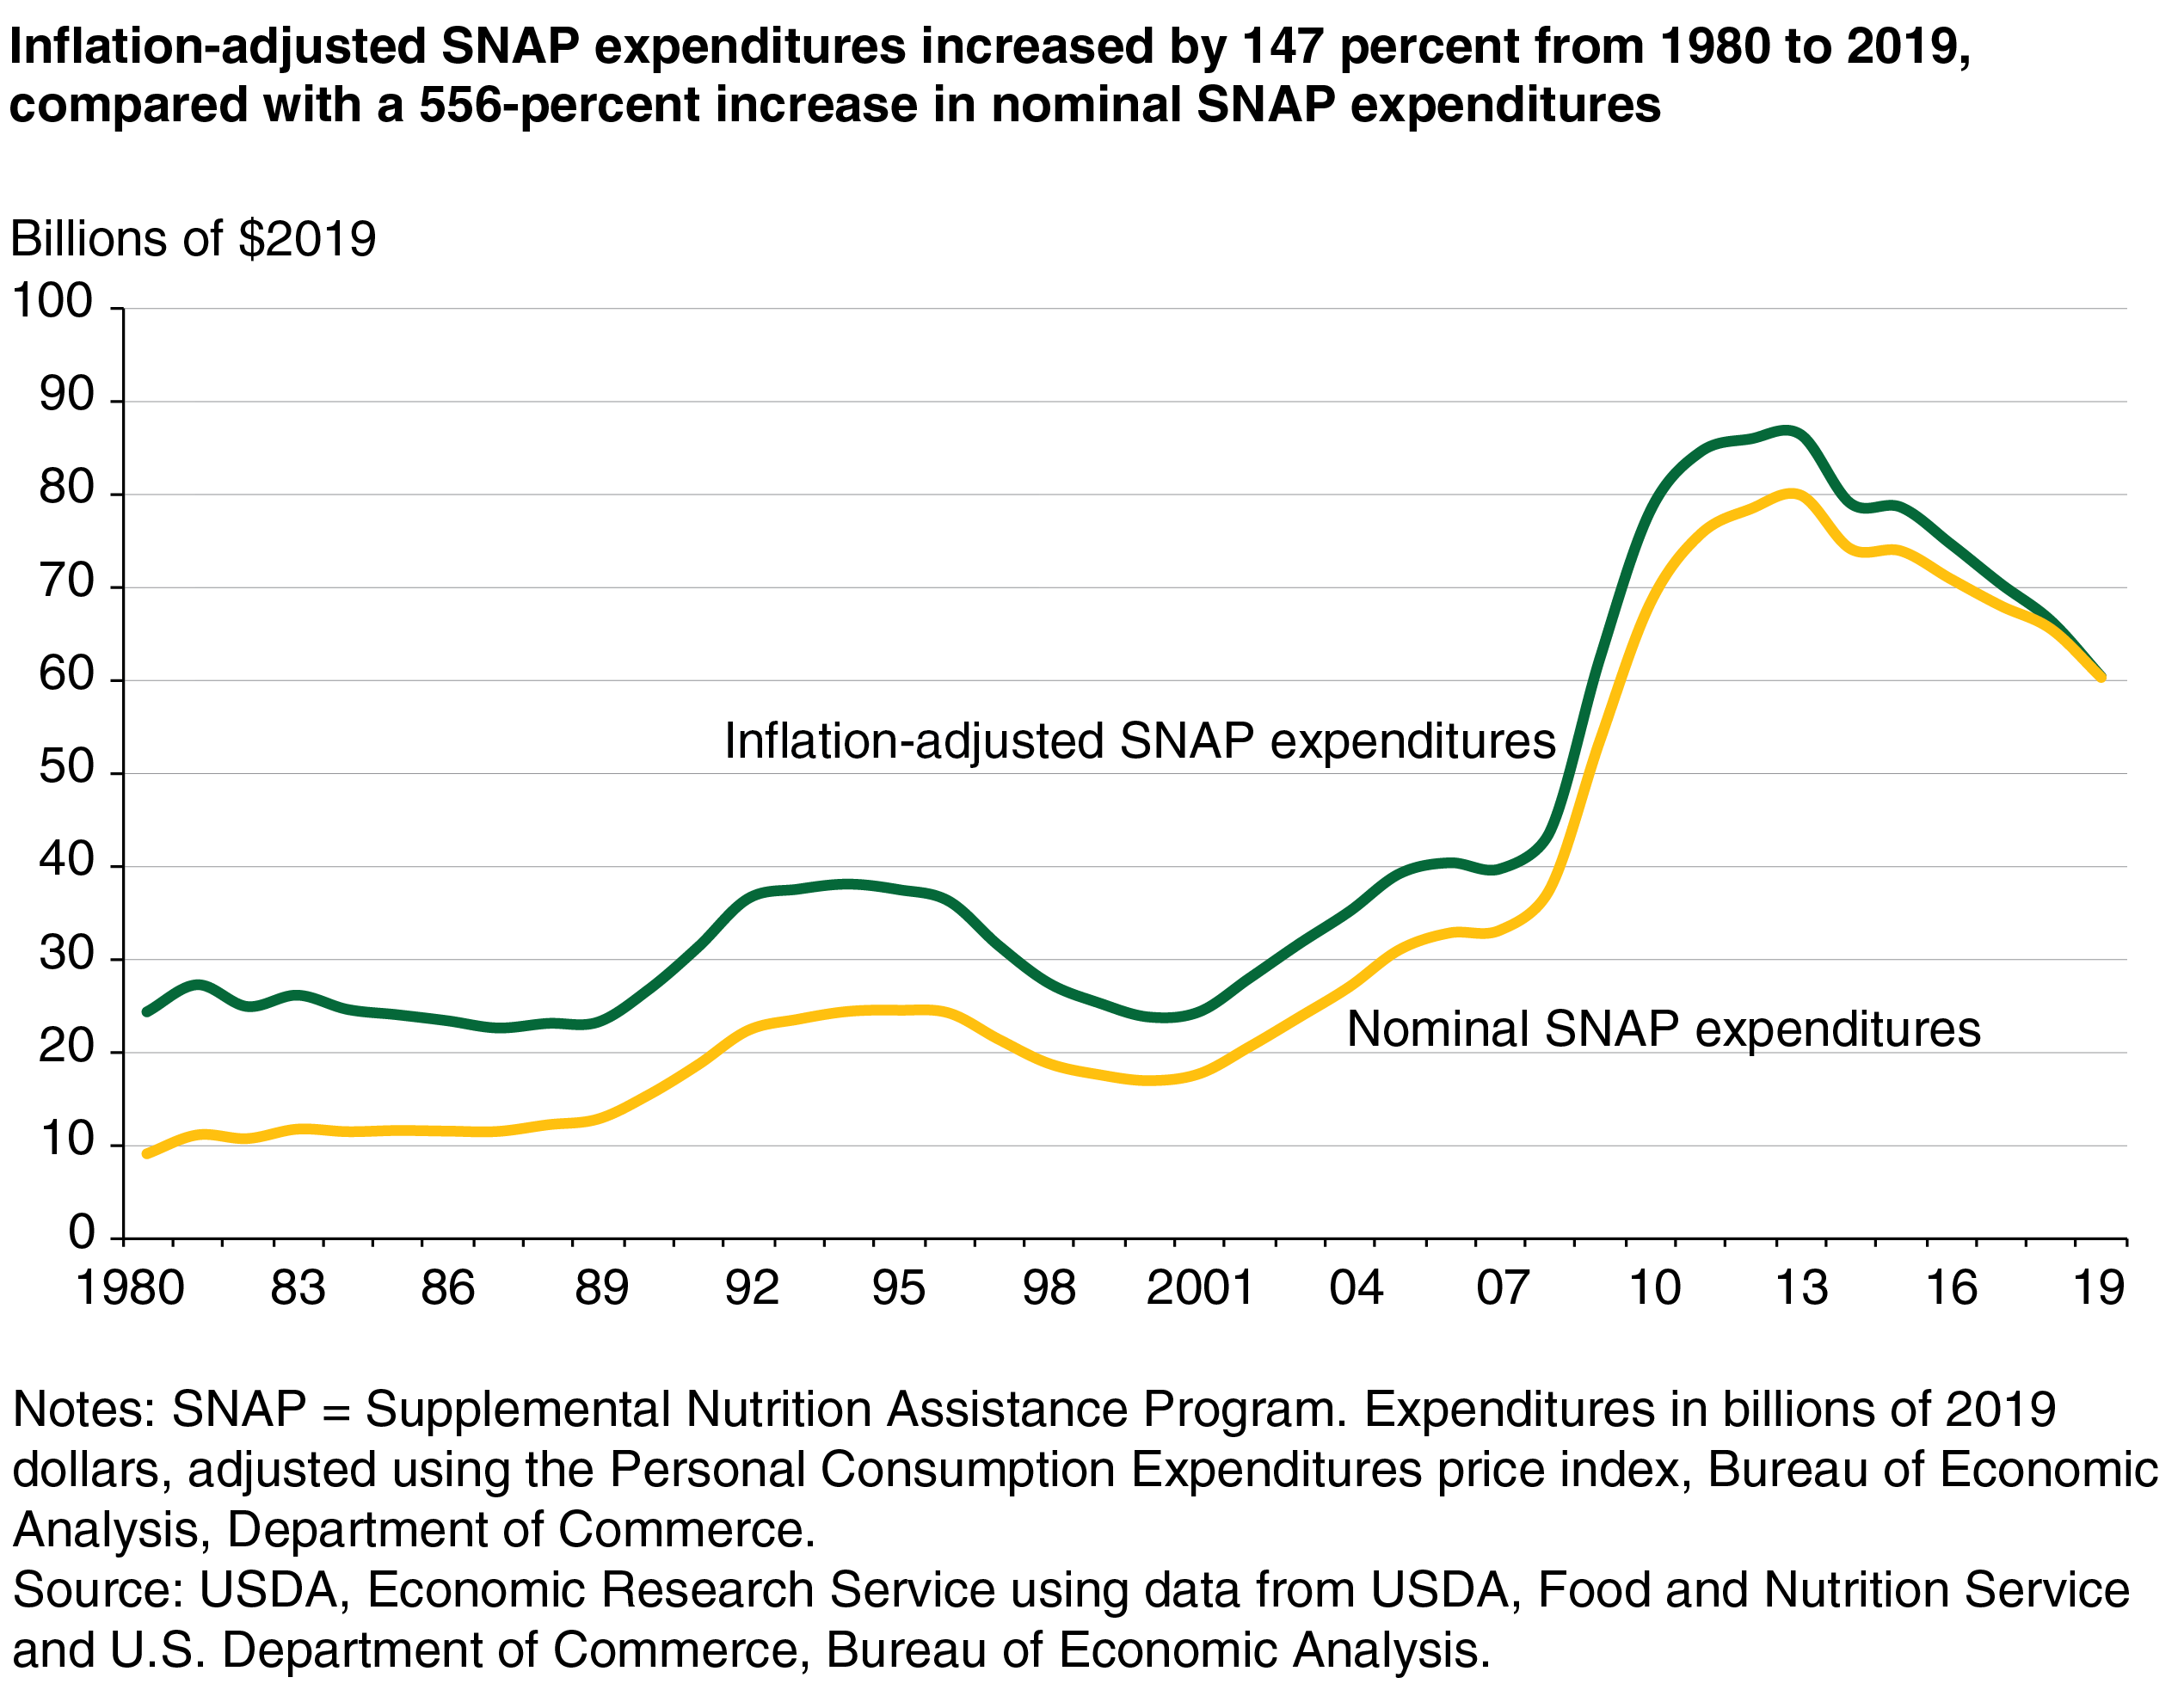
When comparing program expenditures over long periods of time, it is customary to remove the effect of general price inflation. Since inflation in the United States has generally been positive over time, ignoring its effect on program expenditures will overstate program growth and understate program contraction. For example, nominal spending on SNAP in fiscal year 2013 was $79.9 billion, which is equivalent to $86.3 billion in 2019 dollars. Thus, the inflation-adjusted decline in program spending from fiscal year 2013 to 2019 is 30 percent, compared with a decline of 25 percent if inflation is not taken into account. Inflation has a larger effect when program expenditures are compared over a longer period. From 1980 to 2019, there was a 147-percent increase in inflation-adjusted SNAP expenditures, in contrast to a 556-percent increase if inflation is not taken into account. Even taking population growth and inflation into account, economic conditions and changes to SNAP program rules remain the major drivers of SNAP caseloads and the accompanying expenditures for the program.
This article is drawn from:
- Tiehen, L. (2020). The Food Assistance Landscape: Fiscal Year 2019 Annual Report. U.S. Department of Agriculture, Economic Research Service. EIB-218.