

SNAP Redemptions Contributed to Employment During the Great Recession
- by John Pender and Young Jo
- 5/28/2019
Highlights
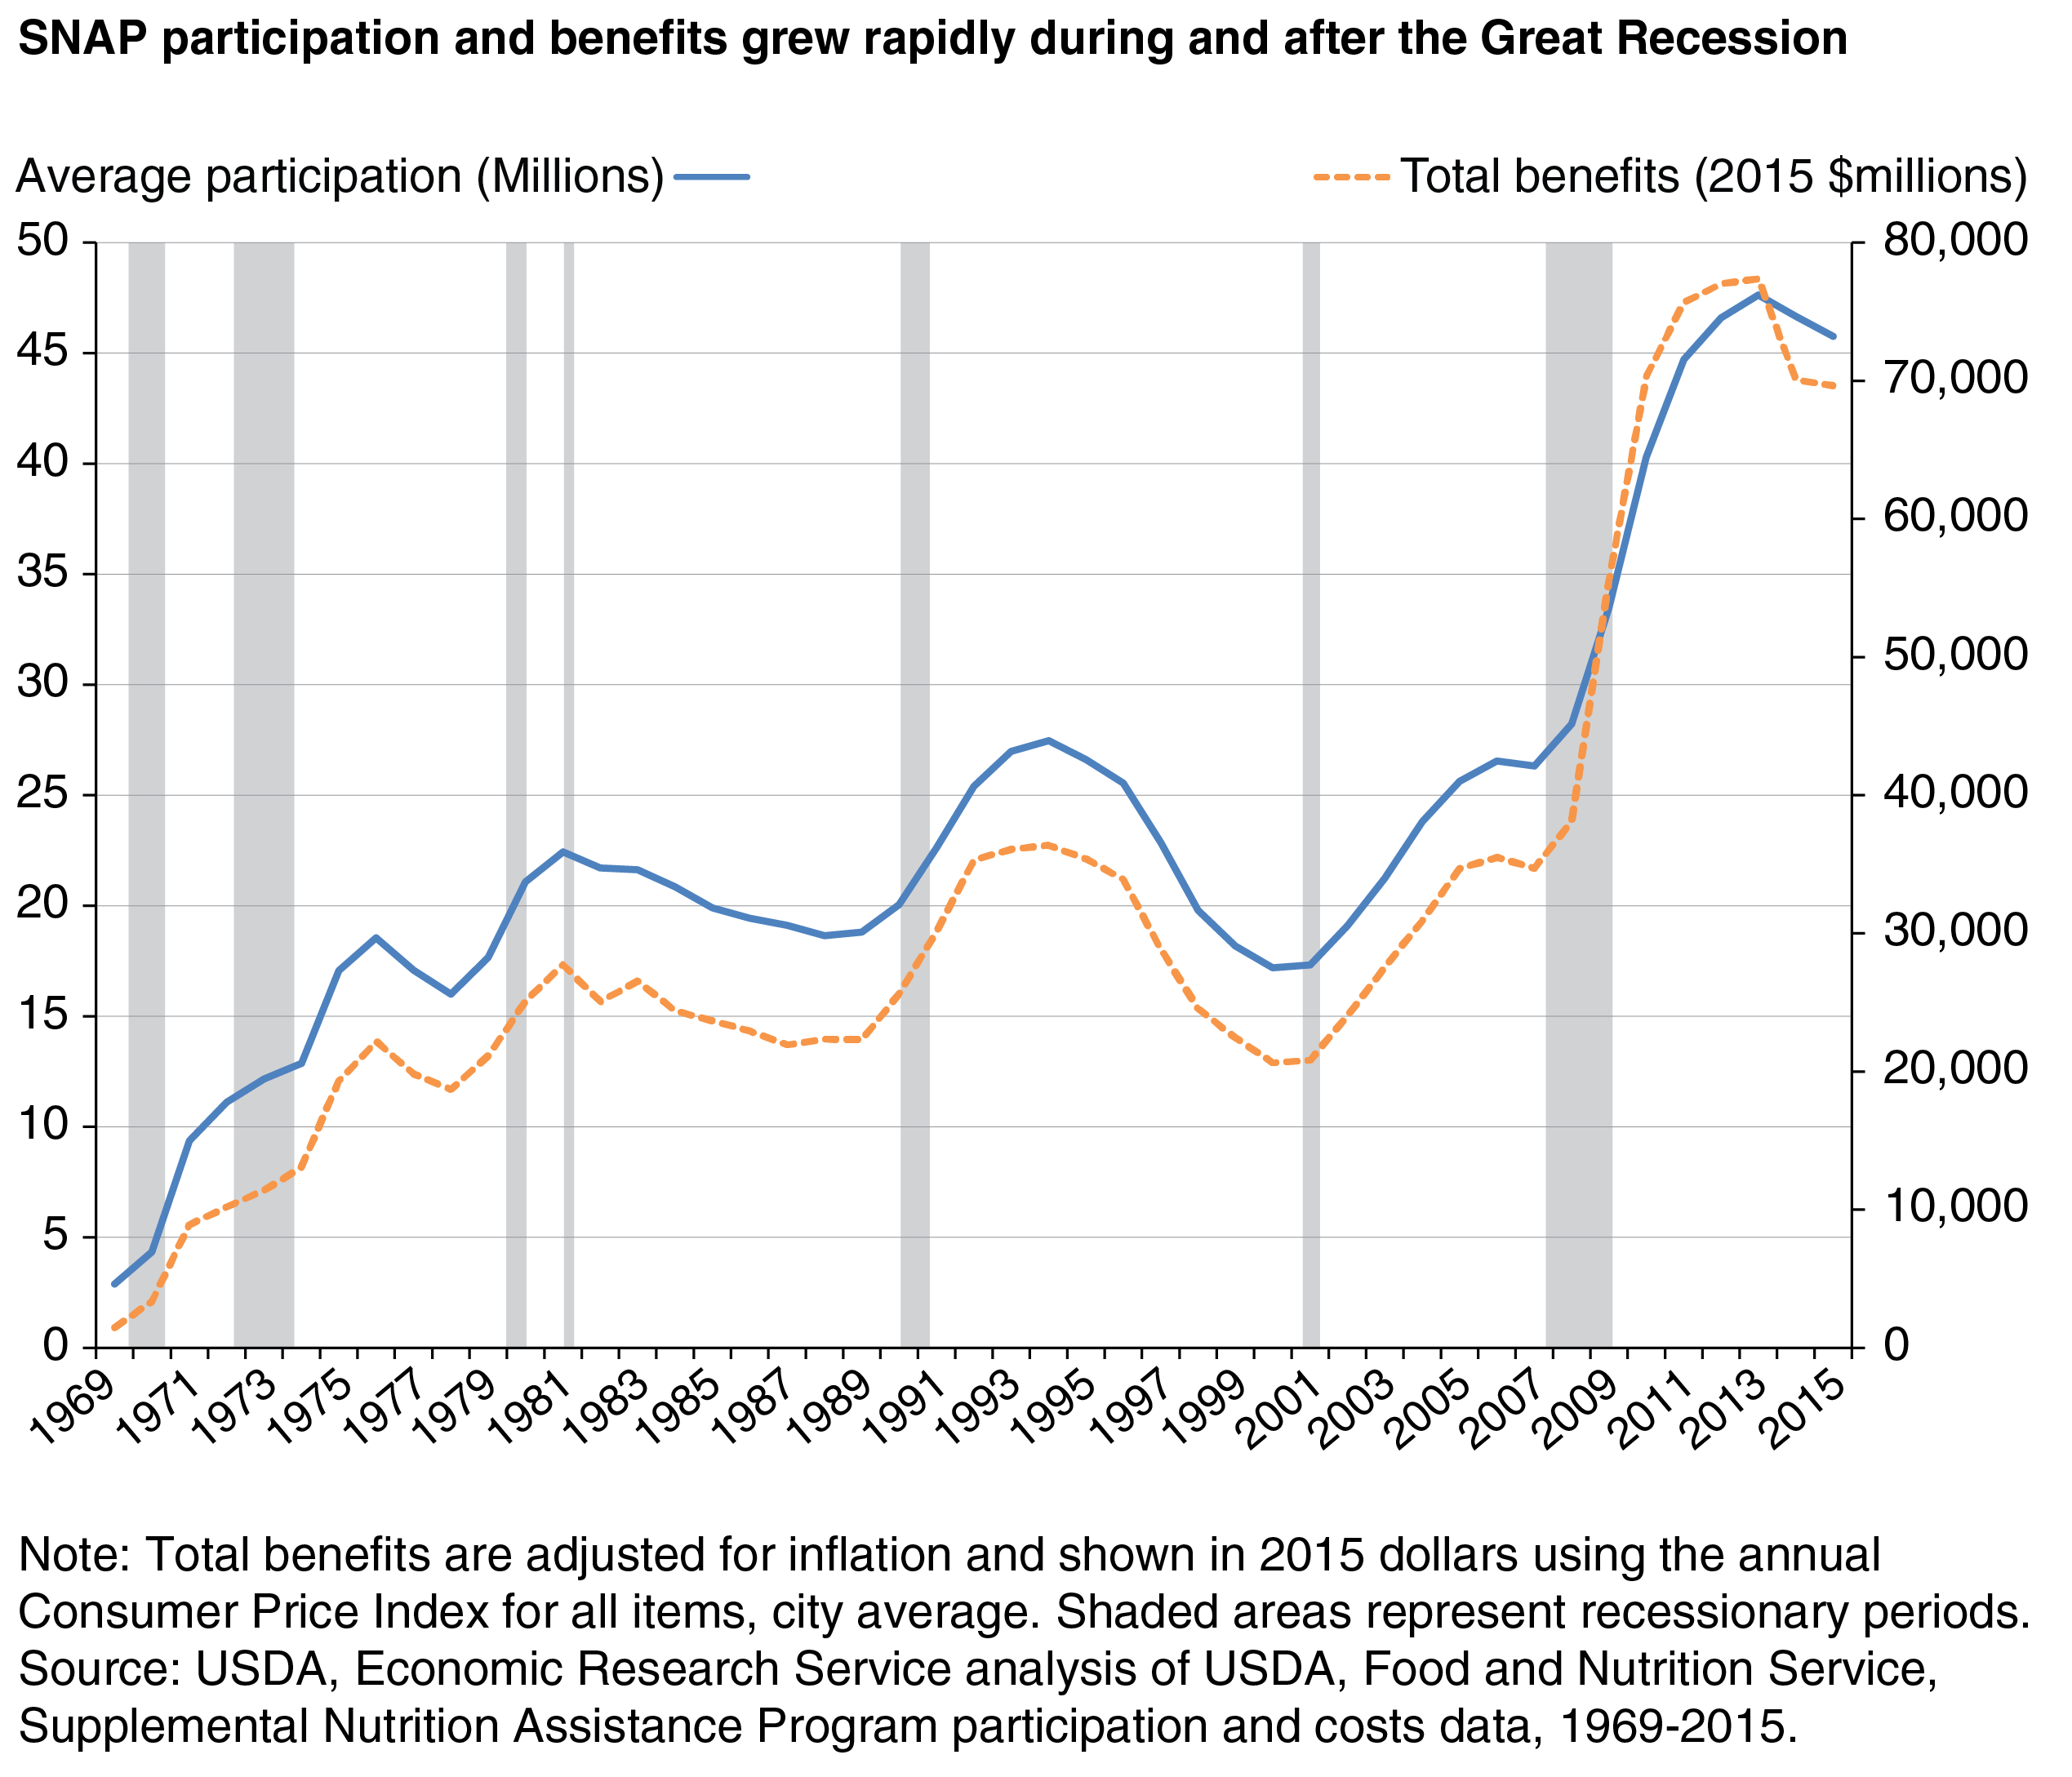
- Payments under USDA’s Supplemental Nutrition Assistance Program (SNAP) nearly quadrupled between 2001 and 2013, after adjusting for inflation, growing rapidly during and immediately after the Great Recession of 2008 and 2009.
- Between 2008 and 2010, SNAP redemptions (the value of SNAP benefits redeemed by SNAP-authorized stores) were associated with increased employment in both urban and rural counties—with $10,000 of SNAP redemptions contributing to 0.4 additional urban job and 1.0 additional rural job.
- The employment effect of SNAP redemptions per dollar spent during the recession was greater than before or after the recession; it was also greater than the employment effect of other government transfer payments combined and the employment effect of total Federal Government spending (per dollar spent).
USDA’s Supplemental Nutrition Assistance Program (SNAP), previously called the Food Stamp Program, is the largest U.S. Department of Agriculture (USDA) program. During fiscal year 2014, the last year covered by this study, it provided benefits to an average of more than 46 million recipients per month and accounted for 52 percent of USDA’s spending. In 2014, SNAP recipients redeemed more than $69 billion worth of benefits at SNAP-authorized stores, 83 percent of which were located in urban (metro) areas and 17 percent in rural (nonmetro) areas. Between fiscal years 2000 and 2013, average monthly SNAP participation nearly tripled, while the inflation-adjusted value of benefits paid under the program nearly quadrupled.
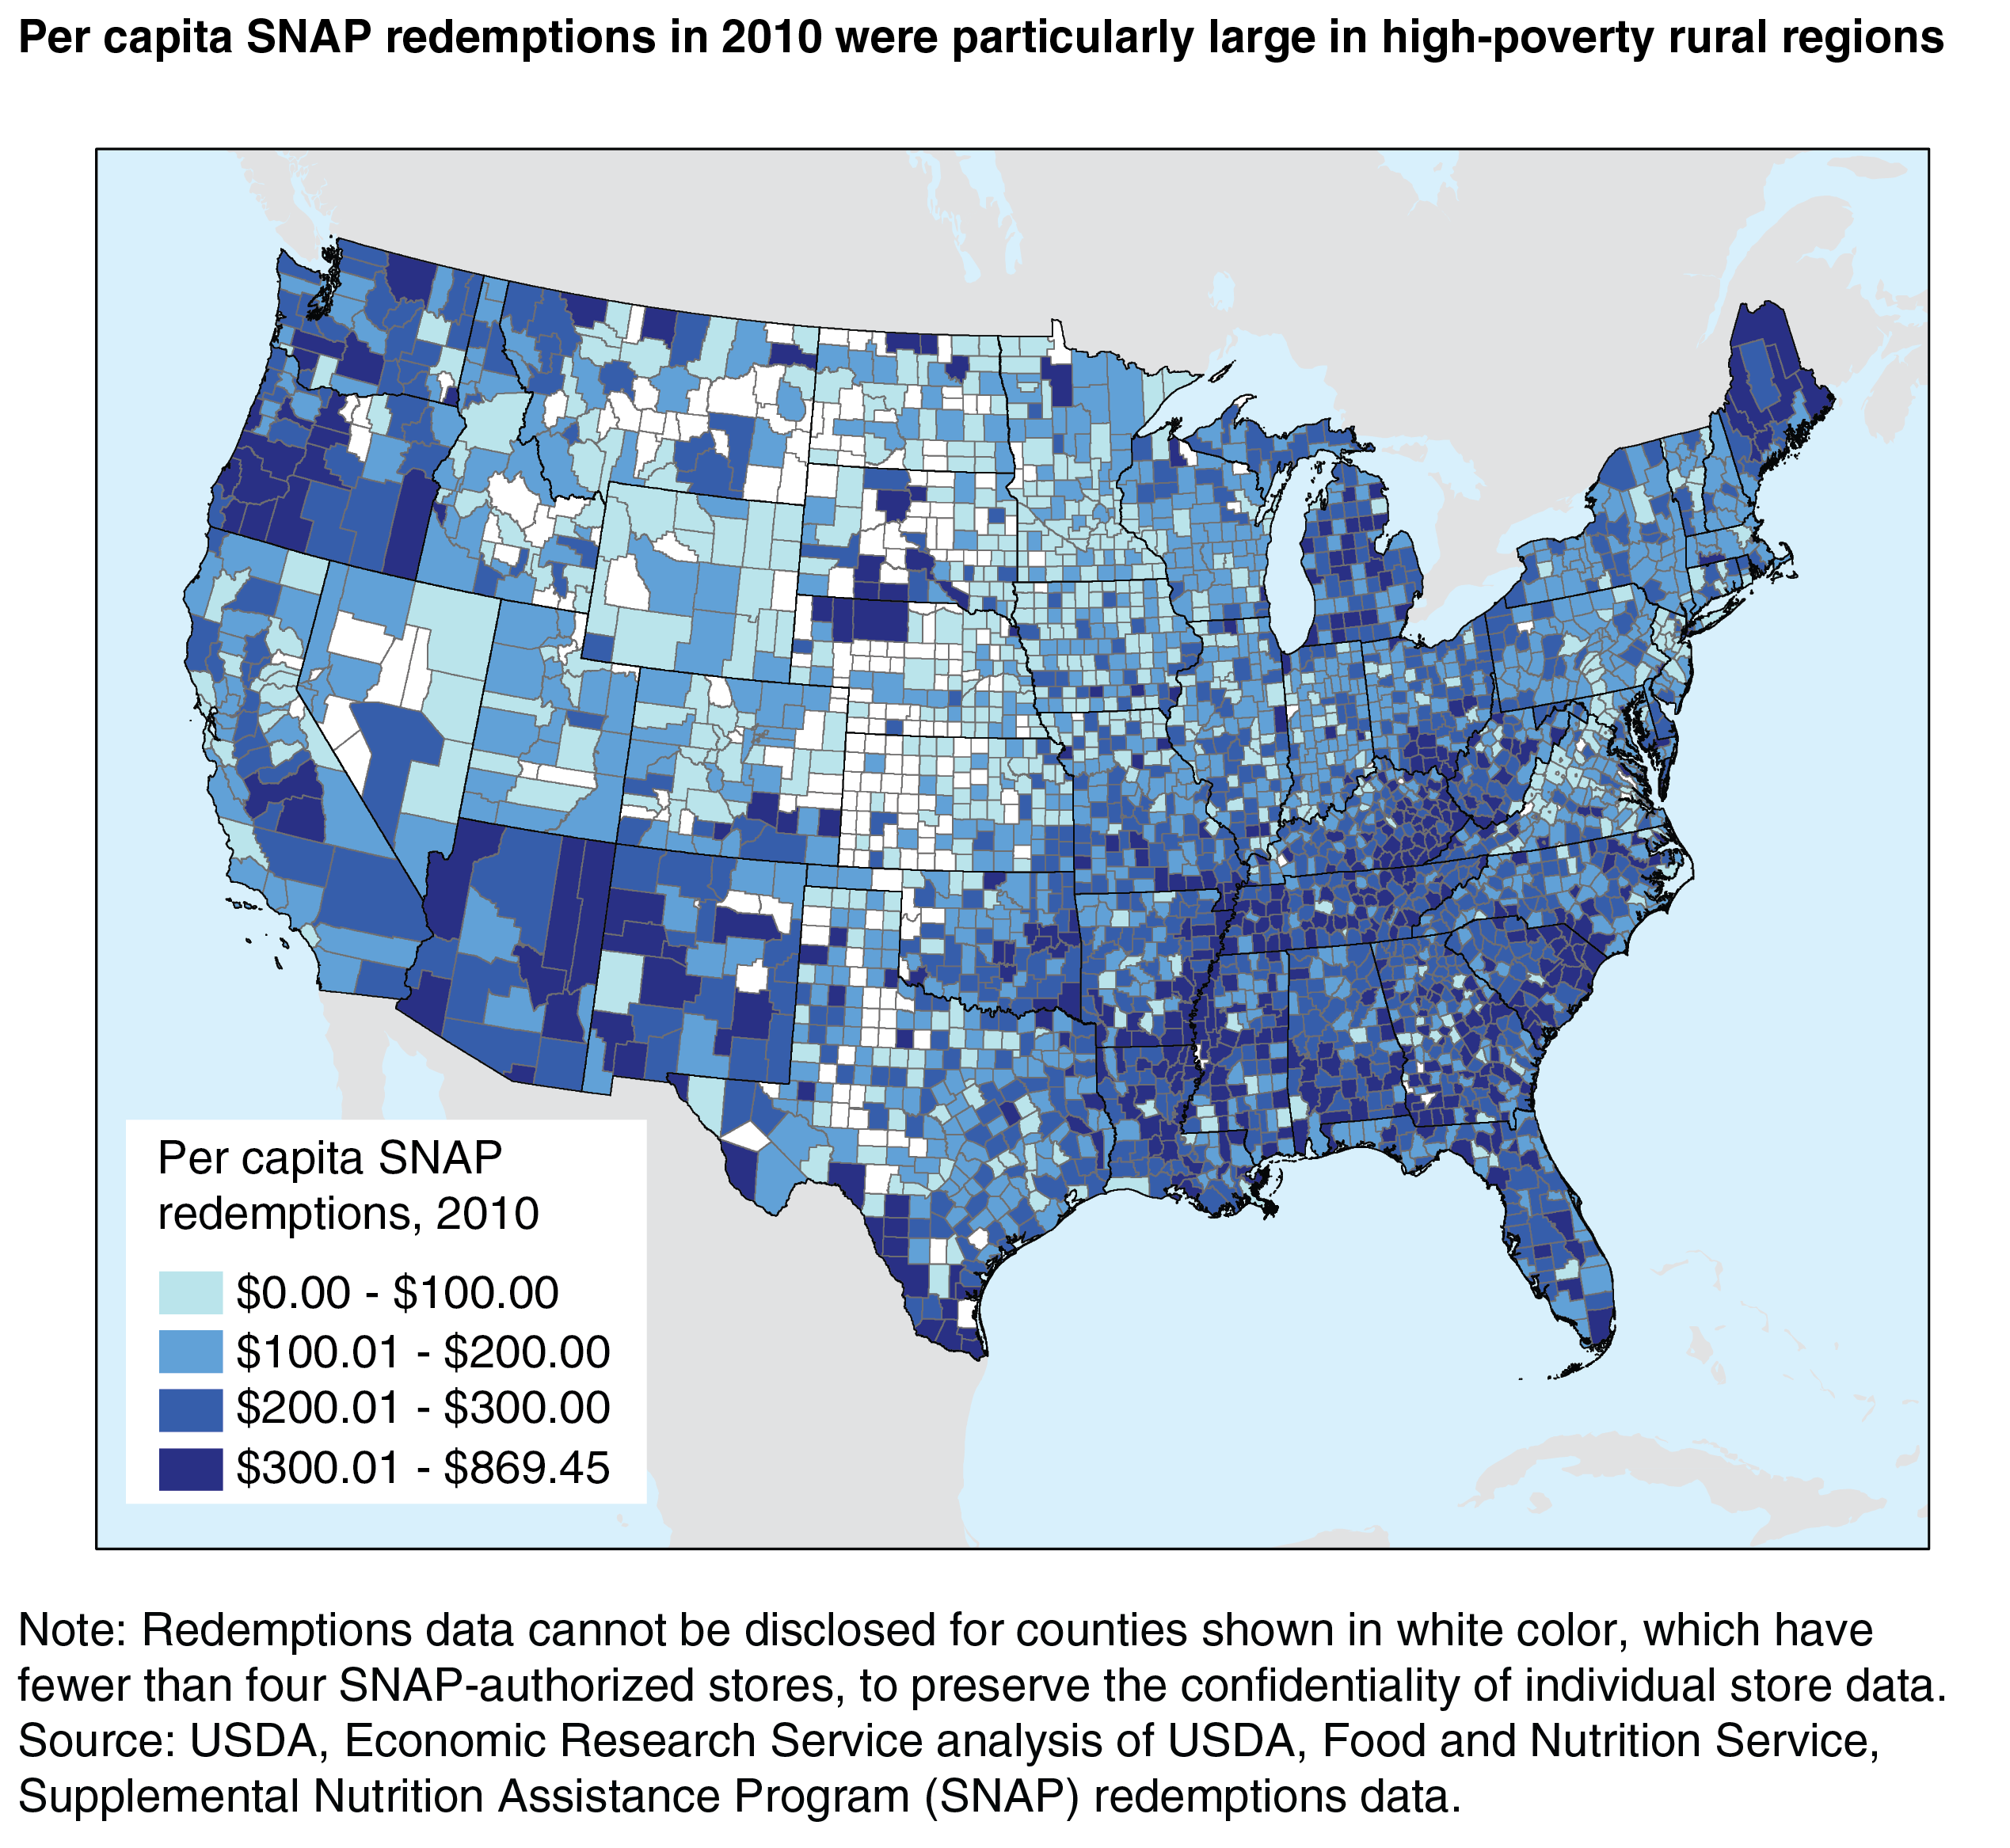
The growth in program participation and the value of benefits paid was particularly rapid during and immediately after the Great Recession, which officially began in December 2007 and ended in June 2009. However, the recession resulted in high unemployment and poverty rates well after it officially ended. The increase in program spending was due to rising SNAP participation in response to rising levels of unemployment and poverty during this period and to an increase in benefit rates mandated by the American Recovery and Reinvestment Act (ARRA) in early 2009. SNAP redemptions were particularly large in high-poverty rural areas in Appalachia, the Mississippi Delta, the Southeast, and parts of the Southwest and Northwest.
Although the increase in SNAP benefit payments mandated by the ARRA was predicted by some analysts to have large impacts on economic growth and employment, no published research has investigated these effects after the fact using statistical methods. To investigate these effects, ERS researchers analyzed the statistical associations between changes in SNAP redemptions (the value of SNAP benefits redeemed by SNAP-authorized stores) and changes in employment using county-level data, after statistically accounting for other factors that potentially affect employment changes. The analysis investigated these relationships during and immediately after the Great Recession (2008–10), as well as during the 7 years prior (2001–07) and the 4 years after (2011–14). These analyses were conducted separately for urban and rural counties.
The effects of SNAP payments on employment were expected to be greater during the recession than either before or after, by stimulating demand for goods and services at a time of excess capacity in the economy. It was also expected that the effects of SNAP payments may differ between urban and rural areas due to greater SNAP participation in rural areas, greater dependence of rural economies on employment in the food and agricultural sector, and other differences.
The results showed that, during and immediately after the Great Recession (2008-10), an additional $10,000 in SNAP redemptions contributed on average about 1.0 additional job in rural counties and 0.4 additional job in urban counties. By contrast, pre-recession SNAP redemptions (2001–07) had a much smaller positive effect on employment in rural counties (about 0.2 additional job per $10,000 of SNAP redemptions) and a negative effect in urban counties (about –0.2 job per $10,000 of SNAP redemptions). In the post-recession period (2011–14), SNAP redemptions had a statistically insignificant effect on employment in both rural and urban counties.
| Time period | Rural counties | Urban counties |
|---|---|---|
| Pre-Great Recession (2001–07) | 0.250** | –0.218* |
| During recession (2008–10) | 1.043** | 0.414* |
| Post-recession (2011–14) | 0.152 | 0.123 |
| Note: * and ** mean the coefficient is statistically significant at the 5-percent and 1-percent level, respectively. Statistical significance indicates the probability of obtaining the result if the true effect is zero. For example, a 1-percent statistical significance level indicates that there is only a 1-percent chance that the estimated value would be as large as it is if the true value of the coefficient is zero. Source: USDA, Economic Research Service analysis of determinants of changes in county employment using data from various sources. |
||
The findings that SNAP spending had a positive effect on employment during the recession—and small or negative effects when the economy was growing—are similar to findings from other studies that used a national economic simulation model to predict the effects of SNAP spending. However, ERS researchers found that SNAP spending had larger effects on employment during the recession than previous research had predicted.
The present study’s larger effects may have occurred because, in some counties, employment rose in response to increased SNAP spending, diverting economic activity away from other counties where SNAP spending increased less—which may have resulted in a smaller net effect at the national level than at the local level. (Previous research’s predictions of smaller effects had focused on the national level.) Furthermore, some simulation model-based studies had assumed that increased SNAP spending would be offset by increased taxes or reduced spending on other Federal programs. By comparison, the present ERS study netted out any effects from national-level budgetary policies, effectively measuring only the “windfall effect” of increased SNAP spending on local economies. Thus, these estimates do not represent the effects of increased SNAP spending on the national economy.
The effects of SNAP spending per dollar spent on local employment during the recession were larger than the effects per dollar spent of other government transfer payments combined (including Social Security, Medicare, Medicaid, unemployment insurance compensation, veterans’ benefits, and other transfer payments). They were also larger than the employment effects, per dollar spent, of all Federal Government spending combined. The average effect of other government transfer payments in all counties during the recession was less than 0.2 job per $10,000 of spending, while the effect of all other Federal spending combined was much smaller.
The relatively large effect of SNAP on employment found during the recession may be due to the fact that SNAP payments are provided directly to low-income people who have a high propensity to spend additional income and do so quickly. By contrast, many other government programs provide funding indirectly through providers of services (such as Medicare and Medicaid), do not specifically target low-income people (this describes most programs), or may need a much longer time to show results (such as highway or other infrastructure improvements).
This article is drawn from:
- Pender, J., Jo, Y., Todd, J.E. & Miller, C. (2019). The Impacts of Supplemental Nutrition Assistance Program Redemptions on County-Level Employment. U.S. Department of Agriculture, Economic Research Service. ERR-263.
You may also like:
- Hanson, K. (2010). The Food Assistance National Input-Output Multiplier (FANIOM) Model and Stimulus Effects of SNAP. U.S. Department of Agriculture, Economic Research Service. ERR-103.