

Rural Population Trends
- by John Cromartie and Dennis Vilorio
- 2/15/2019
The decline in U.S. rural population, which began in 2010, has reversed for the first time this decade. In 2016-17, the rural population increased by 0.1 percent, adding 33,000 people. This small overall increase continues an upturn in rural population since 2011-12, which stems from increasing rates of net migration from urban (metro) areas. Since 2011, fewer people have been moving out of rural areas and more people have been moving in. Rural net migration increased from -0.25 percent in 2011-12 to essentially zero in 2016-17. Despite zero net migration, rural population increased because, during the same period, the population growth rate from natural change (births minus deaths) remained positive—though it dropped from 0.12 percent to 0.08 percent.
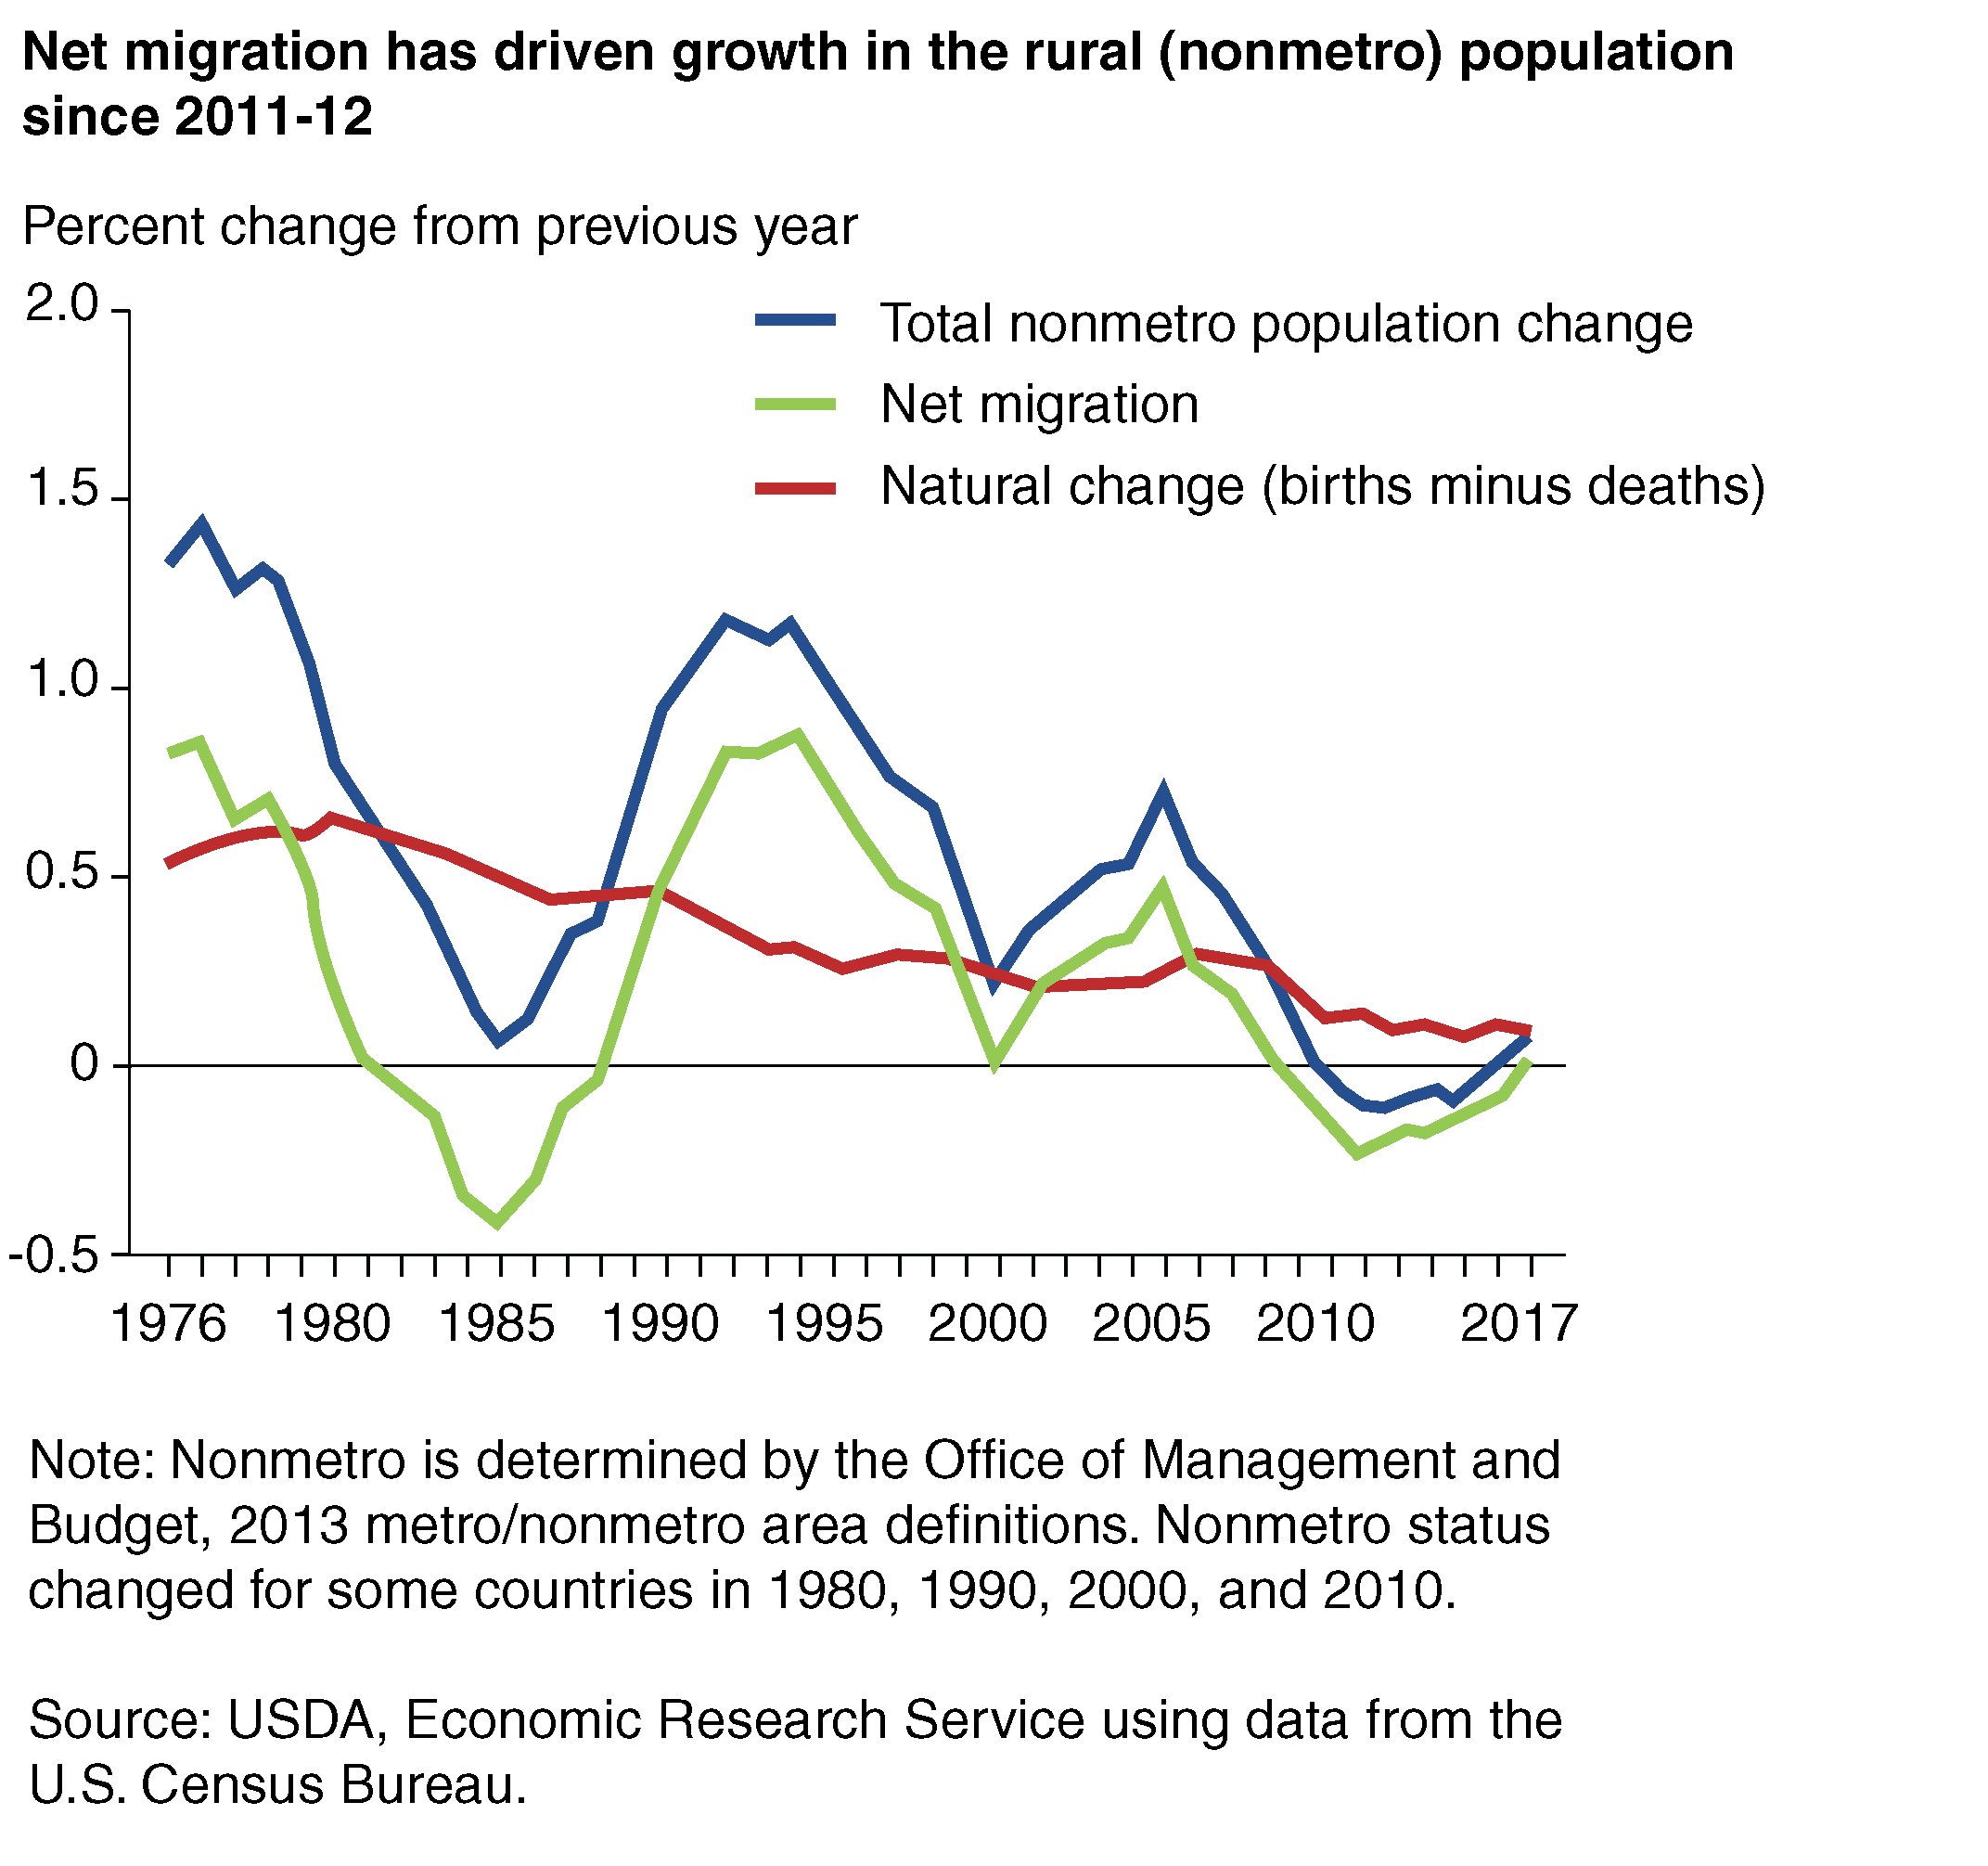
This decline in growth rate from natural change continues a long-term downward trend arising from lower fertility rates, an aging population, and, more recently, increasing mortality rates for some age groups. While natural change has gradually trended downward over time, net migration rates tend to fluctuate in response to economic conditions. With growth from natural change projected to continue falling, future population growth in rural America will depend more on increasing net migration—which has coincided with declining rural unemployment, rising incomes, and declining poverty since 2013. These improved labor market conditions have allowed rural areas to retain more residents and attract more newcomers.
Net migration drives increases in rural population, but not in all areas
The overall rural population has remained close to 46.1 million since 2013. Annual population losses averaged -0.1 percent between 2012-13 and 2015-16, and population gain during 2016-17 was 0.1 percent. However, national population trends mask great variation at the local level. People moving to rural areas tend to persistently favor more densely settled rural areas with attractive scenic qualities, or those near large cities. Fewer are moving to sparsely settled, less scenic, and more remote locations, which compounds economic development challenges in those areas.
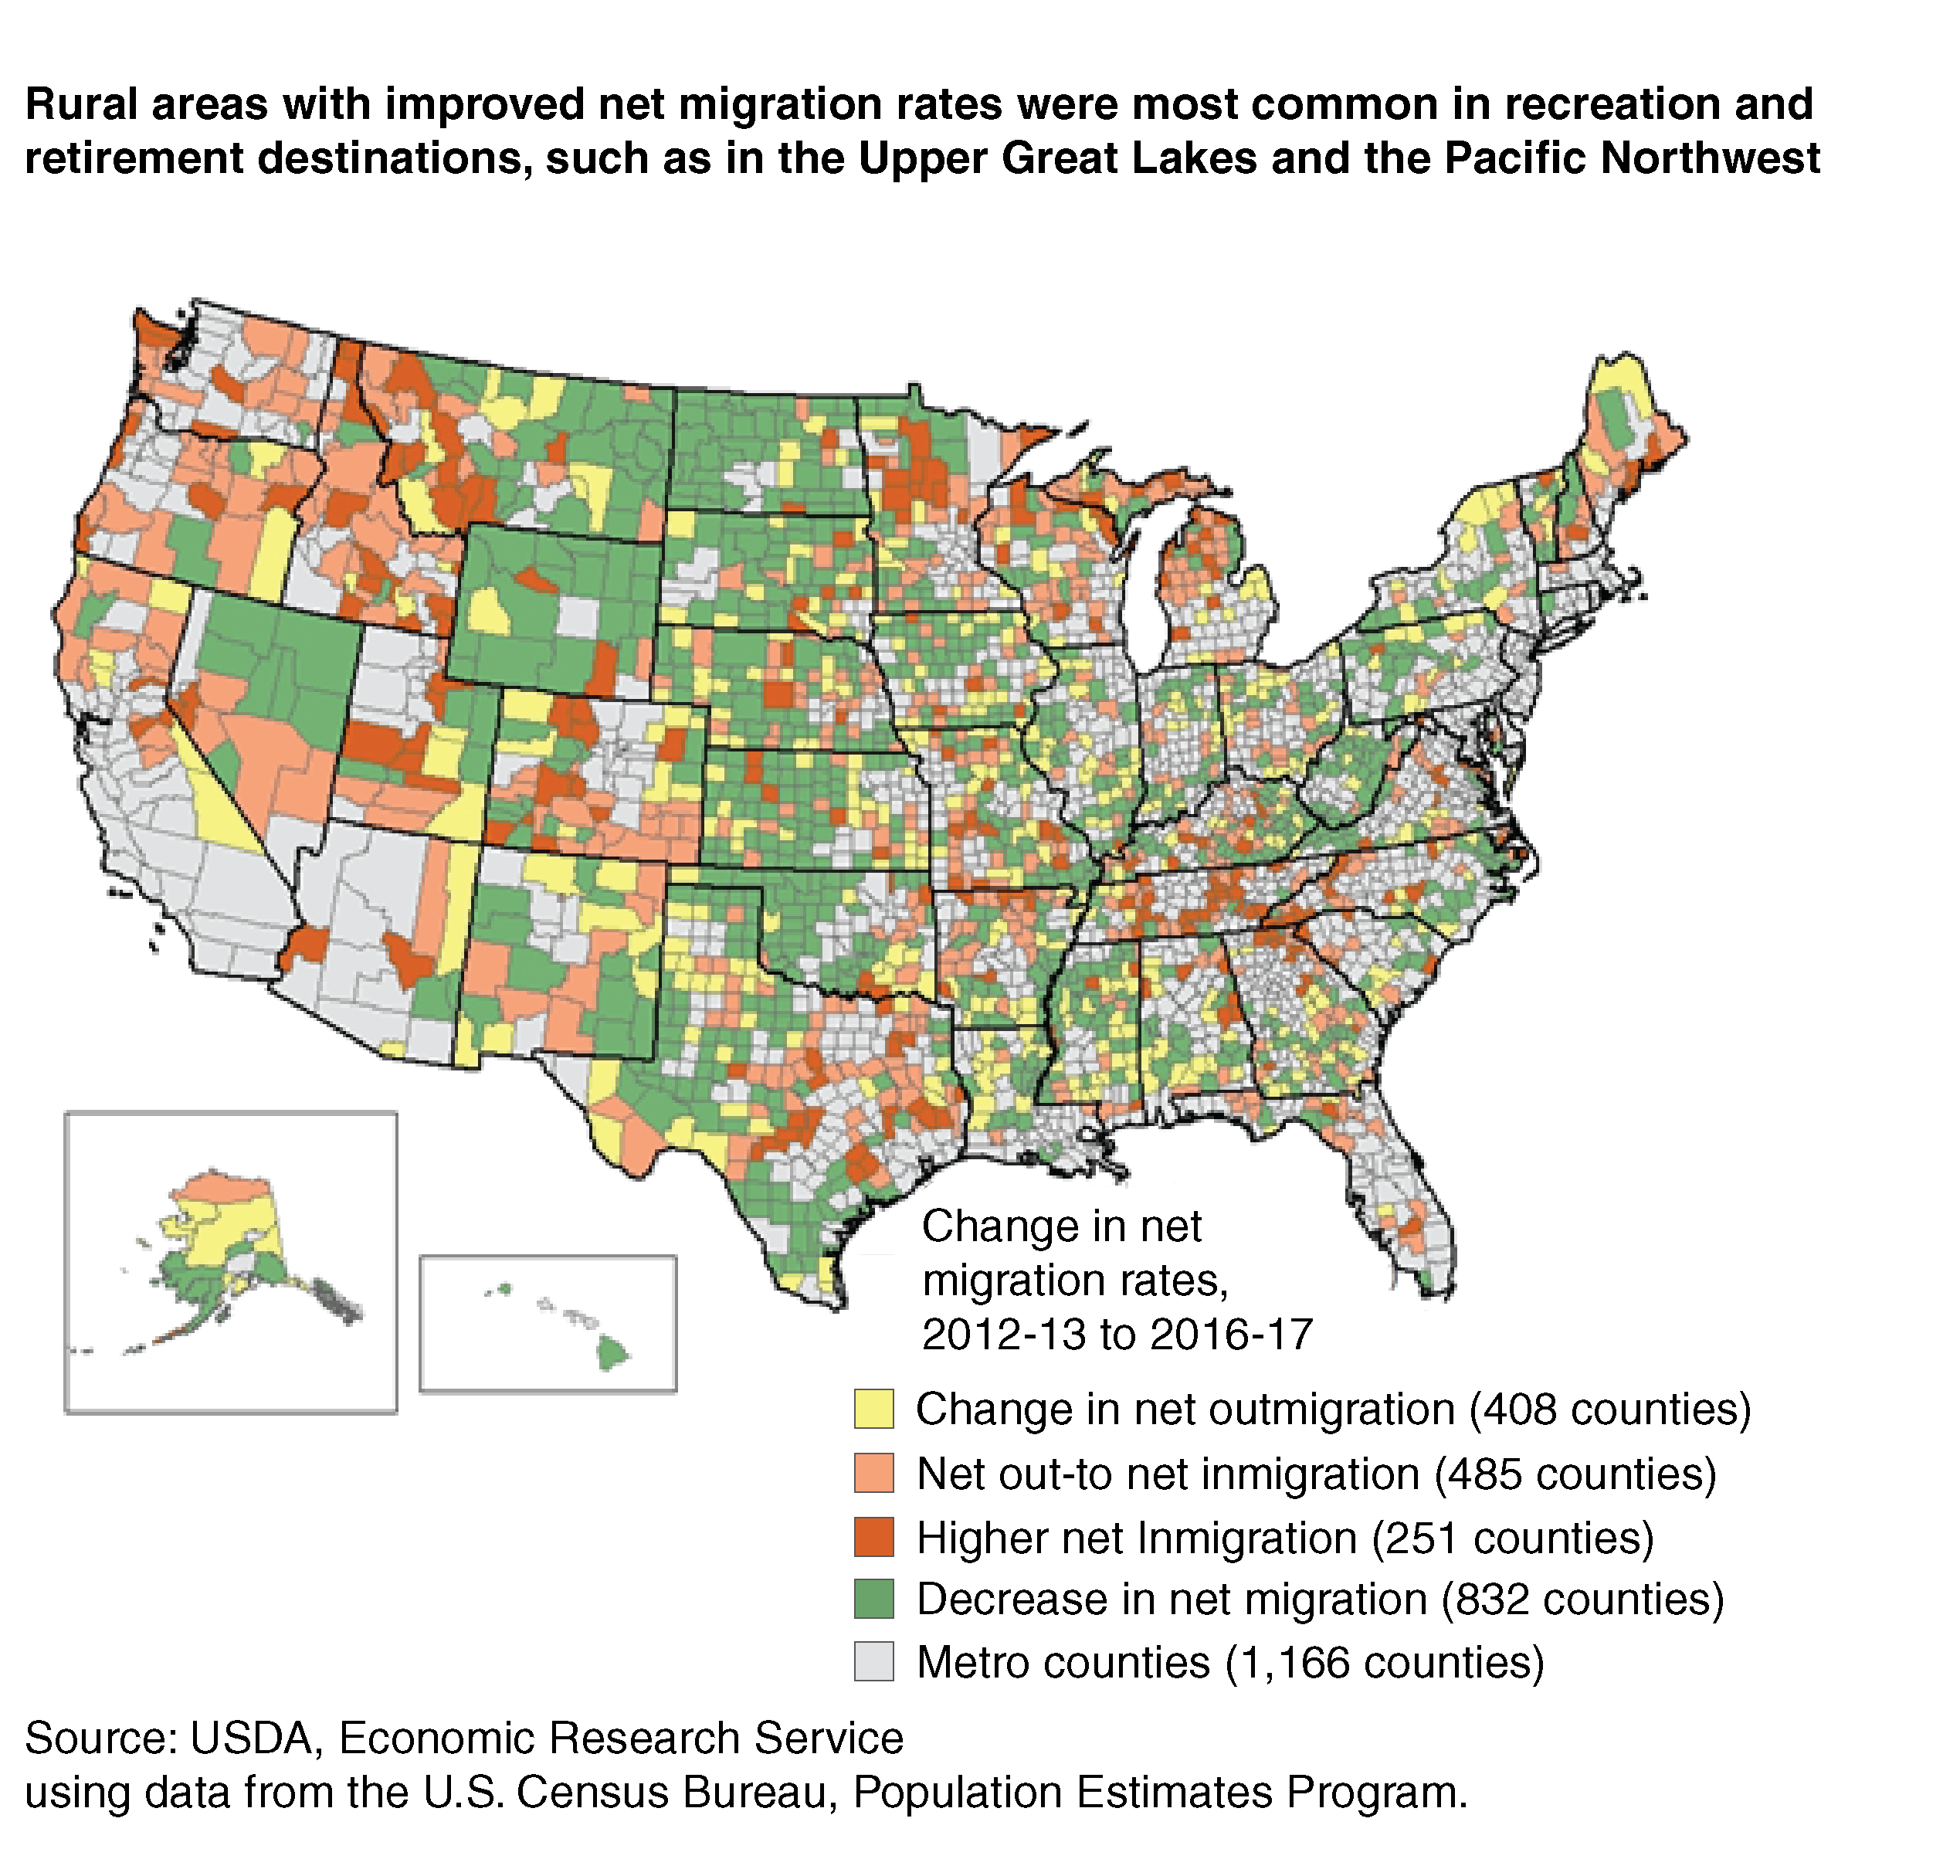
Over 1,100 rural counties (58 percent) showed positive changes in net migration (inmigrants minus outmigrants) between 2012-13 and 2016-17:
- 408 rural counties showed lower net outmigration during 2016-17 compared with 2012-13. These appear in all parts of the country, including more economically challenged areas in the northern Appalachians and southern Coastal Plains. These rural counties continue to experience more people leaving than arriving, but the gap has been closing.
- 485 rural counties switched from net out- to net inmigration. Most of these counties are in high-amenity regions, such as Florida, the Upper Great Lakes, and the Pacific Northwest.
- 251 rural counties showed higher net inmigration in 2016-17 compared with 2012-13. These counties were mostly in areas attractive to newcomers or return migrants, including the southern Appalachians, the Ozarks, and the Hill Country of central Texas. These rural counties attracted more people than they lost in 2012-2013, and the gap grew in 2016-2017.
Despite increasing net migration generally, many rural counties (42 percent) underwent a decrease in net migration between 2012-13 and 2016-17. These counties were in low-density, remote areas in the Nation’s Heartland, in Appalachia from eastern Kentucky to Maine, and in high-poverty areas in the Southeast and border areas of the Southwest. Some of these areas— including parts of North Dakota, Montana, New Mexico, Texas, and Pennsylvania—have suffered job losses related to oil and gas production. Other regions, most notably eastern Kentucky and West Virginia, have been especially hard hit by the opioid epidemic.
Population trends vary by race and ethnicity
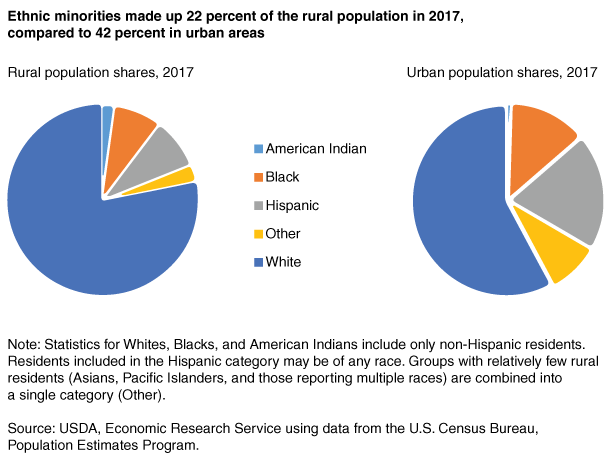
Rural America is less racially and ethnically diverse than the Nation’s urban areas. In 2017, Whites accounted for nearly 80 percent of the rural population (compared to 58 percent in urban areas). While Hispanics were the fastest-growing segment of the rural population, they account for only 9 percent of the rural population (20 percent in urban areas). Blacks made up 8 percent of the rural population (13 percent in urban areas). American Indians were the only minority group with a higher rural (2 percent) than urban share (0.5 percent).
Relatively few Asians and Pacific Islanders (included in the “Other” category) were rural residents, with these groups accounting for 1 and 0.1 percent of the rural population, respectively. The rest of the “Other” category (accounting for 1.8 percent of the rural population) reported multiple races.
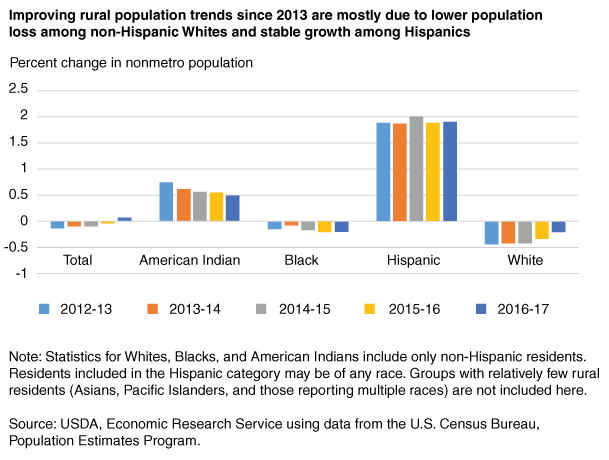
The slow rate of overall population change in rural areas since 2012-13 masks significant differences by race and ethnicity. Population gains among Native Americans and Hispanics offset population losses among Whites and Blacks. Whites were the only group showing a significant change in population trends between 2012-13 and 2016-17—their rate of population loss fell from -0.44 to -0.20 percent. Components of change are not reported by race/ethnicity, but this increase is likely due entirely to changes in net migration, with fewer Whites moving out and more moving into rural areas in 2016-17 compared with 2012-13.
The rural Black population continued to lose population in 2016-17 as well, but at a higher rate of loss than earlier (-0.20 versus -0.14 percent in 2012-13). American Indians increased their rural population throughout the period but at diminishing rates, while the Hispanic rate of growth remained near 2 percent per year throughout the period. In short, Rural America has continued to diversify racially and ethnically—but at a slower rate in 2016-17 than in 2012-13.
This article is drawn from:
- Cromartie, J. (2018). Rural America at a Glance, 2018 Edition. U.S. Department of Agriculture, Economic Research Service. EIB-200.
You may also like:
- Population & Migration. (n.d.). U.S. Department of Agriculture, Economic Research Service.
- Atlas of Rural and Small-Town America. (n.d.). U.S. Department of Agriculture, Economic Research Service.