

Age Composition of USDA’s SNAP Caseload Shifts in Response to Economic Conditions, Legislation, and Demographic Trends
- by Alex Majchrowicz
- 6/4/2018
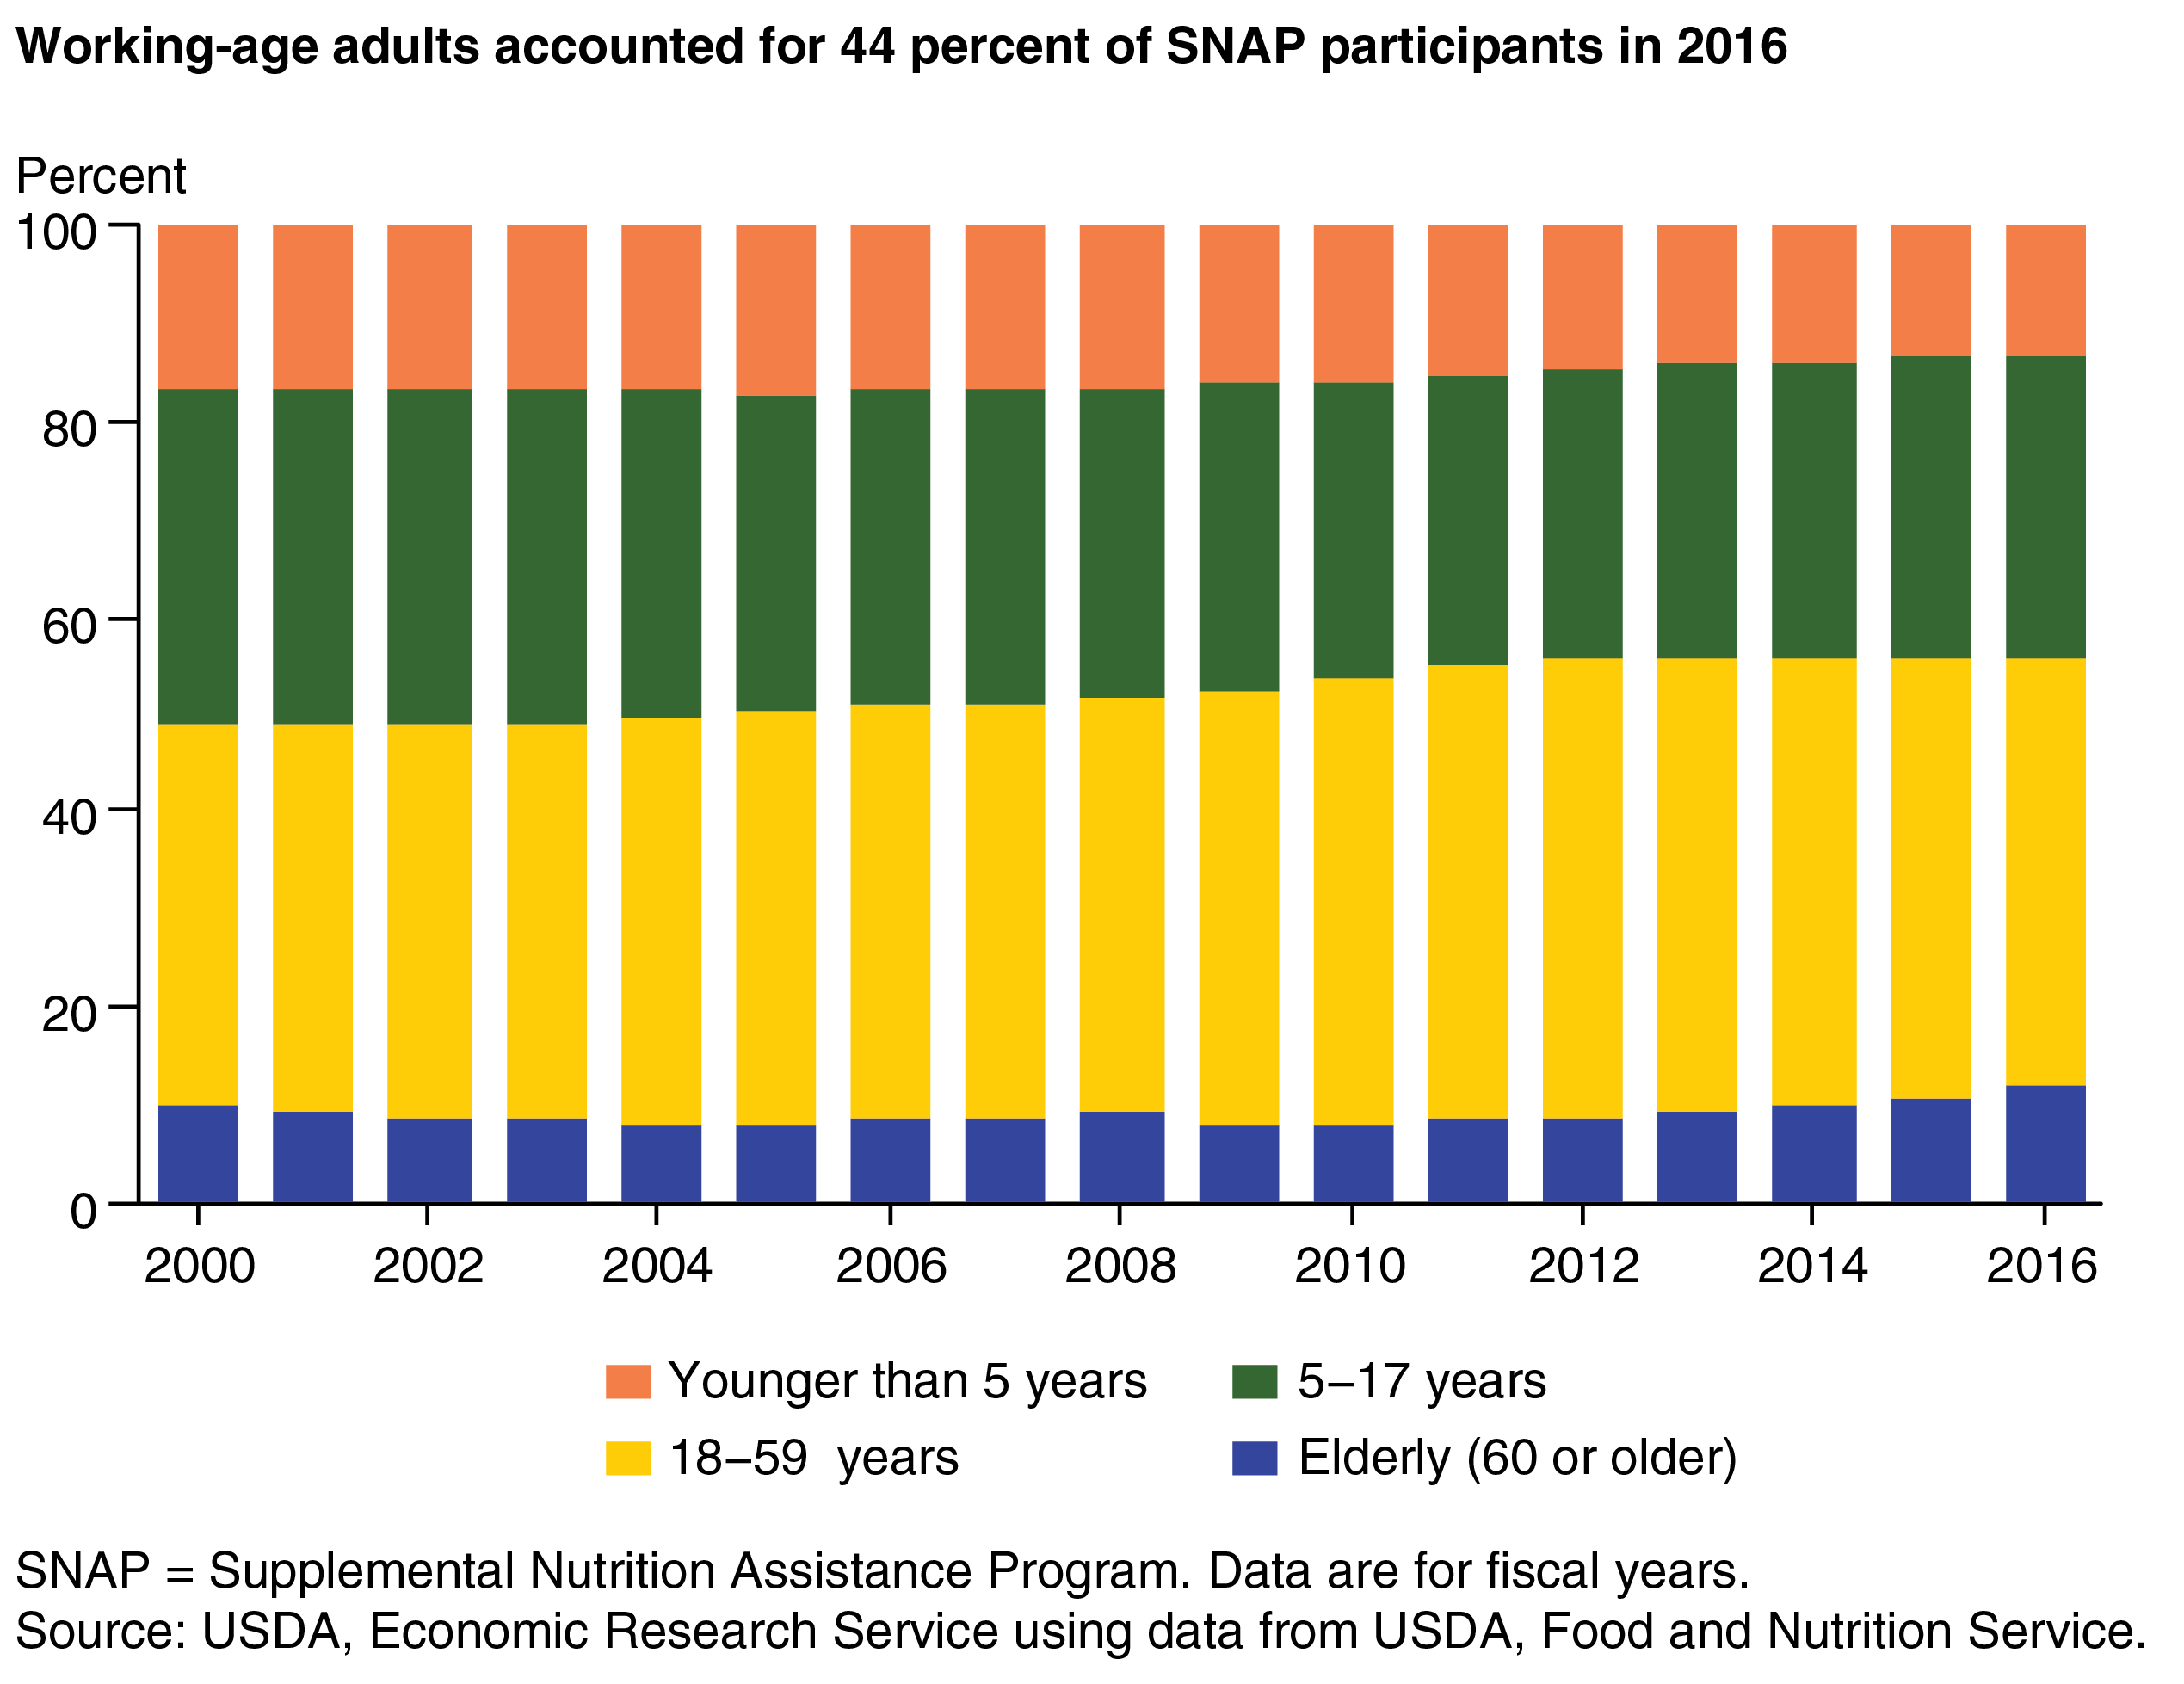
In 2016, 44.1 percent of the 43.5 million Americans participating in USDA’s Supplemental Nutrition Assistance Program (SNAP) were children (age 17 and younger), 44.1 percent were working-age adults (age 18-59) and 11.8 percent were elderly. Eligibility for SNAP benefits is based on income and asset limits, subject to certain immigration status and work requirements. In addition, able-bodied adults between the ages of 18 and 49, who are not caring for dependents, are required to work or participate in a work training program for at least 20 hours per week to receive SNAP benefits for more than 3 months in a 36-month period.
The age composition of SNAP participants has changed over time in response to economic conditions, legislative modifications, and demographic trends. The job losses that accompanied the 2007-09 recession and the slow recovery resulted in more working-age adults becoming eligible for benefits and seeking assistance. Working-age adults’ share of the SNAP caseload rose from 42.4 percent in 2007 to 44.4 percent in 2009.
Provisions in the American Recovery and Reinvestment Act of 2009 (ARRA) further expanded the number of working-age participants in SNAP. The ARRA waived time limits on benefits and work requirements for able-bodied adults without dependents from April 2009 through September 2010. Because of lingering high unemployment, most States were allowed to extend the waivers beyond 2010. Suspension of these requirements contributed to a further increase in SNAP participation by working-age adults, which peaked at 46.5 percent of the caseload in 2012. An improving economy and re-imposition of benefit time limits caused this share to fall to 44.1 percent by 2016.
Young children (under age 5) have become a smaller share of SNAP participants over the past decade, falling from 16.8 percent in 2007 to 13.4 percent in 2016. This decrease reflects the decline in the number of U.S. births, which fell from 4.3 million in 2007 to 3.9 million in 2016.
The share of SNAP participants who are elderly (age 60 or older) was fairly constant over the 2006-12 period, dipping during 2009-11 when higher numbers of working-age adults joined the program. Between 2013 and 2016, the share of elderly SNAP participants rose from 9.3 to 11.8 percent, reflecting two trends: the aging U.S. population and greater outreach to the elderly and simplification of the SNAP application process. In 2014, 42 percent of elderly individuals eligible for SNAP benefits were enrolled in the program, compared with 35 percent in 2007.
This article is drawn from:
- Supplemental Nutrition Assistance Program (SNAP). (n.d.). U.S. Department of Agriculture, Economic Research Service.