Productivity Increases With Farm Size in the Heartland Region
- by Nigel Key
- 12/3/2018
Highlights
- Over the past three decades in the Heartland region, larger crop farms have been more productive than smaller crop farms; this productivity gap has widened over time and may have helped drive the ongoing shift in production to larger scale operations.
- In aggregate, the productivity of crop farms in the Heartland region increased by 64 percent, or 1.5 percent per year, between 1982 and 2012.
- About one-sixth of productivity growth in the region was attributable to the shift in production to larger more productive farms, while adoption of improved technologies and more efficient farm management accounted for the rest.
Past ERS research on consolidation in the U.S. farm sector has documented a widespread shift in agricultural production to large-scale operations. This structural change has likely been partly driven by productivity advantages enjoyed by larger operations. To examine the role productivity has played in consolidation, ERS researchers estimated how productivity varied by farm size for crop operations in the Heartland region and studied how the relationship has changed in recent decades. Results indicate that the smallest farms—those with less than 100 harvested acres of land—have fallen further behind larger farms in terms of productivity, which suggests that the economic advantages of large farms have not diminished.
ERS also estimated the extent to which the shift in production to larger and more productive farms contributed to the aggregate productivity gains over past decades. For crop farms in the Heartland, the researchers found that the shift in production to larger farms accounted for about one-sixth of aggregate productivity growth, while adoption of improved technologies and more efficient farm management accounted for the rest.
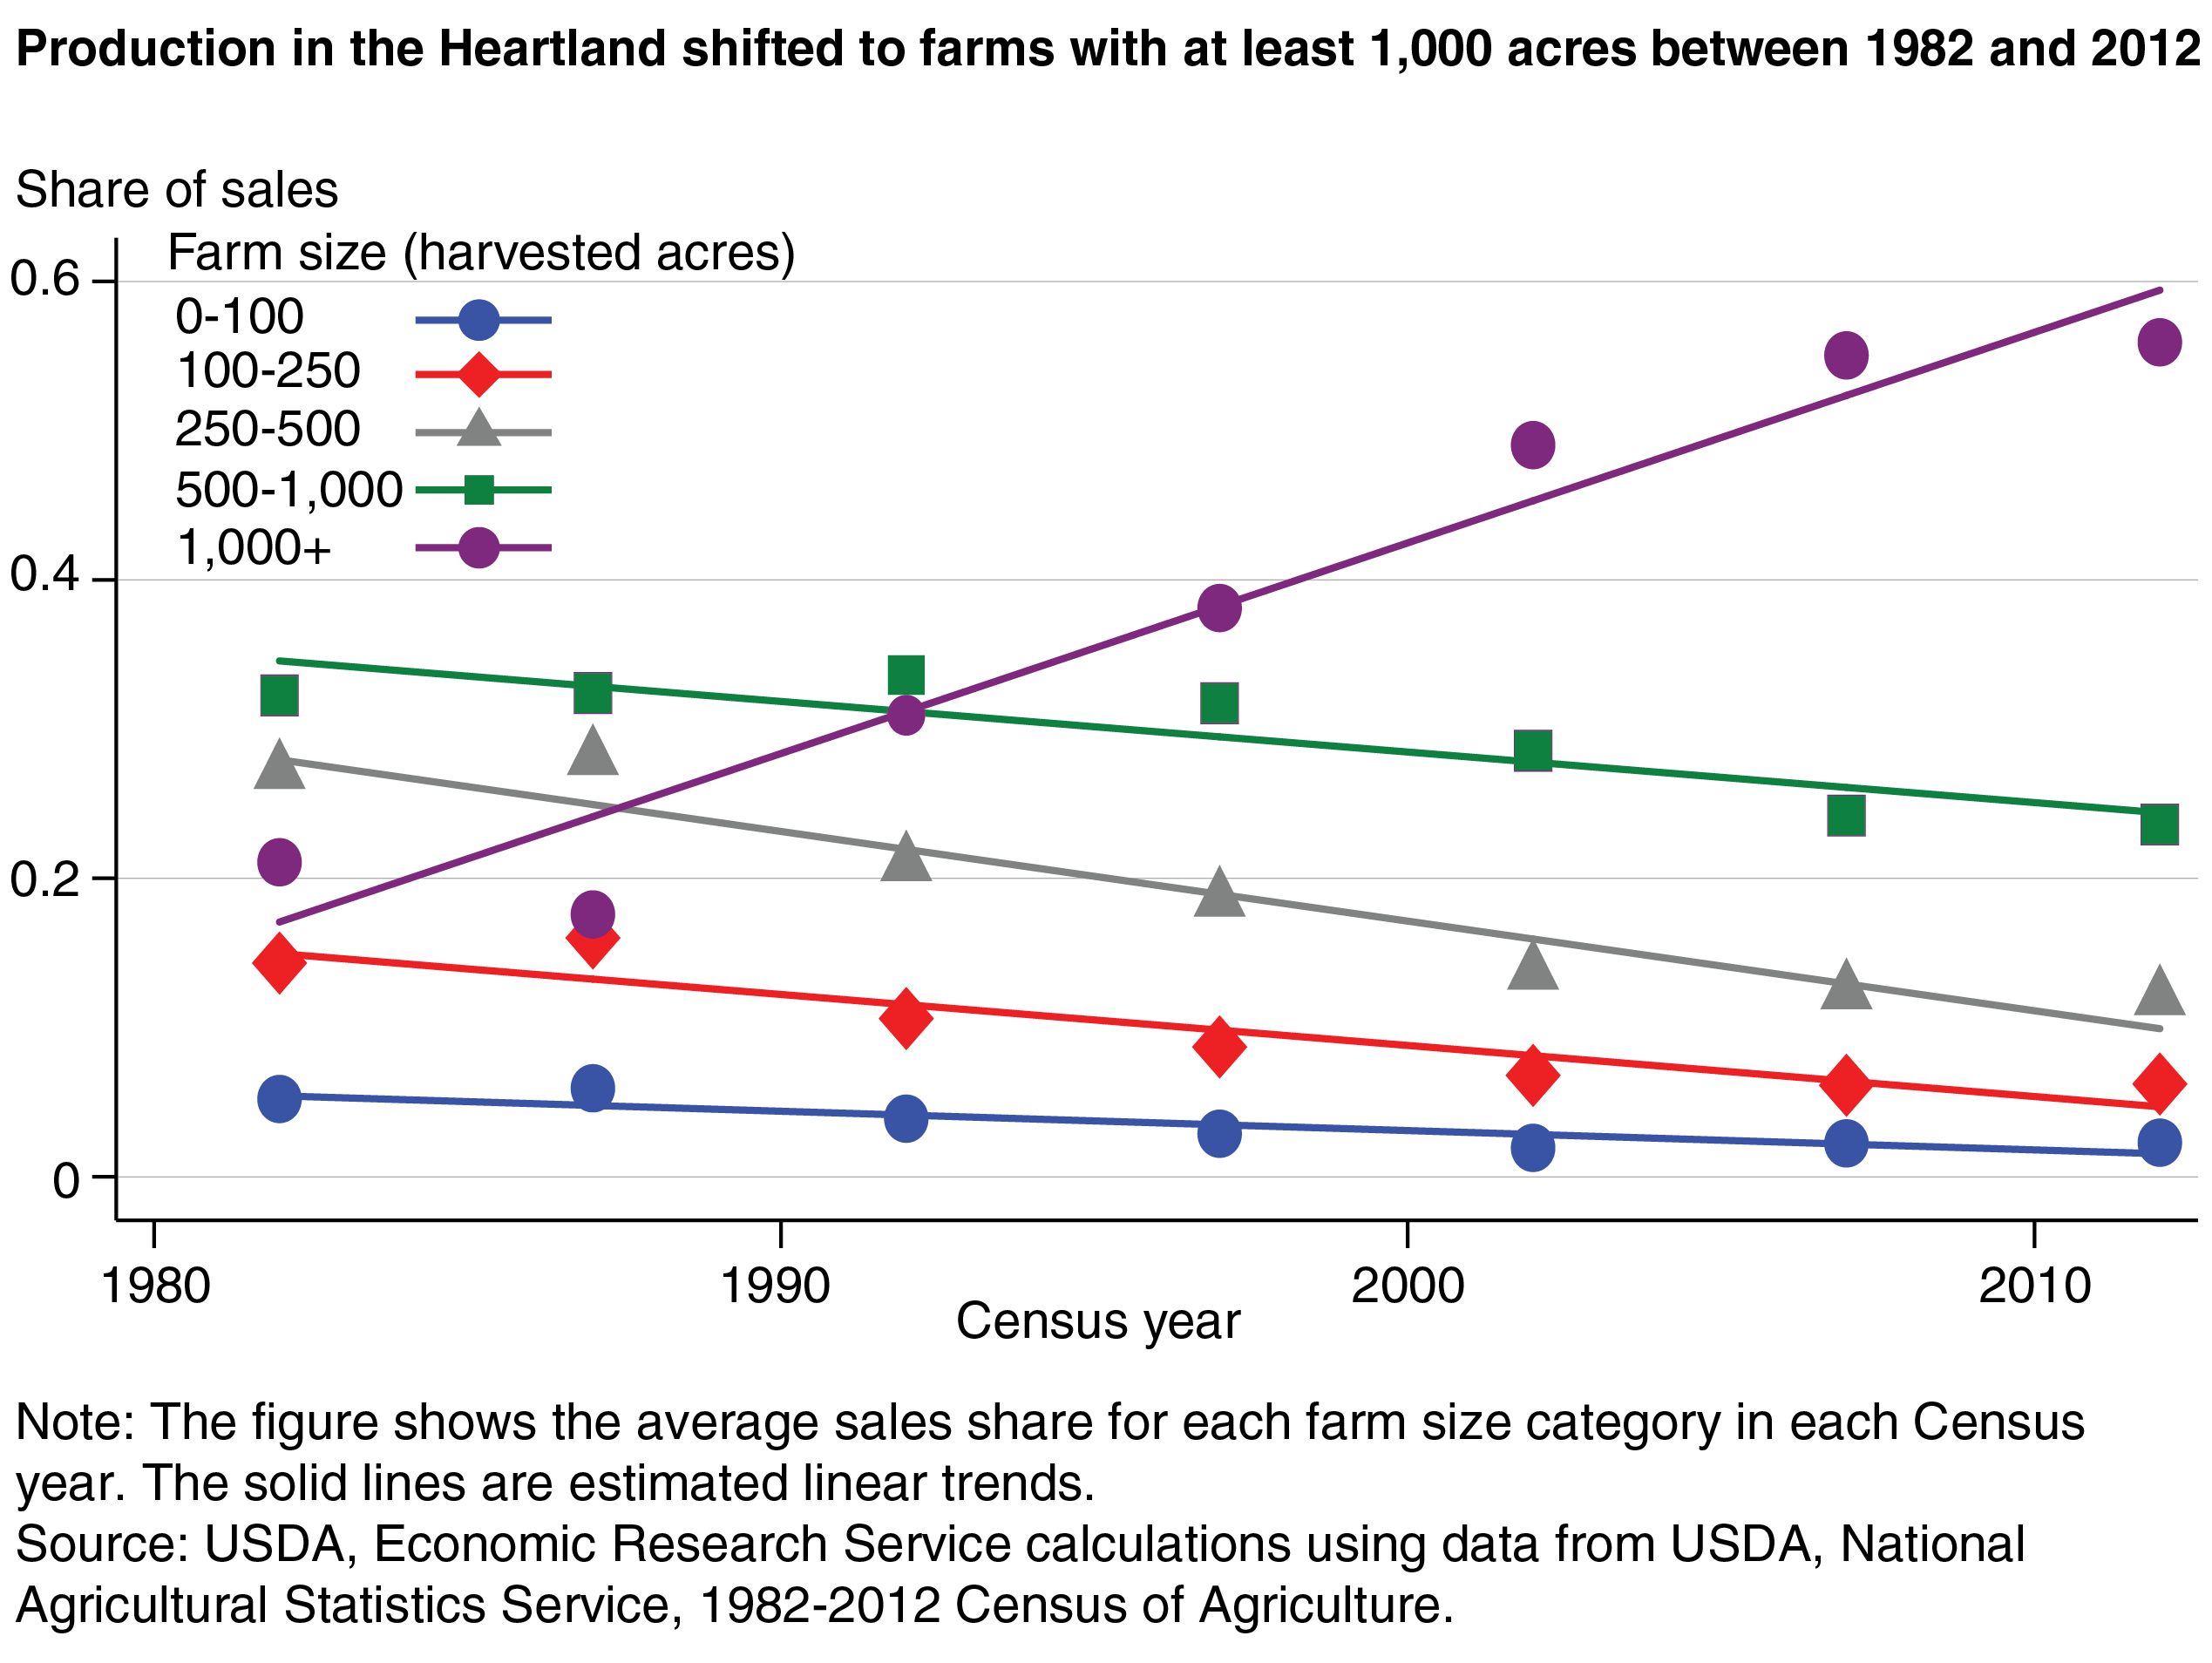
Census of Agriculture data from 1982 to 2012 illustrate how the share of total production has changed for five size categories of crop farms in the Heartland region (which includes all of Iowa, Illinois, and Indiana, and parts of Minnesota, South Dakota, Nebraska, Missouri, Kentucky, and Ohio). The largest farms, those with more than 1,000 acres, increased their share of total production in the region from 17 percent in 1982 to 59 percent in 2012. In contrast, over the same period, the share of total production declined for the four smaller farm size categories. Midsized farms (250-500 acres) experienced the largest decline in market share, falling from about 30 percent in 1982 to 10 percent in 2012.
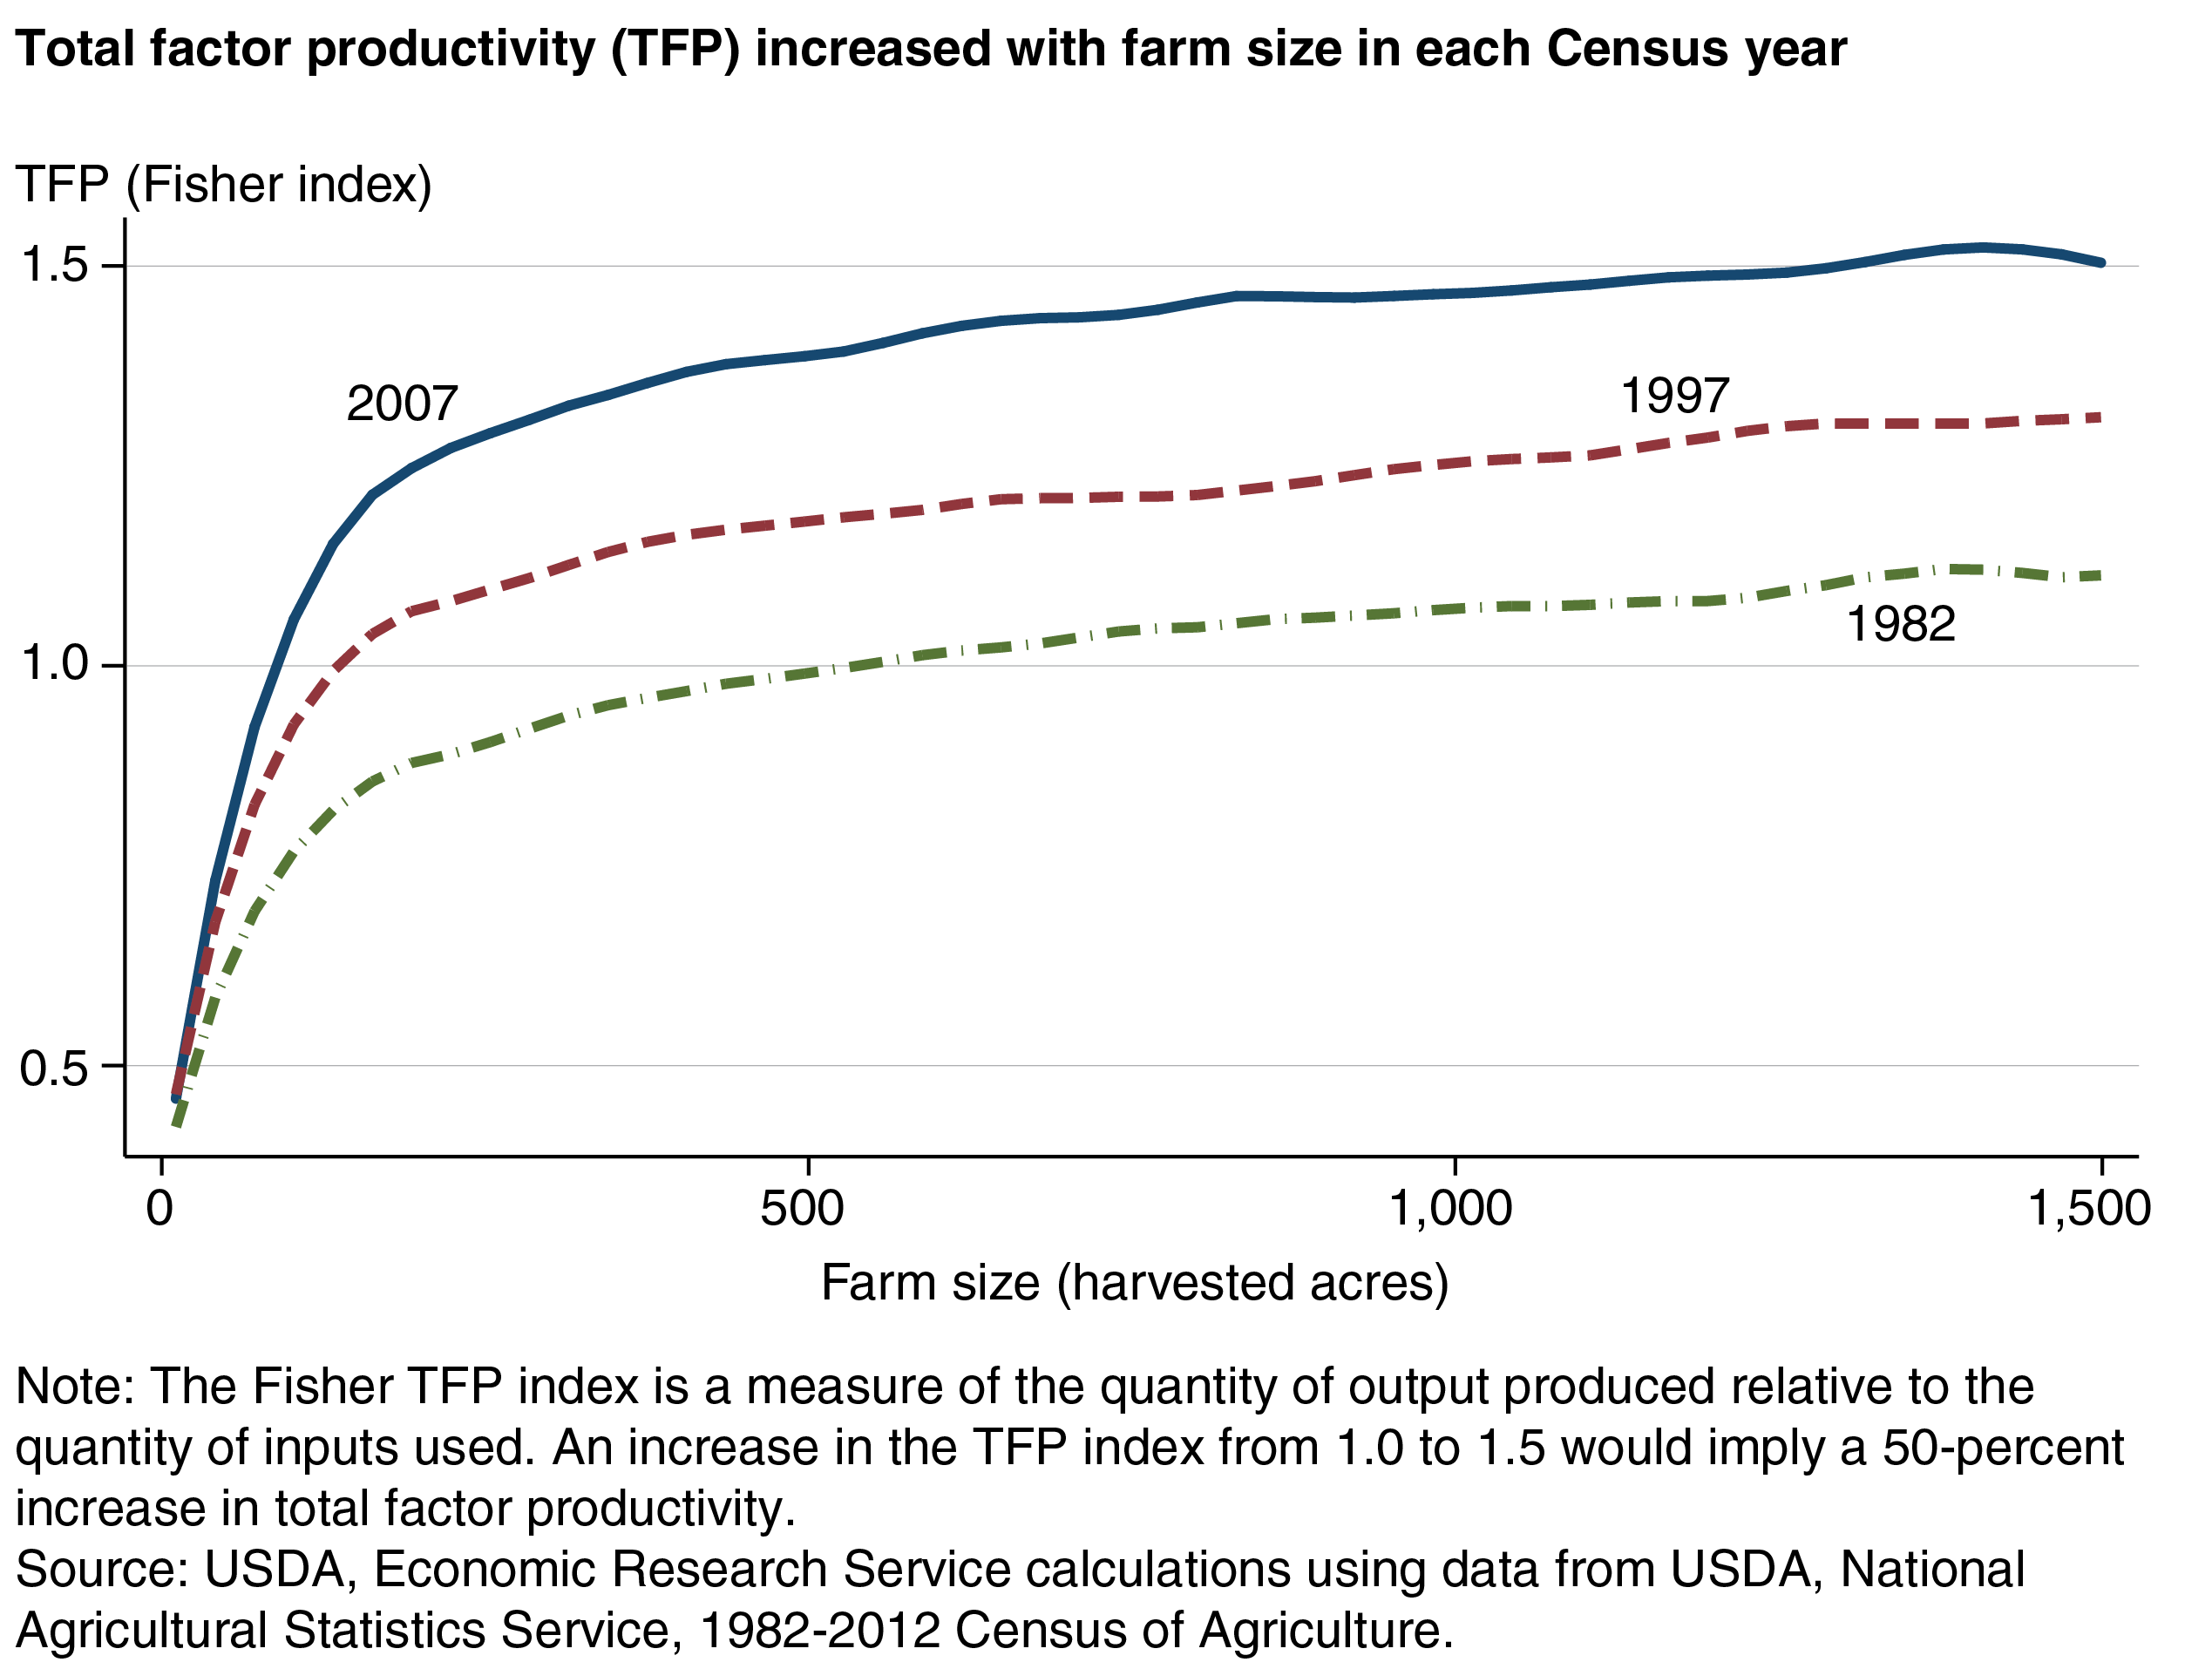
In general, more productive farms are more likely to survive in business over time and to expand in size. To understand whether size-related differences in productivity could provide an incentive for consolidation, ERS researchers estimated the total factor productivity (TFP) of crop farms in the U.S. Heartland region. TFP is an index that measures the amount of output produced per unit of input (prices are used as weights to aggregate multiple outputs and inputs). The data indicate that TFP increased with farm size in each Census year—as is illustrated for 1982, 1997, and 2007 (2012 is not shown because a severe drought in the Heartland region lowered productivity that year).
Consistent with a positive relationship between farm size and TFP, the cost of producing each unit of output declined with farm size. In 2012, small farms (less than 100 acres) spent $2.96 per unit of output, a price-weighted aggregate of all commodities. By comparison, large farms (at least 1,000 acres) spent $1.61 per unit of output. Over half of the $1.35 unit cost difference between the smallest and largest farms was attributable to labor costs, and over a quarter was due to capital costs. Hence, large farms were able to use labor and capital much more cost effectively than small farms.
The labor cost advantages for larger farms may stem from the availability of labor-saving technologies, such as large tractors and harvesters. These technologies reduce the amount of labor required per acre, allowing farms with a limited amount of family labor to produce at a larger, more efficient scale. Moving and setting up large pieces of equipment is costly, and these costs can be minimized when fields are large and contiguous—something that may be more likely on larger farms. Larger farms may also be able to minimize the time that farm equipment is idle.
Other innovations that favor larger operations include global positioning systems (GPS) equipped precision agriculture technologies that allow farmers to more closely match input applications to the crops’ needs. This can reduce the amount of seed, fertilizer, and pesticides used. Using information such as crop yields, terrain topography, and organic matter content, on-board computers can operate variable rate controllers on farm equipment to optimize the application of inputs. GPS-guided autopilot systems also allow farmers to reduce skips and overlap when planting and applying agrochemicals, which also reduces variable input costs. In addition to equipment, genetically engineered seeds that are herbicide or insect tolerant may allow farmers to more easily manage weeds and pests, saving labor and time.
Changes in Productivity Over Time
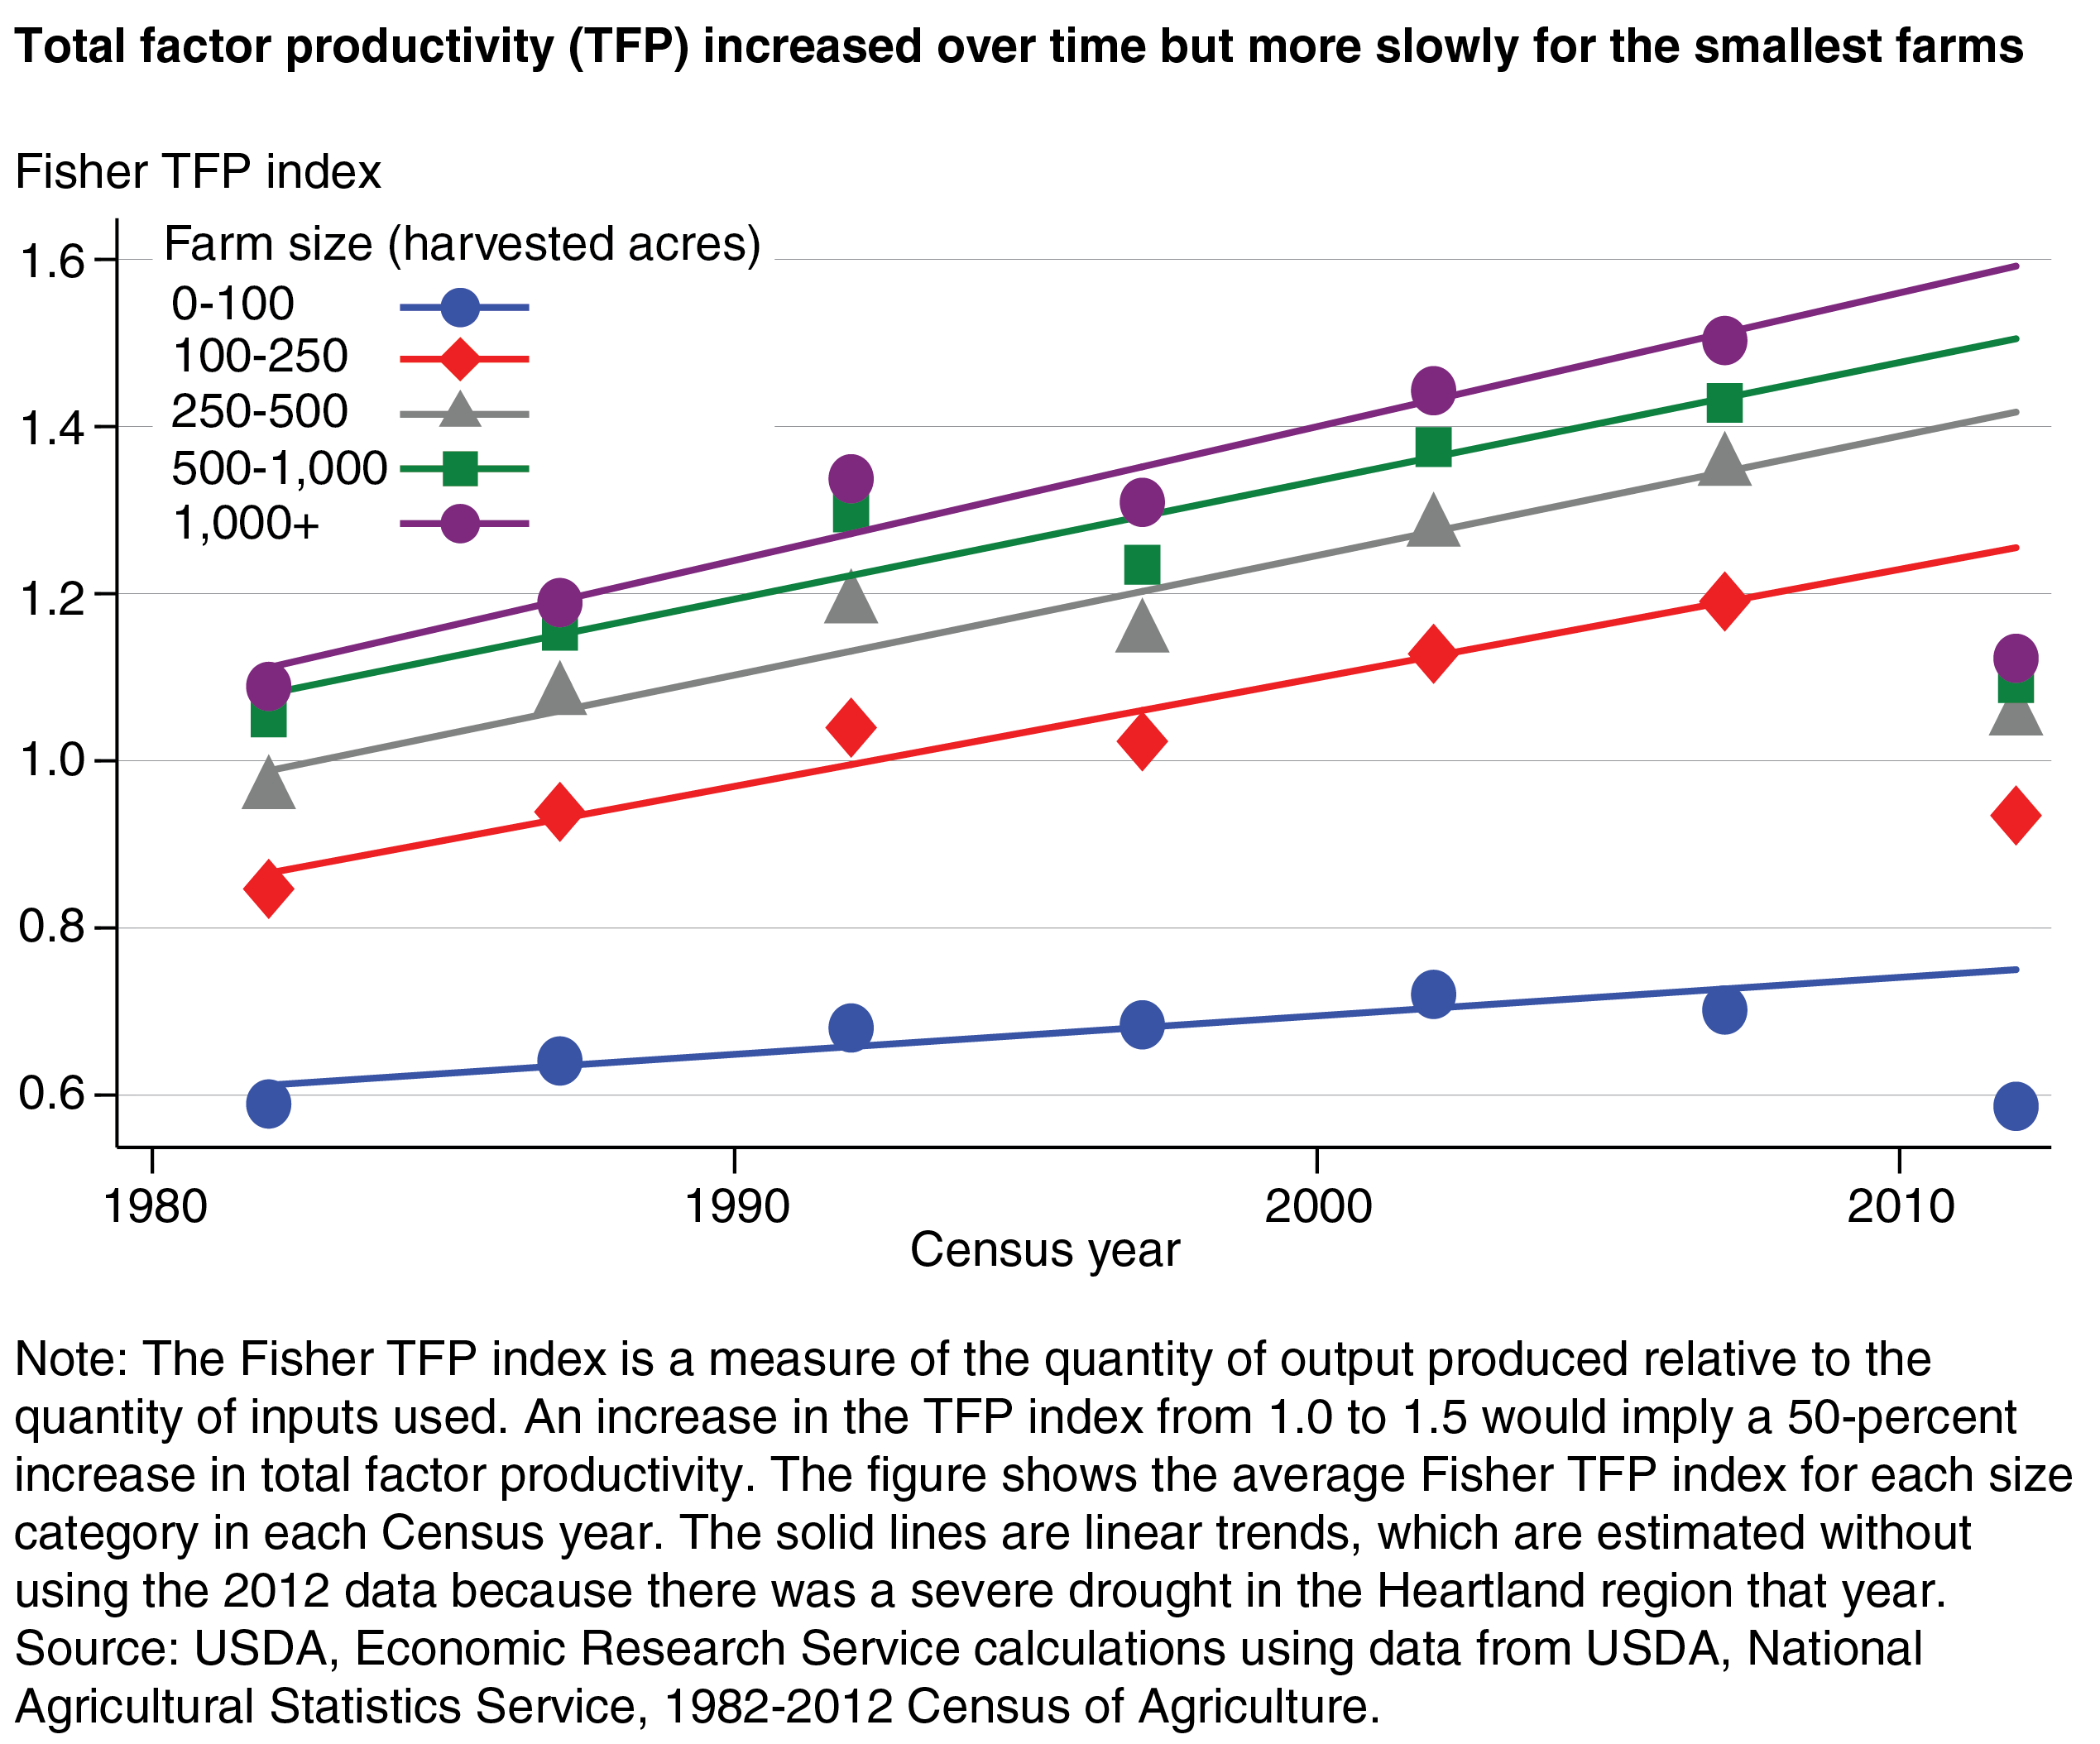
The research also found that the smallest crop farms (less than 100 acres) fell further behind larger farms in terms of productivity between 1982 and 2012. TFP growth rates during the period were similar across farm size classes except for the smallest, which had a significantly slower growth rate. While the TFP for farms in the four largest size categories increased by 47 to 59 percent between 1982 and 2012, TFP for the smallest farms increased by only 17 percent. If this trend continues, farms in the smallest size category may see a further deterioration in their competitive position, and their share of total output may continue to shrink.
Consistent with slower TFP growth for the smallest farms, the study found that the costs per unit of output for the smallest farms did not fall as fast as those for the larger farms over the study period. In particular, the unit costs of labor and variable inputs (seeds, fertilizer, pesticides, and energy) did not decline as rapidly. This suggests that some technological advances in recent decades, such as very large combine harvesters and precision agriculture technologies, were not as advantageous for the smallest farms. Lower adoption rates of precision agricultural technologies on the smallest farms, which have been observed in other studies, might explain why the labor and variable input costs disparities increased—and why the farm productivity growth of the smallest farms has lagged behind that of larger operations.
While technological innovations over the past few decades appear to have disadvantaged small-scale crop farms, this may not necessarily be the case going forward. Future technological innovations that are cost effective to adopt on a small scale could help reduce the productivity differences between small and large farms in the years ahead.
Implications for Aggregate Productivity
Because large farms are more productive than small farms, consolidation of production contributed significantly to aggregate agricultural productivity growth in the Heartland region—which increased by 64 percent, or 1.5 percent per year, between 1982 and 2012. ERS estimates that 17 percent of aggregate productivity growth was attributable to the shift to larger and more productive operations.
The remaining 83 percent of aggregate TFP growth was due to the increasing TFP of the average farm in each size category. This TFP growth was due to factors other than farm size change, including technical change (the adoption of more productive technologies) and technical efficiency change (more efficient farm management). Hence, while technological change and technical efficiency change were the most important sources of aggregate productivity growth in recent decades, the contribution from the farm size distribution change was substantial.
If the rate of consolidation of crop production slows in the coming decades, then aggregate TFP growth rates may decline as well, unless the rate of technological progress increases. The data provide no indication yet of a slowdown in crop production consolidation or productivity growth in the Heartland region. However, with most output in the region now produced by large farms, it is plausible that the pace of consolidation and, consequently, productivity growth, will slow in the coming decades.
This article is drawn from:
- “Farm Size and Productivity Growth in the United States Corn Belt,” by Nigel Key. (2018). Food Policy.
You may also like:
- MacDonald, J.M., Hoppe, R.A. & Newton, D. (2018). Three Decades of Consolidation in U.S. Agriculture. U.S. Department of Agriculture, Economic Research Service. EIB-189.
- Hoppe, R.A. (2017). America’s Diverse Family Farms: 2017 Edition. U.S. Department of Agriculture, Economic Research Service. EIB-185.


