Rural Areas Show Overall Population Decline and Shifting Regional Patterns of Population Change
- by John Cromartie
- 9/5/2017
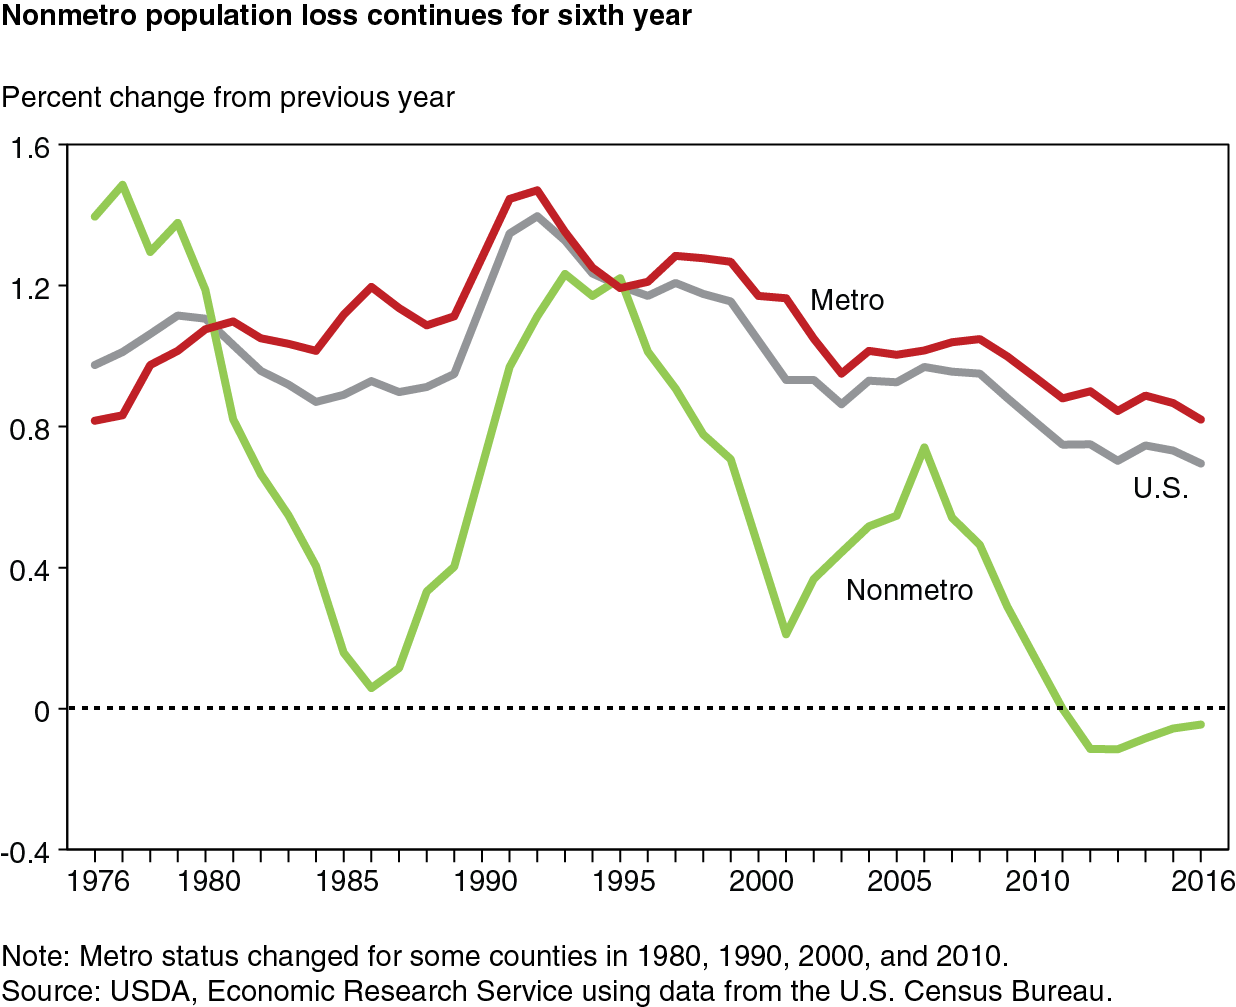
The number of people living in rural (nonmetro) counties stood at 46.1 million in July 2016—14 percent of all U.S. residents spread across 72 percent of the Nation’s land area. The rural population declined by 21,000 between July 2015 and July 2016, according to the U.S. Census Bureau’s latest population estimates, the sixth consecutive year of modest population losses. Although many rural counties have shown population losses for decades, this is the first period on record of overall rural population decline.
ERS researchers and others who analyze conditions in “rural” America most often use data on nonmetro areas, defined as counties outside the commuting zones of cities of 50,000 or more (see the ERS What is Rural? topic page for more details). Population growth rates in rural counties have been significantly lower than in urban (metro) counties since the mid-1990s, and the gap widened considerably in recent years. Between 2006 and 2016, annual rates of population change in rural areas fell from 0.7 percent to below zero, while urban rates fell only slightly from 1 to 0.8 percent.
Population Growth From Natural Change No Longer Offsetting Net Migration Loss
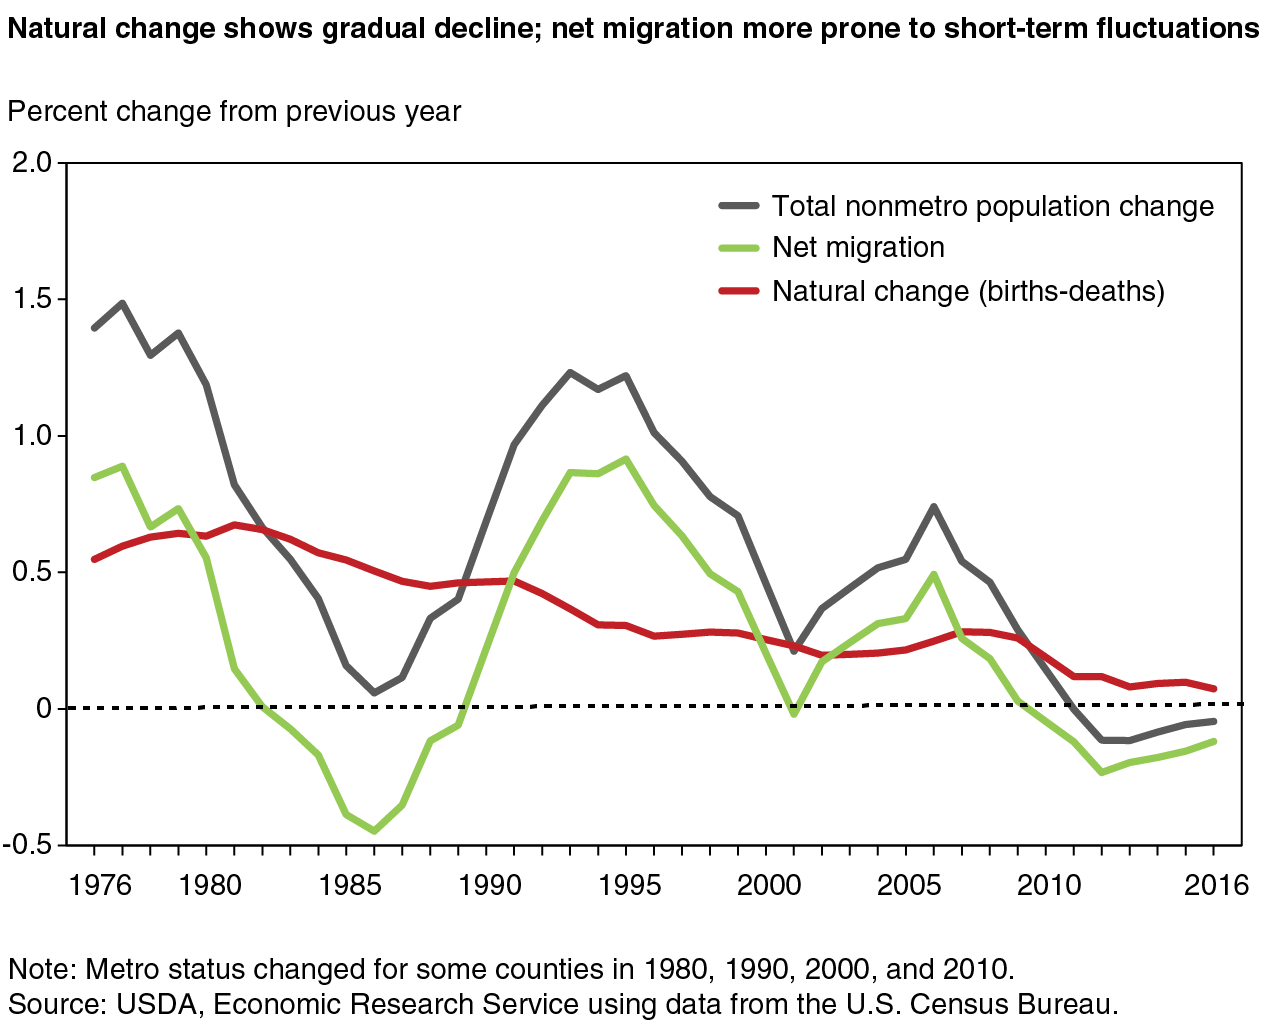
County population change includes two major components: natural change (births minus deaths) and net migration (in-migrants minus out-migrants). While natural change has gradually trended downward over time, net migration rates tend to fluctuate in response to economic conditions. Since 2010, the increase in rural population from natural change (270,000 more births than deaths) has not matched the decrease in population from net migration (462,000 more people moved out than moved in). Net migration rates were often much lower in the past—during the 1950s, 1960s, and 1980s—but were always offset by higher rates of natural change.
More Deaths Than Births Now Occurring in Hundreds of Rural Counties
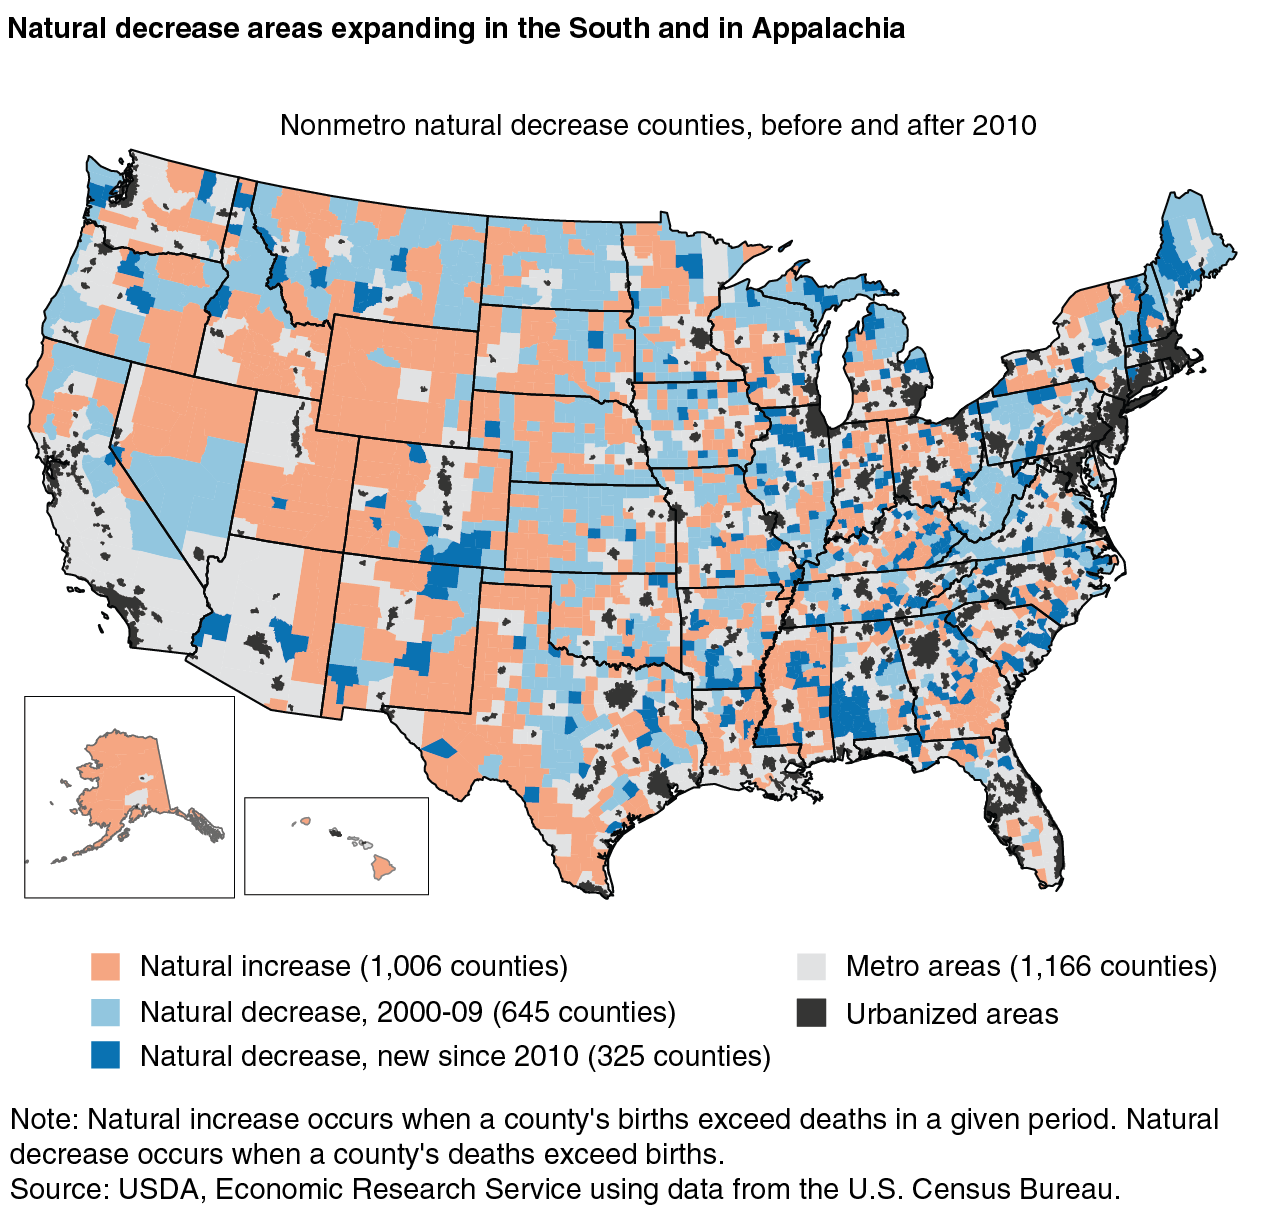
Population growth from natural change (more births than deaths, also known as natural increase) was the norm historically. But declining birth rates, increasing mortality rates among working-age adults, and an aging population have led to the emergence of natural decrease (more deaths than births) in hundreds of U.S. counties, most of them rural counties. Lower rates of natural change resulted in 325 rural counties experiencing sustained natural decrease for the first time during 2010-16, adding to 645 rural counties with natural decrease during 2000-09.
Areas that recently began experiencing natural decrease are found in New England, northern Michigan, and high-poverty areas in the southern Coastal Plains. Such counties also are found in and around the margins of Appalachia, expanding a large region of natural decrease extending from Maine through northern Alabama.
Shifting Geography of Population Change
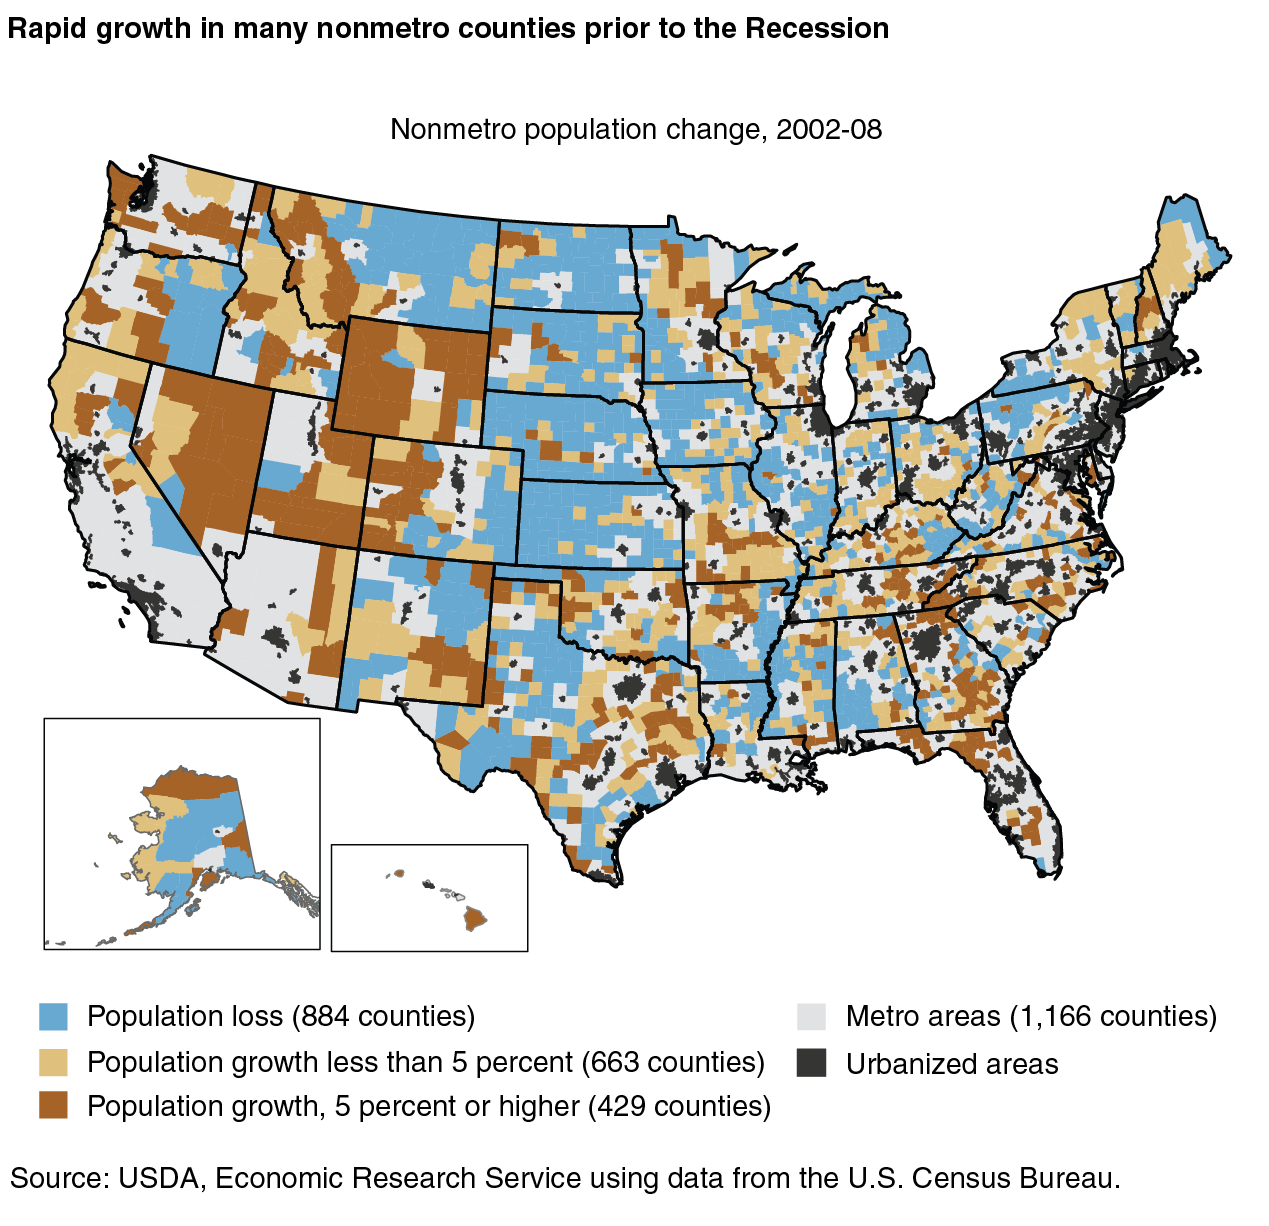
Opportunities for population growth and economic expansion vary widely from one rural county to the next. A comparison of maps for two time periods (2002-08 and 2010-16) shows that new regional patterns of growth and decline have emerged in recent years.
The first map shows geographic patterns of population growth that held sway for decades. Population loss affected most rural counties dependent on agriculture, in the Great Plains from eastern Montana to west Texas, extending into Corn Belt areas of Iowa, Illinois, and other Midwestern States. Population loss also affected areas of relatively high poverty in the southern Coastal Plains from eastern Texas to Virginia, and in Appalachia from eastern Kentucky through upstate New York.
Rapid population gains in rural counties near large and medium-sized metro areas reflected long-term suburbanization trends that transformed hundreds of rural areas and small towns. Rapid growth was also concentrated in recreation areas with attractive scenery and retirement destinations, such as throughout the Rocky Mountains and Pacific Coast regions, in the Ozarks and southern Appalachia, and in Florida.
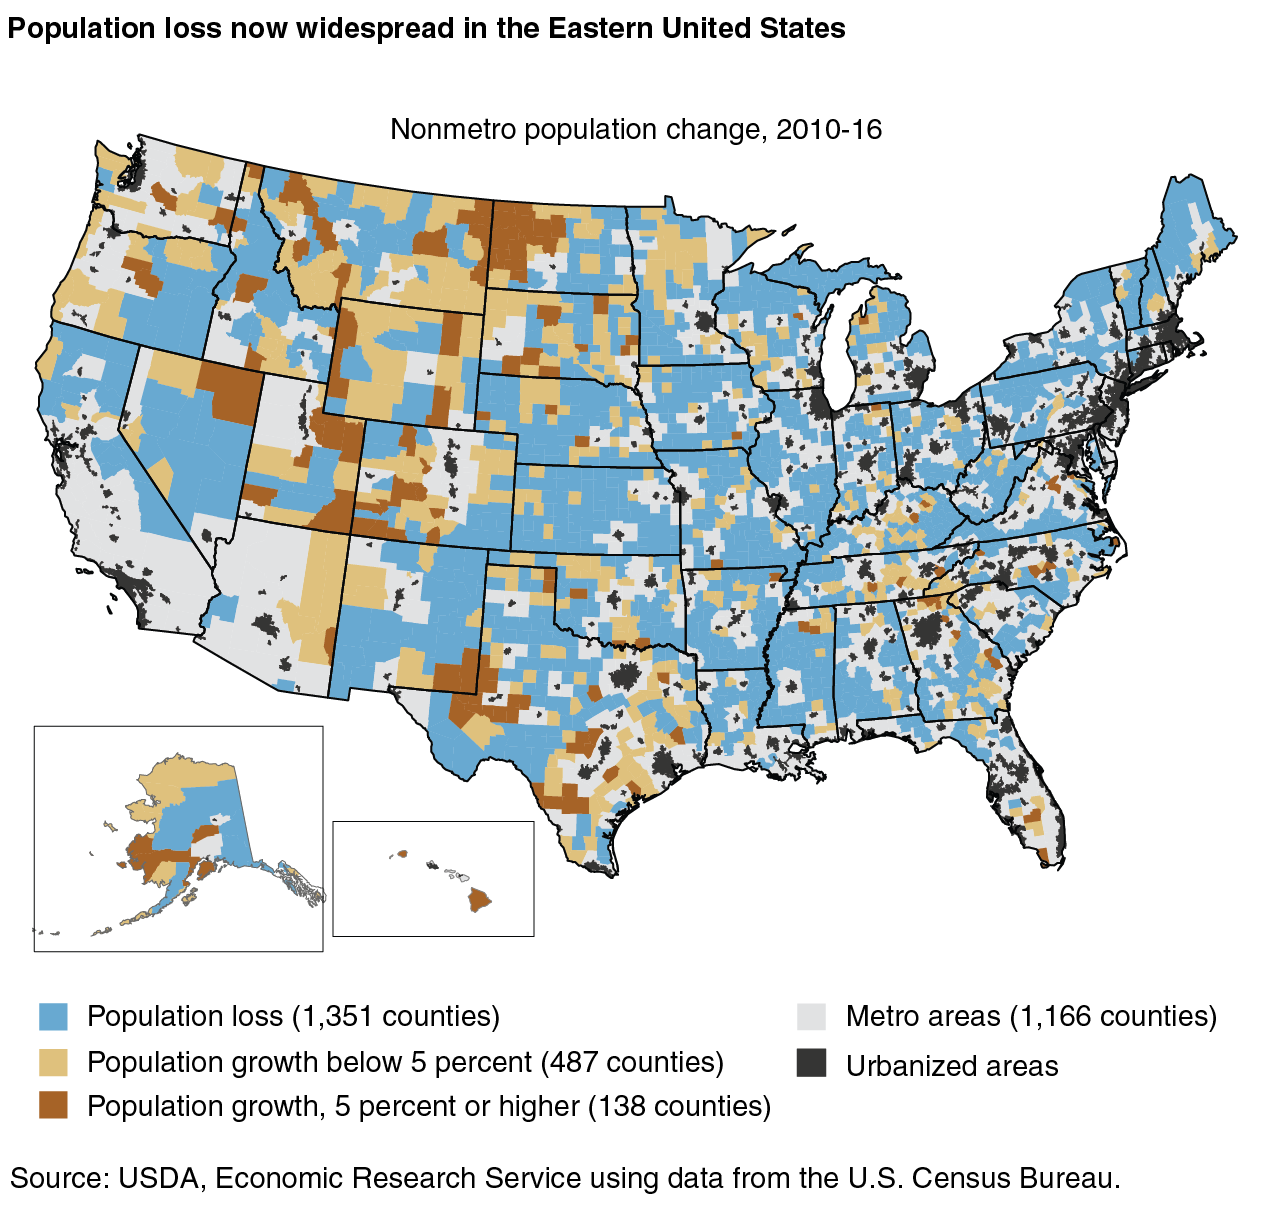
The second map shows declining population trends and geographic shifts since 2010. In 2010-16, rural population decline occurred in 18 out of 23 eastern States that had been growing during 2002-08. Population growth also slowed considerably in the Mountain West for the first time in decades, affecting numerous counties in Utah, Idaho, Nevada, and elsewhere. Overall, only 138 rural counties grew by 5 percent or more since 2010, compared with 429 counties prior to the Great Recession.
Spurred by an energy boom, large sections of the Great Plains turned around decades of population decline. This is most visible in sparsely settled regions such as the Williston Basin in western North Dakota and eastern Montana. However, the most recent year of data (2015-16) shows a significant reversal in population growth in these energy-sector regions, in line with recent cutbacks in oil production.
This first-ever period of overall rural population loss may be short-lived depending on the course of the economic recovery. The cyclical downturn in net migration that began in 2007 bottomed out in 2012, and improving population trends since 2012 coincide with a marked improvement in rural employment growth. Even if temporary, this small but historic shift to overall population loss highlights a growing demographic challenge facing many regions across rural and small-town America: population growth from natural increase is no longer large enough to counter cyclical net migration losses.
This article is drawn from:
- Population & Migration. (n.d.). U.S. Department of Agriculture, Economic Research Service.
- Atlas of Rural and Small-Town America. (n.d.). U.S. Department of Agriculture, Economic Research Service.
You may also like:
- Rural Classifications - What is Rural?. (n.d.). U.S. Department of Agriculture, Economic Research Service.


