Americans’ Seafood Consumption Below Recommendations
- by Linda Kantor
- 10/3/2016
From fish tacos to smoked salmon pizza to shrimp sushi rolls, Americans are finding new ways to eat seafood. Seafood (fish and shellfish) is a nutrient-dense source of dietary protein, which is relatively low in calories and saturated fat, compared to some other protein sources, and rich in key nutrients, including vitamins A, B12, and D; iron; zinc; magnesium; phosphorous; and potassium. Seafood is the primary food source of the beneficial omega-3 fatty acids, EPA and DHA.
The 2015-20 Dietary Guidelines for Americans and supporting USDA MyPlate food group targets recommend that Americans eat a variety of protein foods, including at least two servings of seafood per week, as part of a healthy eating pattern low in added sugars, saturated fats, and sodium. For an average 2,000-calorie-per-day diet, that advice translates into at least 8 ounces of fish and shellfish per week, or about 20 percent of total consumption from the protein foods group (meat, poultry, seafood, eggs, legumes, nuts, seeds, and soy foods).
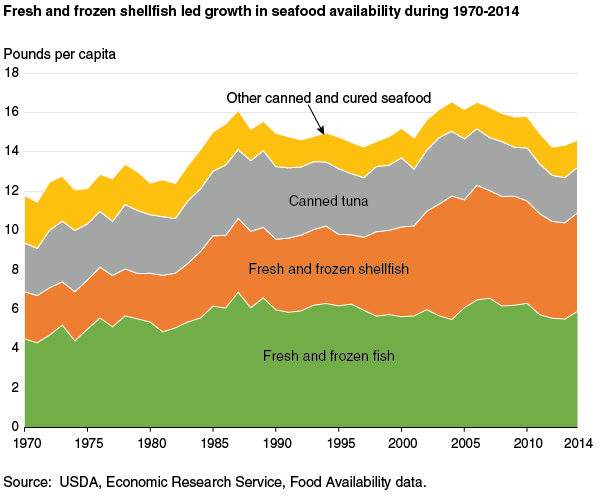
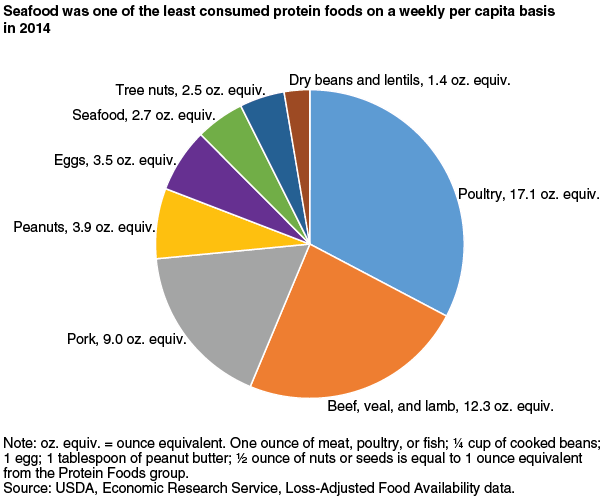
ERS food availability data suggest that Americans are eating less than this recommended amount of seafood. After growing from 12 pounds in 1970 to a peak of 16.5 pounds in 2006, average per capita supplies of seafood available for Americans to eat were 2 pounds less in 2014 at 14.5 pounds. Loss-adjusted availability (a proxy for consumption) was 2.7 ounces per week, or about one-third of recommendations.
ERS annually calculates the available supply of a commodity as the sum of production, imports, and beginning inventories minus exports; farm, industrial, and other nonfood uses; and ending inventories. Per capita estimates are determined by dividing the total annual supply of the commodity by the U.S. population for that year. ERS calculates a second set of data—loss-adjusted food availability—by adjusting for food spoilage, plate waste, and other losses at the retail and consumer levels, to more closely approximate actual intake.
Survey data show that while more than half of Americans meet or exceed Dietary Guidelines targets for the total protein foods group, most people need to make changes in their choice of foods within the group to reap the health benefits of seafood and stay within limits for total calories and saturated fat. Compared to the recommended 20 percent, seafood accounted for 5 percent of total consumption from the protein foods group in 2014, which was dominated by meat and poultry.
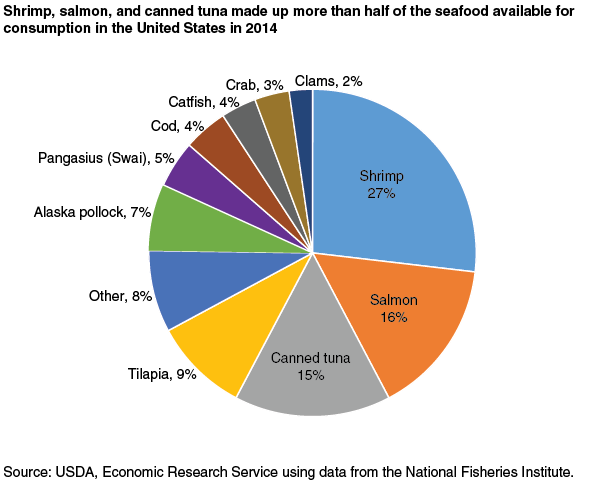
Consumers also chose a relatively limited variety of seafood products. Five foods—shrimp, salmon, canned tuna, tilapia, and Alaska pollock—made up nearly three-quarters of total seafood consumption in 2014. Low-cost imports of farm-raised shrimp, salmon, and tilapia and the use of wild-caught Alaska pollock in fast-food fish sandwiches, frozen fish sticks, and imitation crab meat have largely driven the popularity of these four seafood species.
Consumption of seafood may be limited by a number of factors, including a lack of awareness about the health benefits of seafood; unfamiliarity with preparation methods; higher retail prices, on average, compared with meat and poultry; and concerns about food safety and mislabeling of imported seafood products.
This article is drawn from:
- Food Availability (Per Capita) Data System. (n.d.). U.S. Department of Agriculture, Economic Research Service.


