
Agriculture Risk Coverage Program Proves More Popular Than the Supplemental Coverage Option
- by Erik O'Donoghue and Ashley Hungerford
- 1/12/2016
Highlights
- The Agriculture Risk Coverage (ARC) program and the Supplemental Coverage Option (SCO) are both colloquially known as “shallow loss” programs, designed to help producers with losses not covered by crop insurance policies typically selected by producers.
- While commodity prices affect how both ARC and SCO provide support to farmers, ARC support is more sensitive to historic prices.
- During the ARC election period, high historic prices and low expected commodity prices likely caused producers to favor ARC over SCO.
The 2014 Farm Act brought about a large change in the way support is provided to farmers. The system of Direct Payments, where producers received benefits based on historical production and commodity prices, regardless of the crop or the harvest outcome, was replaced with an approach geared toward providing producers with support when revenues drop due to either low prices, low yields, or a combination of the two. Several new programs were introduced, including the Agriculture Risk Coverage (ARC) program, the Price Loss Coverage (PLC) program, and the Supplemental Coverage Option (SCO). While PLC updates the old Countercyclical Payment Program (CCP), ARC and SCO are more novel and have become known colloquially as shallow loss programs. ARC and SCO cover losses outside the Federal Crop Insurance (FCI) policies typically purchased by producers.
Interactions among these programs and the traditional FCI policies help determine the nature and magnitude of producer support which, in turn, affect producer revenue and its variability, producer well-being, and expected program costs. Historical prices, expected prices, and FCI coverage rates all influence the effectiveness and popularity of these programs. High historic crop prices, combined with low expected prices since the enactment of the 2014 Farm Act, led to higher producer enrollment in ARC relative to SCO in 2015.
A Producer’s Choice
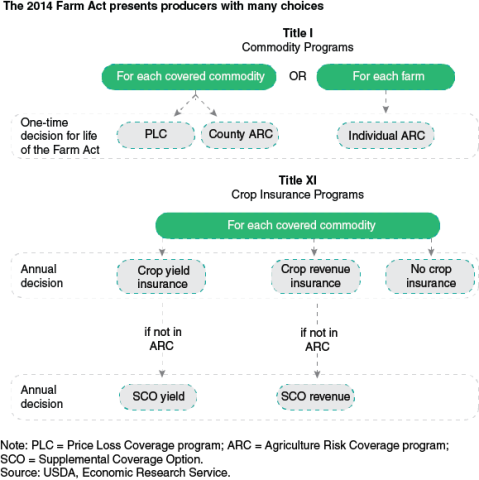
Each of the new programs affects producers’ agricultural risk exposure in different ways, and the programs interact with each other and with FCI. Producers can elect to enroll a crop on their farm in either ARC or PLC, but not both. If the producer elects ARC for a particular crop, that producer cannot enroll that same crop in an SCO policy. However, if a producer elects PLC, he or she remains eligible to enroll in SCO. The election of either ARC or PLC, once made, cannot be changed for the duration of the 2014 Farm Act. In contrast, SCO must be purchased each year as part of a producer’s crop insurance decision.
Image
In general, ARC provides either individual or area-based revenue protection without requiring a premium. The area-based revenue protection is administered per crop, while the individual revenue protection is administered for the whole farm. The program guarantee depends on the expected revenue, which is calculated using historic prices and yields. Benefits accrue to the producer when actual revenues fall below 86 percent of expected revenues and cover losses of up to 10 percent of the total expected revenue. For ARC, expected revenue is defined as the 5-year Olympic average (the average with the highest and lowest values removed) of historic yields multiplied by the 5-year Olympic average of historic prices. (For the remainder of this article, the term “ARC” refers to the version of ARC with the greatest enrollment—ARC-County—the area-based version of the commodity program.)
SCO provides area-based revenue protection as part of the crop insurance program. Producers pay a subsidized premium equivalent to 35 percent of the expected losses. In contrast to the ARC guarantee, the SCO guarantee depends on futures prices at planting time and on expected yields. The producer purchases SCO to supplement a crop insurance policy already in place, and SCO takes the traits of the underlying policy. For example, if the underlying policy is a yield policy, SCO also covers yields; if the underlying policy is a revenue policy, SCO becomes a revenue-based supplemental policy. For this article, SCO is assumed to be an underlying Revenue Protection (RP) policy with 75 percent coverage, one of the most popular crop insurance policies purchased by producers. One of the features that SCO adopts from an underlying RP policy is upside price protection—if the actual harvest price is higher than the expected price at planting time (the futures price at planting), the actual harvest price is used to determine program benefits. As with the ARC program, producers receive benefits when realized revenues fall below 86 percent of expected revenues but exceed the level of insurance selected by the producer for the underlying policy.
PLC works in much the same fashion as the CCP, the program it replaced. PLC provides a price floor for producers to help mitigate downside price risk. New reference prices were established for the 2014 Farm Act.
Although the ARC program and the SCO policy are both area-based (for the purposes of this article) revenue products, and both have benefits that accrue to producers when actual revenues drop below 86 percent of expected revenues, the programs operate in different ways. The primary source of the differences lies in how the revenue guarantees are generated. Because producers are locked into either the ARC or PLC once a choice has been made, and because prices change over time, the timing of when producers must elect these different programs can play a large role in the relative adoption rates of the programs.
What Do Program Payments Look Like?
The program benefits received by producers depend on prices, yields, and the combination of enrolled programs. A fictional soybean producer from Linn County, IA, whose yields are identical to the average yields observed in the county in 2014 will be used to provide examples of program benefits. The table below shows the 2014 yields and prices that make up the expected revenues, guarantees, and maximum payments for the ARC and SCO programs. Note that in the table the expected price at planting time is used for the expected revenue for SCO. If the expected price at harvest time is higher than the price at planting time, the expected revenue, guarantee, and maximum price for SCO will all be higher than the value in the table.
| Price item | ARC: Olympic average yield (50 bu/acre) |
ARC: Olympic average price ($12.27/bu) |
SCO: Expected yield (50 bu/acre) |
SCO: Expected price ($11.36/bu at time of planting) |
|---|---|---|---|---|
| Expected revenue: yield × price ($/acre) | 613.50 | 613.50 | 568.00 | 568.00 |
| Guarantee: 86% of expected revenue ($/acre) | 527.50 | 527.50 | 488.50 | 488.50 |
| Maximum payment ($/acre) | 52.00 | 52.00 | 62.50 | 62.50 |
| ARC = Agriculture Risk Coverage program. SCO = Supplemental Coverage Option. bu = bushel. Source: USDA, Economic Research Service using data from USDA, National Agricultural Statistics Service and Chicago Board of Trade. |
||||
The maximum payment for ARC is less than the maximum payment for SCO in the table because ARC pays on 85 percent of base acres and is capped at 10 percent of expected revenue, so the maximum payment for ARC is $52 per acre. The maximum payment for SCO in this example is the difference between 86 percent and 75 percent (the underlying policy’s coverage) multiplied by the expected revenue for SCO, $62.50 per acre. Therefore, SCO has a higher maximum payment than ARC despite the expected revenue for ARC being higher.
Historical Prices
The benefits a producer receives from the two programs depend on how the guarantees are generated for each program. While SCO insures against drops in revenue within a particular crop year—comparing realized revenues to the expected revenues at planting time—ARC insures against longer term drops in revenue, using historical prices and yields. This difference means that, while the SCO policy uses past yields, it has no “memory” of past prices, meaning that past prices are not used to determine the benefit guarantee. On the other hand, the ARC program uses both past prices and yields to generate the ARC guarantee.
The benefits producers receive from the ARC program change over time as more recent prices replace older ones. The higher the historic prices, the higher the ARC guarantee, and the higher the potential benefits for producers. ERS researchers found that, when historic prices are higher than the current expected price, the ARC program tends to provide larger benefits than SCO and provides benefits over a wider range of realized yields. When current prices are lower than historic prices, ARC also tends to provide higher maximum levels of support. Conversely, ARC benefits tend to shrink when historic prices are lower than current prices. As a result, under a scenario with lower historic prices, SCO tends to provide higher benefits to producers.
How Do ARC and SCO Affect Producer Revenues?
While the ARC program and SCO policy target only a small range of losses, they can help generate higher levels of income for producers and will help even when losses are large. Using historic patterns of prices and yields for each county growing soybeans in the United States, ERS researchers calculated the 2014 expected average total revenue per acre and estimated a range of possible outcomes for producers enrolling in different combinations of programs. The range of possible per-acre revenues is shown with a lower bound—representing the lowest value likely to be obtained, but not necessarily the lowest possible value—and an upper bound. The following table shows the expected average total revenue per acre and the ranges of revenue per acre without any commodity support programs and under different combinations of commodity support programs.
| Revenue | Average total revenue per acre ($/acre) | Estimated range of revenue per acre: Lower bound ($/acre) |
Estimated range of revenue per acre: Upper bound ($/acre) |
|
|---|---|---|---|---|
| Crop revenue | 498 | 151 | 910 | |
| Crop revenue + RP payments | 517 | 359 | 894 | |
| Crop revenue + RP + SCO + PLC | 533 | 362 | 895 | |
| Crop revenue + RP + ARC | 538 | 367 | 897 | |
| RP = Revenue Protection SCO = Supplemental Coverage Option PLC = Price Loss Coverage program ARC = Agriculture Risk Coverage program. Results across a representative producer in each U.S. soybean producing county, given 2014 expected prices and yields. With ARC and PLC, the results across counties are weighted by base acres, while SCO and RP are weighted by planted acres. Source: USDA, Economic Research Service simulations using data from the Chicago Board of Trade, USDA, National Agricultural Statistics Service, and USDA, Risk Management Agency. |
||||
The results in the table demonstrate the large effect that commodity programs can have on the expected revenue of soybean producers. If a producer does not enroll in any Government support programs, the producer will not receive any monetary protection from potential losses. As a result, the producer will be left with the lowest average crop revenue, which in this example comes to $498 per acre. Without any commodity support, the producer also has a much wider range of possible revenues. The upper bound of revenue with no commodity support is slightly higher than the upper bound of revenue with commodity support because the producer with no commodity support is not paying the premium for RP or SCO. However, the lower bound of soybean revenue without RP is approximately $200 lower per acre than the lower bound of revenue including RP. The reason for this stark contrast in lower bounds is that RP with 75 percent coverage guarantees that the soybean producer will receive 75 percent of expected revenue minus the farmer-paid premium. Under the 2014 prices for soybeans, ARC provides a higher average payout than SCO plus PLC.
Expected Prices Matter, Too
Programs available to farmers, such as ARC, RP, and SCO, help reduce the risk of falling revenues faced by farmers. The lowest revenue a producer can achieve when not enrolled in any program is $0/acre—which would signify a total crop loss. If a producer has an expected revenue of $600 per acre, enrollment in an RP policy with a 75-percent coverage level would cause the lower bound to jump from $0/acre to $450/acre (75 percent of $600/acre), even if the producer realizes a total crop loss.
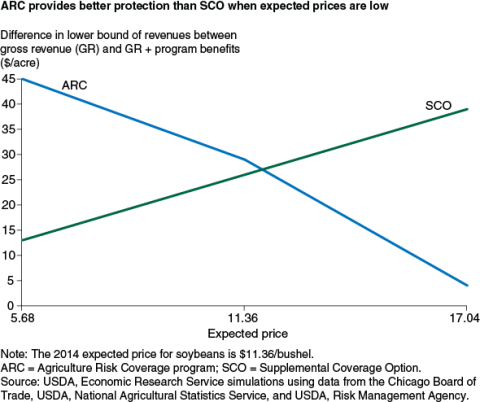
One way to compare different programs is by measuring the extent to which each program affects the expected lower bound of the range of reasonable revenues. When calculating the revenues for various combinations of programs a producer could enroll in, ERS researchers compared the lower bound of a farmer not enrolling in any program with the lower bound of a farmer enrolling in either ARC or SCO. ERS researchers generated these ranges of potential revenue outcomes using several different expected price scenarios. The expected prices mattered significantly to the outcome. (When generating the price and yield outcomes, the expected prices were assumed to be, on average, close to the realized prices.) Results show that with low expected prices, ARC provided much greater risk protection than SCO; SCO provided greater risk protection when expected prices were high.
Image
Putting It All Together
The one-time decision to elect ARC or PLC had to be made before the end of the first week of April 2015. At the end of the election period, 96 percent of soybean farmers, 91 percent of corn farmers, and 66 percent of wheat farmers had elected ARC. In contrast, fewer than 2 percent of the 1.5 million RP policies sold to farmers had an SCO policy associated with them. Clearly, ARC was the farmer favorite.
At the time that farmers had to make their decisions, prices and yields—both historic and expected—converged to produce a scenario that likely pushed producers to strongly favor ARC. In early 2015, historic revenues (resulting from prices and yields) were near all-time highs, while expectations of future commodity prices were dropping quickly. Given that these conditions favor the selection of ARC, they likely caused producers to elect ARC during the signup period in early 2015. However, this occurrence does not mean that producers will always prefer ARC—the programs perform in fundamentally different ways and are each uniquely suited to different environments. If producers were allowed to re-enroll in these programs during a period of time when historic prices are low and expected prices are high, farmers would likely prefer SCO over ARC.
This article is drawn from:
- O'Donoghue, E., Hungerford, A., Cooper, J., Worth , T. & Ash, M. (2016). The 2014 Farm Act Agriculture Risk Coverage, Price Loss Coverage, and Supplemental Coverage Option Programs' Effects on Crop Revenue. U.S. Department of Agriculture, Economic Research Service. ERR-204.
You may also like:
- Ifft, J., Kuethe, T. & Morehart, M. (2015, October 5). Federal Crop Insurance Is Associated With Higher Levels of Short-Term Farm Debt. Amber Waves, U.S. Department of Agriculture, Economic Research Service.
- Farm & Commodity Policy. (n.d.). U.S. Department of Agriculture, Economic Research Service.
- Risk Management. (n.d.). U.S. Department of Agriculture, Economic Research Service.