Many U.S. School Districts Serve Local Foods
- by Katherine Ralston and Matthew Benson
- 3/2/2015
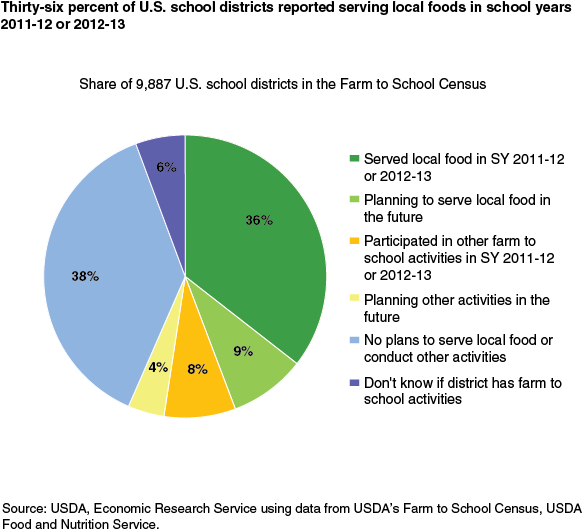
The Healthy Hunger-Free Kids Act of 2010 established the USDA Farm to School Program to encourage school districts to use locally produced food for meals served through the National School Lunch and School Breakfast Programs. USDA’s Food and Nutrition Service (FNS)—the agency responsible for administering school meal programs—partnered with ERS to conduct USDA’s Farm to School Census, the first attempt to ask every public school district in the United States about their involvement in farm to school activities and how much locally produced food they served in school meals. Schools reported how they defined “local foods,” with two common definitions being foods produced within 50 miles or within the State. According to the census, 36 percent of U.S. school districts reported serving locally produced food in school meal programs during the 2011-12 or 2012-13 school years and an additional 9 percent planned to serve local foods in the future.
Many school districts serving locally produced foods also participate in other farm to school activities such as Harvest of the Month promotions, taste tests of local foods, onsite edible gardens, and field trips to farms. These activities are intended to strengthen students’ understanding of where food comes from and pique students’ interest in trying new foods. Some districts implement these activities to build interest in local foods before deciding to serve them in the lunchroom. Of the 9,887 school districts (75 percent of the over 13,000 U.S. public school districts) that completed the Farm to School Census questionnaire, 8 percent reported conducting farm to school activities other than serving local foods during school years 2011-12 or 2012-13 and another 4 percent planned to start such activities in the future.
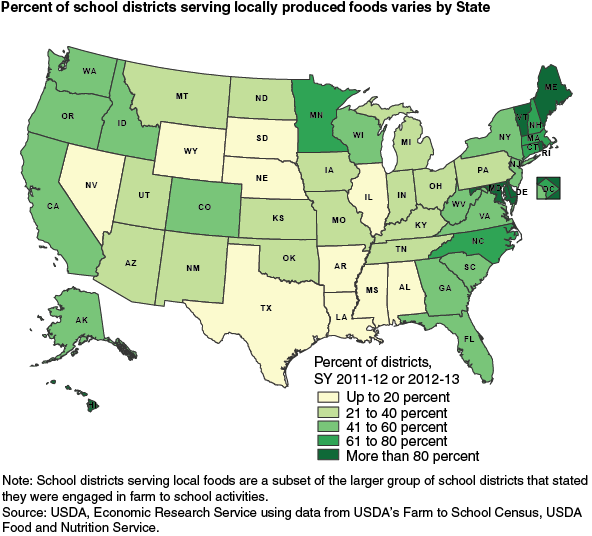
The share of a State’s school districts that served local foods in school meals during the 2011-12 or 2012-13 school years varied. In a handful of States (Rhode Island, Maryland, Delaware, Vermont, Maine, and Hawaii), more than 80 percent of school districts that completed the questionnaire served some local foods. In 10 other States, 20 percent or fewer districts reported serving local foods.
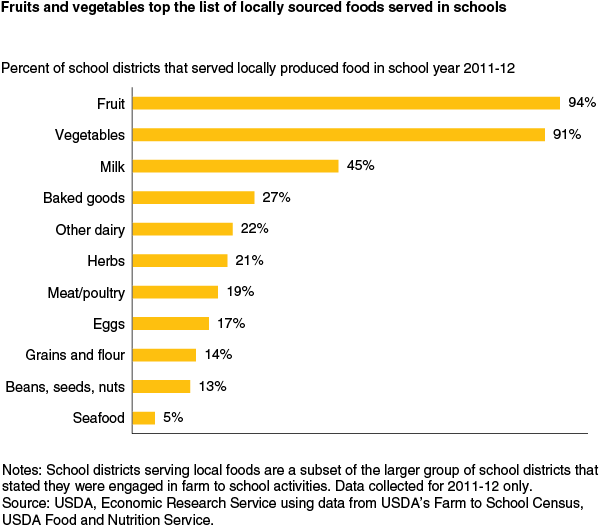
The top food categories sourced locally were fruits and vegetables, cited by 94 and 91 percent, respectively, of the school districts that served local foods. Milk (45 percent), baked goods (27 percent), and other types of dairy products (22 percent) were also among the top food categories sourced locally. For districts that were able to provide food service expenditure data, local foods represented an average of 13 percent of reported expenditures on food.
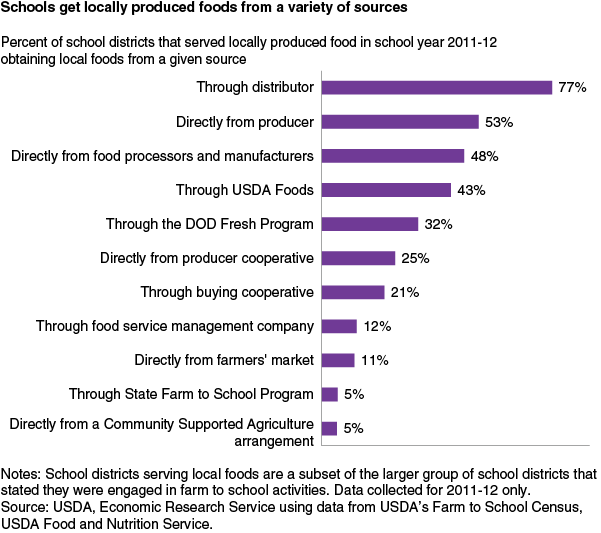
More than three-quarters of school districts serving local foods purchased them through a distributor. More than half (53 percent) obtained food directly from farmers and other producers and 48 percent from food processors and manufacturers. Some States have State-produced foods, such as fruits and vegetables, grains, meats, and dairy products, included in the products donated by USDA for use in school meals (a program called USDA Foods). The DOD Fresh Program, used by 32 percent of school districts serving local foods, allows districts to use USDA funds to obtain fresh fruits and vegetables through the U.S. Department of Defense, which provides information to districts on foods that are sourced locally.
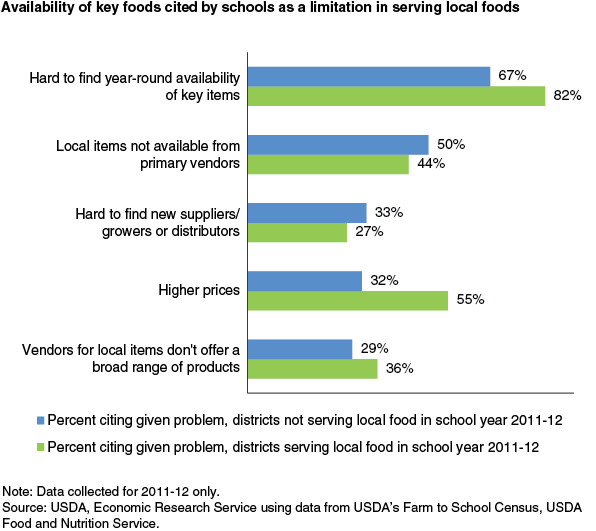
Respondents—from districts that served local foods as well as those that did not—were also asked to indicate problems encountered in procuring locally produced food. The top problem cited by both groups was the lack of year-round availability of key items, cited by 82 percent of districts serving local foods and 67 percent of those not serving local foods. Other top difficulties for school districts serving local foods were high prices (55 percent) and lack of availability of local foods from primary vendors (44 percent).
The USDA Farm to School Census shows a higher prevalence of schools serving local foods than previous national sample surveys, likely reflecting growing interest among school districts. Future analysis will aim to identify characteristics of school districts more likely to serve local food or more likely to experience particular obstacles.
This article is drawn from:
- Low, S.A., Adalja, A., Beaulieu, E., Key, N., Martinez, S., Melton, A., Perez, A., Ralston, K., Stewart, H., Suttles, S., Vogel, S. & Jablonski, B.B.R. (2015). Trends in U.S. Local and Regional Food Systems: A Report to Congress. U.S. Department of Agriculture, Economic Research Service. AP-068.
- The Farm to School Census. (2015). U.S. Department of Agriculture, Food and Nutrition Service.


