Foundation Giving to Rural Areas in the United States Is Disproportionately Low
- by John Pender
- 8/3/2015
U.S. foundations—non-governmental entities established as nonprofit corporations or charitable trusts for the principal purpose of making grants to unrelated organizations or individuals for scientific, educational, cultural, religious, or other charitable purposes—are an important source of funds for public needs in the United States and abroad, providing more than $45 billion in grants in 2010. Although this represents a small share of total annual contributions to U.S. nonprofit organizations, foundations may have an outsized impact because of their relative independence from political and market pressures.
ERS researchers used domestic grant data from the Foundation Center and other data from the National Center for Charitable Statistics, the U.S. Census Bureau, and the Economic Research Service, to estimate the trends and geographic patterns of foundation grants and to investigate correlations of those grants with geographic, demographic, and socioeconomic factors. Most of the analysis used Foundation Center data on grants of at least $10,000 by the largest 1,200 to 1,400 foundations during 2005 to 2010 (the number of foundations included in the Foundation Center grant data varies by year), which accounted for about half of the value of total U.S. foundation grants. The analysis was supplemented by Foundation Center data on an assortment of smaller grants and grants by smaller foundations.
Grantmaking Trends for Rural Areas from 2005 to 2010
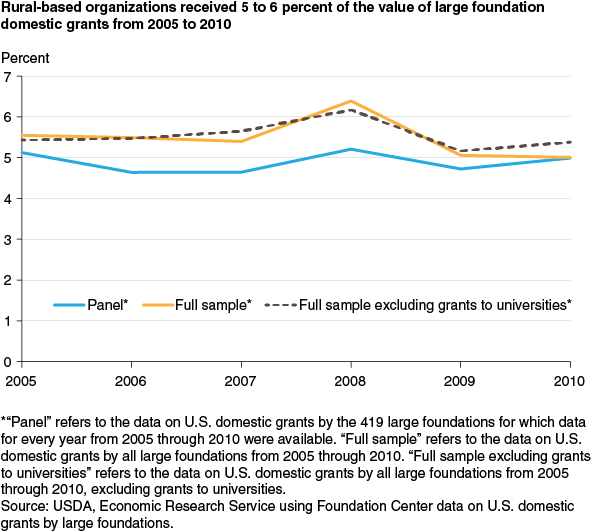
Grants to U.S. rural-based organizations accounted for 5.5 percent of the real value of domestic grants by large foundations during 2005 to 2010, with a slight downward trend over that period. Using data on a variety of grants by smaller foundations, 7.5 percent of the value of these grants in 2005 and 7.0 percent in 2009 were to rural-based organizations. These estimates provide only a rough proxy for the share of foundation grants that benefited rural people, since some grants to urban-based organizations may benefit rural people and vice versa.
To better estimate the share of the total value of grants that primarily benefited rural residents, ERS researchers selected a random sample of 200 large foundation grants in 2010. Using publicly available information on these grants and their recipients and excluding grants that served both urban and rural people, the estimated share of the value of grants designed to produce rural benefits was 6.3 percent. Considering that the rural share of the U.S. population was 19 percent in 2010, all of these estimates suggest that rural areas are underserved by foundation grants.
County Variation in the Value of Foundation Grants
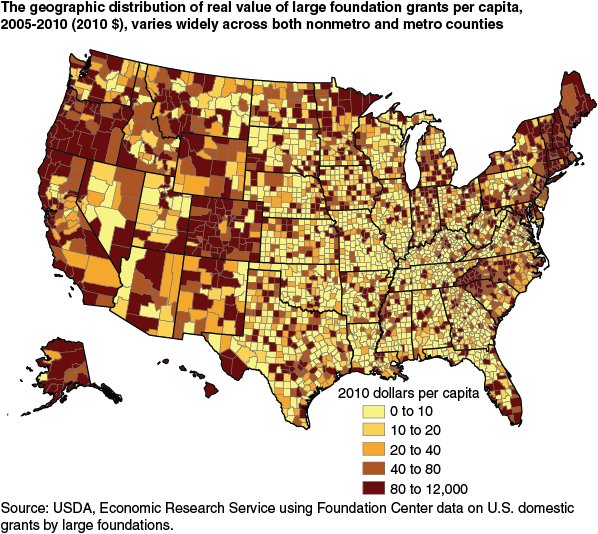
The average real value per person provided by large foundations’ grants to organizations based in nonmetro counties from 2005 to 2010 was about $88 per capita (in 2010 dollars)—less than half the average provided to organizations in metro counties. Grants for higher education, environmental concerns, and recreation and leisure make up a larger share of total grant value in rural areas than in urban areas, while grants for arts, culture and humanities, medical research, science and technology research institutions, and philanthropy account for a larger share of total grant value in urban areas. The greatest disparities are for higher education, which accounts for 26 percent of the value of grants to rural-based organizations but only 14 percent of the value of grants to urban-based organizations; and for arts, culture, and humanities, accounting for 14 percent of urban grant value but only 9 percent of rural grant value. Grants for other purposes than those enumerated in the table are also more common in urban areas, accounting for 6 percent of urban grant value but only 3 percent of rural grant value, likely reflecting the wider variety of nonprofit activities occurring in urban areas.
There are large geographic variations in the distribution of foundation grants across rural areas, with 18 percent of nonmetro counties having no grant recipients from 2005 to 2010 and some counties receiving more than $10,000 per person. Counties with a larger college-educated share of population or with more assets held by nonprofit organizations tend to receive more grant funds per person in both nonmetro and metro counties.
| Purpose | Rural organizations | Urban organizations |
|---|---|---|
| Arts, culture, & humanities | 9.46 | 14.46 |
| Community improvement/capacity building | 3.69 | 3.83 |
| Diseases, disorder, medical disabilities | 1.45 | 1.85 |
| Education | ||
|
Primary/secondary/vocational
|
7.60 | 8.95 |
|
Higher/graduate/professional
|
26.08 | 13.81 |
|
Other educational services
|
6.68 | 4.42 |
| Environmental quality, protection | 7.58 | 4.66 |
| Food, agriculture, and nutrition | 1.04 | 0.97 |
| Health – general & rehabilitative | 9.04 | 10.45 |
| Housing, shelter | 2.00 | 1.75 |
| Human services | 7.33 | 6.96 |
| Medical research | 0.55 | 3.68 |
| Mental health, crisis intervention | 1.49 | 1.27 |
| Recreation, sports, leisure | 3.80 | 1.73 |
| Philanthropy, voluntarism | 1.01 | 4.90 |
| Public affairs and society | 2.08 | 2.42 |
| Religion, spiritual development | 2.57 | 2.18 |
| Science/technology research institutions | 1.81 | 3.32 |
| Youth development | 1.95 | 2.10 |
| Other | 2.79 | 6.29 |
| Total percentage of real value of grants | 100.00 | 100.00 |
| Total value of grants (2010 $) | $5.45 billion | $93.40 billion |
| Source: USDA, Economic Research Service using Foundation Center data on U.S. domestic grants by large foundations. | ||
This article is drawn from:
- Pender, J. (2015). Foundation Grants to Rural Areas from 2005 to 2010: Trends and Patterns. U.S. Department of Agriculture, Economic Research Service. EIB-141.
We’d welcome your feedback!
Would you be willing to answer a few quick questions about your experience?


