
Agricultural Energy Use and the Proposed Clean Power Plan
- by Shellye Suttles
- 9/8/2014
In June 2014, the Environmental Protection Agency (EPA) proposed new guidelines to reduce carbon pollution from electric generating facilities. The EPA’s Clean Power Plan aims to cut greenhouse gas (GHG) emissions from fossil fuel-fired power plants, the largest source of carbon pollution in the United States, by 30 percent from 2005 levels by 2030. The proposal also aims to cut smog and soot by 25 percent. The plan sets State-specific carbon emission reduction goals and includes guidelines for States to follow in developing regional emissions reduction plans that factor in each State’s mix of fuels for generating electricity. By encouraging the use of relatively clean energy sources in place of fuel with higher levels of GHG emissions, such as coal, the Clean Power Plan is expected to increase the average cost of electricity generation.
To better understand how the agricultural sector might be affected by the Clean Power Plan or similar efforts involving electricity generation, ERS researchers examined the sector’s current direct use of electric power, as well as the sector’s direct and indirect use of natural gas—the primary fuel source of relatively clean electricity in most of the country. While the main target of the EPA plan is coal-fired electricity generation, natural gas is the second largest source of electric power in the United States after coal, and natural gas is also the largest cost in manufacturing commercial fertilizer used to grow crops. The primary data source is the 2012 Agricultural Resource Management Survey (ARMS), jointly conducted by USDA, ERS and National Agricultural Statistics Service, with supporting statistics from U.S. Energy Information Administration (EIA) and previous literature on the subject.
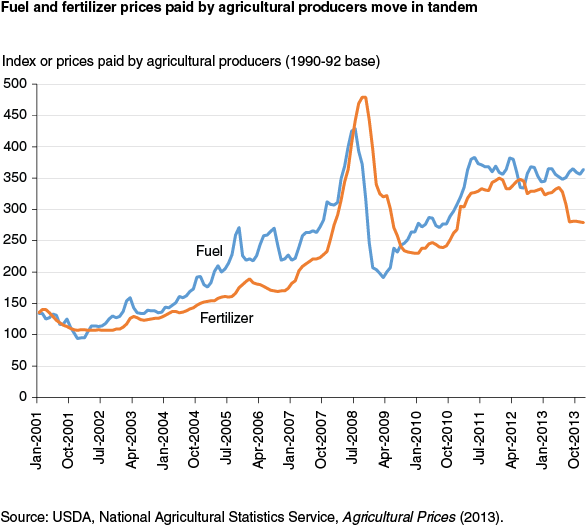
Prices. In the last decade, commercial electricity prices have seen modest increases. For instance, according to the EIA, between 2004 and 2014, the cost of commercial electricity (including taxes) increased 2 cents per kilowatt hour in real terms. On the other hand, improved extraction technologies (e.g. hydraulic fracturing) have increased the supply of natural gas in recent years, lowering its price since 2009. As a principal input in manufacturing nitrogen fertilizer, the main nutrient applied to field crops in the United States, changes in natural gas prices have a direct effect on the price of commercial fertilizer. In its regulatory impact analysis of the Clean Power Plan, the EPA projects that 4.6 percent of current electricity generation may be removed from operation by 2020 due to the reduction in coal-fired power plants. In order to meet increasing demand for electric power, power plants are projected to increase their use of natural gas, pushing natural gas prices up by an estimated 11.5 percent by 2020. Overall, average retail electricity prices are projected to increase by up to 6.5 percent by 2020.
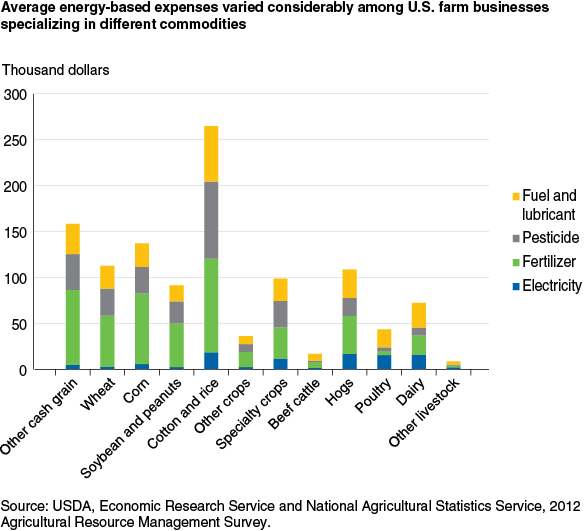
Electricity. Since 2001, electricity use by U.S. farms has remained fairly constant. According to ARMS, electricity use accounted for just 2 percent of farm businesses’ total operator expenses in 2012. Electricity is often used for heating and cooling in livestock production and for operating irrigation pumps in crop production. Among livestock producers, poultry production has the highest share of electricity expenses at nearly 5 percent, while hog production has the highest average electricity expense ($16,936). In crop production, cotton and rice producers averaged $18,646 in electricity expenses, primarily for irrigation, which accounted for nearly 3 percent of total cash expenses. After cotton and rice production, specialty crop production had the second highest average electricity expense ($11,814) among crop producers, due to the use of irrigated water and greenhouse heating. In all of its forms, the average operator expense devoted to energy and energy-intensive purchases varies considerably by farm commodity specialization.
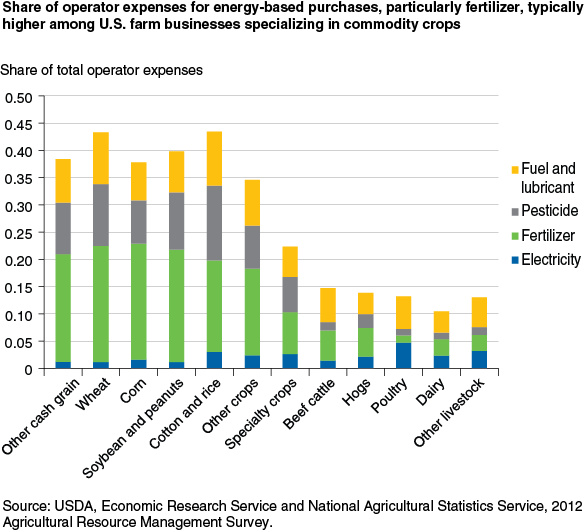
Natural Gas & Fertilizer. In recent years, natural gas has become a growing source of electric power according to the EIA. In 2004, coal accounted for 50 percent of U.S. electric power generation while natural gas accounted for 18 percent of production. By 2013, total electric power generation had increased by only 2 percent, but natural gas as a source of electric power had increased to 27 percent of electric power production while coal had decreased to 39 percent of production. The Clean Energy Plan would continue the shift toward natural gas-fueled electricity generation. Based on the 2012 ARMS, direct consumption of natural gas by agricultural producers is small compared to other energy inputs. However, natural gas may represent up to 80 percent of the cost of manufacturing fertilizer, particularly nitrogen fertilizer. Since fertilizer expenditures accounted for over 11 percent of total operator expenses among farm businesses in 2012, the farm sector is a major indirect consumer of natural gas and would therefore feel the effects of higher natural gas prices, in the form of higher fertilizer prices, as demand for natural gas to fuel electric power plants increases. Although it is important to note that in fertilizer year 2011, more than 50 percent of nitrogen and 85 percent of potash supply in the United States was from imports, particularly from Canada and Trinidad and Tobago.
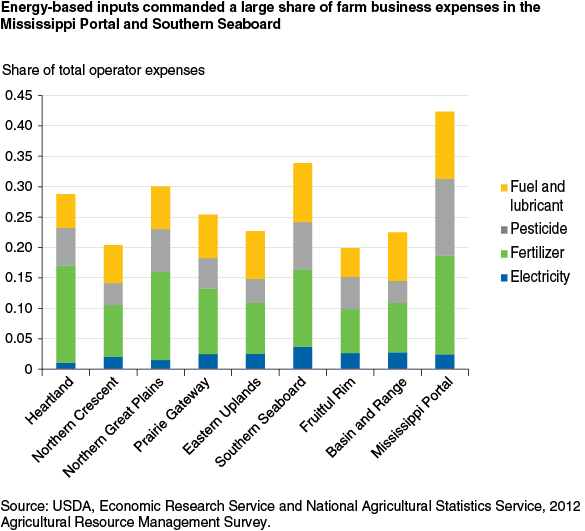
While energy-related expenses vary regionally, partially due to disparities in energy prices, a larger source of regional variation is the difference in types of agricultural commodities grown and the use of energy-intensive farming practices such as irrigation with groundwater. The Southern Seaboard has the highest share of expenditures on electricity, while the Heartland and the Mississippi Portal have the highest share of fertilizer expenses among all U.S. regions. Previous research suggests that the Mississippi Portal region may be considerably affected by higher energy costs due to the prevalence of fertilizer-intensive crops like cotton.
Average energy-related expenses tend to be related with the level of farm production, with larger farms using more energy than smaller farms, other things being equal. However, the share of operator expenses devoted to energy-related purchases does not follow the same pattern; small farm businesses have the highest share of expenditures on electricity and fuel, while medium-sized farm businesses have the highest share of expenditures on fertilizers and pesticides. Overall, large farm businesses have the lowest proportion of energy-based expenses, since large farms typically have higher expenses for labor than smaller farms, reducing energy’s share of total expenses.

Changes in Production Practices. EPA regulatory impact analysis projects increases in both electricity and natural gas prices as a result of the Clean Power Plan. While higher energy prices will affect farm operations, the farm sector has dealt with increasing energy prices for several decades. Previous research has found that farm operations adapt to higher energy (and fertilizer) prices by shifting to more energy-efficient production practices and input use, such as conservation tillage and variable-rate input application. In some cases, higher production costs due to increased energy prices lower net producer returns, and farmers respond by reducing overall production. In other cases, farmers respond to higher energy prices by finding other ways of reducing or otherwise offsetting their energy purchases. For example, the number of farm operations producing on-farm renewable energy doubled between 2008 and 2011. As of 2012, there were over 57,000 U.S. farms producing on-farm renewable energy, using solar panels, methane digesters, wind turbines, etc. If electricity prices increase in the future, more farms may find on-farm power generation profitable.
This article is drawn from:
- Beckman, J., Borchers, A. & Jones, C. (2013). Agriculture's Supply and Demand for Energy and Energy Products. U.S. Department of Agriculture, Economic Research Service. EIB-112.
- Electric Power Monthly. (2014). U.S. Energy Information Administration.
You may also like:
- Sands, R., Westcott, P., Price, M., Beckman, J., Leibtag, E., Lucier, G., McBride, W.D., McGranahan, D., Morehart, M., Roeger, E., Schaible, G. & Wojan, T. (2011). Impacts of Higher Energy Prices on Agriculture and Rural Economies. U.S. Department of Agriculture, Economic Research Service. ERR-123.
- Carbon Pollution Emission Guidelines for Existing Stationary Sources: Electric Utility Generating Units (Proposed Rule). (2014). Vol. EPA-HQ-OAR-2013-0602 (pp. 34829-34958), U.S. Environmental Protection Agency.
- Regulatory Impact Analysis for the Proposed Carbon Pollution Guidelines for Existing Power Plants and Emission Standards for Modified and Reconstructed Power Plants. (2014). Vol. EPA -542/R-14-002. U.S. Environmental Protection Agency.