
Additionality in Agricultural Conservation Programs
- by Roger Claassen and Eric Duquette
- 9/8/2014
Highlights
- Additionality measures the extent to which conservation program payments actually encourage adoption of practices that farmers would not otherwise adopt.
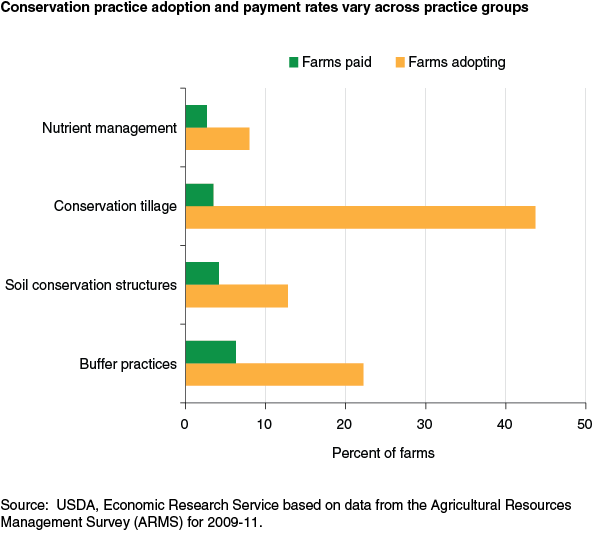
- Estimates of additionality are high for some practices, particularly installation of soil conservation structures (e.g., terraces) and buffers (e.g., field-edge filter strips), but not as high for others (e.g., conservation tillage).
- Considering additionality in conservation program design could help make programs more cost effective, but only if additionality is considered along with potential environmental benefits and costs.
Voluntary conservation payment programs are the cornerstone of U.S. agricultural conservation policy. Under the Agricultural Act of 2014, Congress provided an estimated $28 billion in mandatory 2014-18 funding for USDA conservation programs that encourage the adoption of conservation practices. Many States also have their own conservation programs. These programs can support a wide range of practices addressing environmental issues such as soil quality, water quality, air quality, and wildlife habitat loss and degradation.
What are taxpayers getting for their money? The answer entails, in part, knowing whether the practices supported with payments result in additional conservation efforts on the part of the payment recipients. Additionality occurs when a conservation payment causes a change in conservation practice use, agricultural input use, or land use (referred to collectively as “conservation practices”) that leads to a change in environmental quality. In practice, quantifying and measuring changes in environmental quality can be difficult. This article considers a measure of additionality in which any practices supported by payments can be considered “additional” if they would not have been adopted without the payment.
Support for conservation practices that are not additional—practices that would have been adopted even without a payment—depletes program resources without increasing environmental gain beyond what would have been realized without the payment. Because all USDA conservation programs are limited by budget or acreage caps, payments for nonadditional practices reduce the number of additional practices that can be funded and the level of environmental gain that can be leveraged with program funds.
Additionality in Program Design
Conservation payments are not the only reason farmers adopt conservation practices. Many of the practices that can be supported by USDA programs provide onfarm benefits to farmers that offset at least part of the cost of adopting the practice. Conservation tillage, for example, can require improved planting equipment, make weed control more difficult, and may reduce crop yields, but it is also likely to reduce the cost of labor, fuel, and tillage machinery. A critical consideration is whether the onfarm benefits exceed the costs of adopting the practice. When they do, farmers have an incentive to adopt the practice without government support.
But determining which individual farmers would and would not adopt practices without payments is not straightforward. The benefits and costs of conservation practice adoption vary across farms and across time due to differences in climate, soils, topography, farmer management skills, concern about environmental quality, and other factors. Farmers who have not yet adopted a practice may change their view of its merits once it has been used successfully by others or as the technology behind the practice evolves and improves. While some of these differentiating factors can be observed, farmers who are similar in many ways may still come to very different conclusions about the benefits and costs of adopting a specific conservation practice at a given point in time. When available, farm-specific information on past practices can be a helpful, but not necessarily reliable, predictor of future practices.
Most conservation practices have been adopted by at least some farms without the benefit of a conservation payment, indicating that adoption benefits exceed costs for at least some producers. This suggests that some level of nonadditionality is likely when conservation practice adoption is supported through voluntary payment programs. While full additionality is probably not a realistic policy goal, there may be conservation program design features that could help minimize nonadditionality. In any case, measuring additionality is the first step in managing it.
Measuring Additionality
Once a payment has been received and the required changes in farming practices have been made, it is no longer possible to directly observe what a farmer would have done without the payment. To estimate the behavior of farmers, ERS researchers “matched” farms that received payments (payment farms) with a group of farms that did not receive payments (nonpayment farms) but are in many other ways similar to the payment farms. While the information garnered from any single match is subject to error, comparing the behavior of many matched farms enabled researchers to estimate the differences between decisions made by payment and nonpayment farms. Farmers (and farms) that are similar are assumed to make similar decisions about production and conservation practices. Statistical matching has been used extensively to evaluate the effectiveness of many government programs.
Researchers used a matching model to estimate additionality for a small number of practices that are frequently supported through conservation programs. Because USDA programs can support dozens of practices and offer different types of payments for different types of practices, it is not feasible to assess additionality in terms of entire programs. Rather, the analysis considers two general classes of conservation practices and the payments used to support them.
Structural practices often involve excavation and land shaping (e.g., terraces, grass waterways) and sometimes take land out of production (e.g., grass waterways, field-edge filter strips). Since the 1930s, these practices have been supported by conservation cost-sharing, which reimburses farmers for a portion of actual practice installation costs. This analysis considers two groups of widely used structural practices:
- Soil conservation structures (terraces, grade stabilization, and water and sediment basins) protect soil productivity and reduce sediment damage by reducing soil erosion during rainstorms.
- Buffer practices (field-edge filter strips, riparian buffers, field borders, and grass waterways) intercept sediment, nutrients, and pesticides before they leave the field.
Management practices involve changing the methods used to plant or fertilize crops, manage livestock grazing, use irrigation water, etc. Common management practices include conservation tillage, nutrient management, and rotational grazing. In the programs considered here, incentive payments support the adoption of two management practices by helping cover the costs of transitioning to new methods:
- Conservation tillage includes mulch-till (30 percent or greater residue cover at planting), ridge-till, strip-till, and no-till practices.
- Nutrient management includes comprehensive nutrient management and manure management (which involves land application of manure). Nutrient management is actually a collection of practices (e.g., nutrient application rate, method, and timing) that form a nutrient management plan and are implemented as a group.
Data on practice use and payments are from the crop-specific, field-level portion of USDA’s Agricultural Resources Management Survey (ARMS) for 2009 (wheat), 2010 (corn), and 2011 (barley and sorghum). Respondents were asked which practices were in use on the surveyed field, when they were first installed or used, whether a payment was received in conjunction with the practice, and what program the payment came from. The program choices were (1) the Environmental Quality Incentives Program (EQIP), (2) Conservation Security Program/Conservation Stewardship Program (CSP), (3) Conservation Reserve Program continuous signup (CRP), or (4) other Federal, State, and local programs. Not every program was considered for every practice group.
| Practice group | Practices | Programs1,2 | ARMS Surveys3 |
|---|---|---|---|
| Buffer practices | Field-edge filter strips, grass waterways, field borders, riparian buffers | EQIP, CRP, other | Wheat, 2009 Corn, 2010 |
| Soil conservation structures | Terraces, grade stabilization structures, and water and sediment basins | EQIP, other | Wheat, 2009 Corn, 2010 |
| Conservation tillage | No-till, strip-till, mulch-till, ridge-till | EQIP, other | Corn, 2010 Barley, 2011 Sorghum, 2011 |
| Nutrient and manure management4 | Comprehensive nutrient management, manure management | EQIP, other | Wheat, 2009 Corn, 2010 Barley, 2011 Sorghum, 2011 |
| 1Conservation Reserve Program (CRP) payments are considered only with the buffer practice group because CRP does not support practices in the other practice groups. EQIP stands for the Environmental Quality Incentives Program. 2Farms that received Conservation Security Program (CSP; 2004-08) or Conservation Stewardship Program (CStP; 2009-present) payments are excluded entirely because a portion of these payments support stewardship (ongoing conservation efforts) rather than additional conservation. Moreover, enhancement payments—a large part of CSP—supported small changes to existing practices and, therefore, are not well matched to USDA’s Agricultural Resources Management Survey (ARMS) questions, which are based on full adoption of standard conservation practices. 3Data on practice adoption and payments are from USDA’s Agricultural Resources Management Survey (ARMS). Different surveys are used with different practice groups, depending on the practice and program participation questions in any given year. 4Excludes farms that are likely subject to regulation based on confined animal feeding operation. Nutrient management payments to these farms would not be additional, nor should they be matched to other farms that do not face regulation. Source: USDA, Economic Research Service based on data from the Agricultural Resources Management Survey (ARMS) for 2009-11. |
|||
Practices were grouped by function. For example, terraces, grade stabilization, and water and sediment basins are grouped because they are all structural practices typically used to reduce soil rainfall erosion on slopes. Producers were classified as “adopters” if they had adopted at least one practice in the group and “payment farms” if they had received a payment in conjunction with at least one practice in the group. Because survey questions vary from year to year, the information used to estimate additionality for each practice group also varies.
Additionality Is High for Some Practices
For structural practices, an estimated 80 percent of buffer practices and 82 percent of soil conservation structures supported by payments were additional—that is, they would not have occurred without the payment. High levels of additionality are not surprising. These practices require substantial upfront investment but often provide onfarm benefits that are intangible (e.g., buffers can enhance wildlife populations for hunting or viewing) or occur only in the distant future (e.g., preservation of soil depth and long-term soil productivity). Results suggest that while some farms have installed structural practices on their own, for many farmers, the onfarm benefits associated with these practices are not high enough, relative to costs, to encourage adoption without cost sharing. While some farms will adopt these practices without payments, most farms facing the high initial cost of these practices are unlikely to adopt them without financial support.
| Practice | Unit | Estimate with payment | Estimate without payment1 | Estimated additionality (standard error) |
|---|---|---|---|---|
| Soil conservation structures | Practice use (probability) | 1.00 | 0.18 | 0.82 (0.046) |
| Buffer practices | Practice use (probability) | 1.00 | 0.20 | 0.80 (0.030) |
| Conservation tillage | Practice use (probability) | 1.00 | 0.44 | 0.56 (0.070) |
| Nutrient and manure management | Practice use (probability) | 1.00 | 0.12 | 0.88 (0.051) |
| 1Estimated as the average rate of adoption for nonpayment farms that are similar to or “matched” with payment farms. Source: USDA, Economic Research Service based on data from the Agricultural Resources Management Survey (ARMS) for 2009-11. |
||||
For conservation tillage, additionality is measured as the share (or percentage) of payment farms (farms that received incentive payments at some time in the past) that would not have adopted the practice if the payment had not been received at some point. This “long run” view is taken because it is the outcome that USDA seeks to achieve with incentive payments. Note, however, that short-term practice adoption in response to incentive payments can provide additional environmental benefits, even if the practice is not continued when payments end.
An estimated 54 percent of incentive payments to farmers transitioning to conservation tillage for select crops in 2009-11 represents additional adoption of the practice. That is, almost half of those who received payments would have adopted conservation tillage without the payment. Because conservation tillage can reduce crop production costs and, under some conditions, maintain or even increase crop yields, many famers have adopted conservation tillage without receiving a payment.
Nutrient management is actually a collection of practices. Additionality is estimated in terms of (1) the existence of an overall nutrient management plan (for corn, wheat, barley, and sorghum) and (2) the effect of the nutrient management plan on nitrogen fertilizer application rates and application timing (for corn only). For the existence of nutrient management plans, the measure of additionality is the share of farmers receiving nutrient management payments who would not have a written nutrient management plan in the absence of a payment. For nitrogen application in corn, the measures of additionality are the difference in average application rate with and without nutrient management payments and the share of nitrogen fertilizer applied in the fall before planting and after planting when the crop is already growing.
An estimated 88 percent of farmers producing the crops examined in 2009-11 that received a payment for having a written nutrient management plan would not have such a plan in the absence of the nutrient management payment. Findings also reveal that nutrient management payments led to a large drop in fall application of nitrogen fertilizer for corn. Nitrogen applied in the fall before planting corn in the spring is vulnerable to runoff during the winter and early spring and thus contributes disproportionately to water quality problems. Farmers who received nutrient management payments applied only 1.2 percent of nitrogen fertilizer in the fall. If these farmers had not received payments, it is estimated that they would have applied 12.9 percent of nitrogen in the fall, a difference that is large and for which the statistical evidence is strong.
| Practice | Unit | Estimate with payment | Estimate without payment1 | Estimated additionality (standard error) |
|---|---|---|---|---|
| Nitrogen application rate | Pounds per acre | 94.6 | 115.6 | -21.0 (24.8) |
| Fall nitrogen application | Percent nitrogen applied in fall | 1.2 | 12.9 | -11.6 (5.90)2 |
| Post-plant nitrogen application | Percent nitrogen applied after planting) | 38.1 | 24.8 | 13.3 (14.0) |
| 1Estimated nitrogen application rate, percent of N applied in fall, or after planting for nonpayment farms that are similar to or “matched” with payment farms. 2Significantly different from zero with p<0.05. Source: USDA, Economic Research Service based on data from the Agricultural Resources Management Survey (ARMS) for 2009-11. |
||||
Results for additionality in other nutrient management practices are inconclusive. Corn farmers receiving payments during the period applied an average of 95 pounds of nitrogen per acre. If nutrient management payments had not been received, it is estimated that these farmers would have used an average of 116 pounds per acre. While the difference (21 pounds per acre) appears to be large, it is not precisely estimated and one cannot be confident that it is different from zero in a statistical sense. Likewise, farmers who received nutrient management payments during the period applied 38 percent of nitrogen after planting to help match nutrient application timing to that of the highest crop need. While ERS estimates that, in the absence of payments, these farmers would have applied only 25 percent after planting, the statistical evidence for the difference is not strong. That is, one cannot rule out that, on average, farmers receiving nutrient management payments actually applied the same amount of nitrogen fertilizer and the same proportion after planting that they would have done without receiving an incentive payment.
As already noted, farmers may decide to adopt a conservation practice (without a payment) because it has been profitably adopted by a neighbor. If that neighbor adopted the practice because of a conservation payment, the “demonstration effect” may increase the level of additionality associated with that payment. While it is likely that profitable practices will eventually be adopted, the demonstration effect may encourage local farmers who did not receive a payment to adopt the practice earlier than without the demonstration, increasing the level of environmental benefit associated with the payment. Unfortunately, the size of the demonstration effect cannot be estimated with current data resources.
Using Estimates To Improve Additionality
Information on additionality could be incorporated into existing conservation program design by adjusting conservation program benefit-cost indices to reflect the likelihood of additionality in the practices proposed by farmers in contract offers. Benefit-cost indices are used in all major USDA conservation programs to select program applications that yield large benefits relative to the cost of the contract in terms of budget resources. In general, farmers who propose practices that are expected to yield a relatively large benefit per dollar of contract cost (given the conservation treatment needs of the field and its location in the landscape) are more likely to receive conservation payments.
Most existing benefit-cost indices, however, implicitly assume full additionality. Given the potential for nonadditionality, indices will maximize environmental gain only if they focus on additional practices. Consider a simple example which, for ease of comparison, assumes away differences in climate, soil, topography, and landscape position. Suppose that conservation tillage (CT) can reduce soil erosion by 5 tons per acre per year and total transition incentive payments are $25 per acre. Given these assumptions, a budget of $10,000 could support CT payments on 400 acres, yielding an expected total soil erosion reduction of 2,000 tons per year. If only 50 percent of the CT practices supported with payments are expected to be additional, additional soil erosion reduction would be only 1,000 tons per year.
More expensive practices, which are also more likely to be additional, may be competitive with CT once additionality is taken into consideration. Consider a structural practice that would reduce erosion by 10 tons per acre and require roughly $70 per acre in cost sharing but has expected additionality of 80 percent. A budget of $10,000 would fund this practice on 143 acres yielding expected additional soil erosion reduction of 1,145 tons per year—a little more than for CT. Of course, if the cost-share on the structural practice was higher, expected additional soil erosion reduction would be lower and conservation tillage might still be the preferred practice despite relatively low additionality.
In the real world, these comparisons would be more complex because of variation in climate, soil, topography, and landscape position among farms. Cost effectiveness of practices may differ across locations depending on these same factors. Conservation tillage, especially no-till, may also have soil quality benefits that are not captured in the simplified example. Nonetheless, additionality estimates, especially if estimated in ways that reflect local conditions, could help improve program performance.
Conclusion
These estimates of additionality are among the first for U.S. conservation payment programs. Note, however, that the data underlying the analysis cannot support tests for regional difference in additionality and provide information on only a small number of practices, although they are widely used practices and are often supported by conservation programs.
Findings also suggest caution in using additionality estimates in program design. To make programs more cost effective, differences in additionality across practices must be weighed carefully along with potential differences in environmental benefits and costs. In the real world, where no two fields (and no two farmers) are exactly alike, adding additionality to the list of considerations in conservation program delivery will be a difficult task.
This article is drawn from:
- Claassen, R., Horowitz, J., Duquette, E. & Ueda, K. (2014). Additionality in U.S. Agricultural Conservation and Regulatory Offset Programs. U.S. Department of Agriculture, Economic Research Service. ERR-170.