Rural Employment in Recession and Recovery
- by Thomas Hertz, Lorin Kusmin, Alexander Marré and Timothy Parker
- 10/6/2014
Highlights
- The recession of 2007-09 affected all areas of the country, but some regions fared better than others, in part because of their more favorable industrial composition.
- Total employment loss rates during 2007-09 were slightly larger in rural (nonmetro) than urban (metro) counties and began a year earlier. Rural employment growth has lagged behind urban areas since the first half of 2011.
- About two-fifths of the rural employment growth deficit is due to rural counties having a lower population growth trend and an older, less well-educated workforce.
In December 2007, 6 years of economic growth ended as the U.S. economy entered the most severe recession since the Great Depression. In May 2014, 5 years after the official end of the recession, nonfarm employment reached its pre-recessionary peak level. However, the share of the adult population that was employed in May 2014 remains 4 percentage points below its pre-recessionary level, while 9.8 million people (or 6.3 percent of the U.S. workforce) remained unemployed, with 3.4 million having been out of work for more than 6 months.
Eighty-two percent of U.S. counties experienced employment losses between the fourth quarters of 2007 and 2009, but some areas fared better than others. States in the Great Plains experienced some of the lowest rates of employment loss during the recession and currently have some of the lowest unemployment rates in the Nation. Rural (nonmetro) counties as a whole experienced an earlier and slightly higher rate of decline in employment than urban (metro) areas during the recession, and rural employment growth has lagged well behind metro growth during the economic recovery. However, among nonmetro counties, the most rural areas fared better during the recession in terms of both rates of employment loss and changes in unemployment rates. After looking at nationwide trends in employment and unemployment during and after the 2007/09 recession, ERS researchers address a number of questions, including:
- What explains why unemployment rates rose by much smaller amounts during the recession in counties located in the Plains States than elsewhere?
- What explains the slow pace of employment growth in rural counties since the end of the recession?
- Why did the least densely populated rural counties, and those that were not adjacent to metro areas, generally experience the smallest rates of employment loss during the recession?
Consequences of the 2007-09 Recession: A National Overview
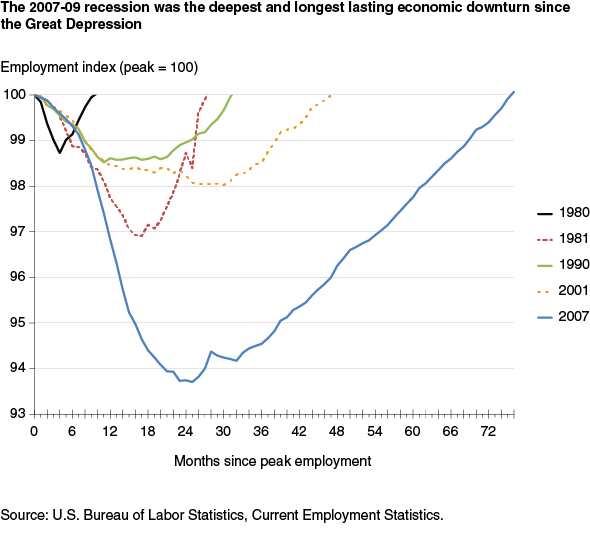
The last recession was the deepest and longest lasting since the Great Depression. Nonfarm employment fell by 6.3 percent (8.7 million) between its peak in January 2008 and its trough in February 2010. By comparison, peak-to-trough employment losses in the 1981 recession were half as large, at 3.1 percent.
Not only was the drop in employment more severe, but employment rebounded more slowly following the 2007/09 recession than following other economic recessions in recent history. Employment did not match its pre-recessionary peak level until May 2014, 5 years after the end of the recession and 6.5 years after its start. Rebound periods for the previous two recessions averaged less than half as long.
The slow rate of employment recovery is even more evident when considering the employment needs of a growing population. On the eve of the 2007-09 recession, 63 percent of all adults, and 80 percent of prime working-age adults (ages 25-54), were employed. By 2010, these ratios had both fallen by 5 percentage points, to levels not seen since 1983. Since then, the overall employment rate has risen by just 0.4 percentage points and the employed share of the prime working-age population has risen by only 1.4 percentage points. Thus, while total nonfarm employment now stands at its pre-recessionary level, employment rates for adults and prime working-age adults remained 3.9 and 3.3 percentage points below their pre-recessionary levels, respectively, as of May 2014.
The labor market consequences of the recession can also be illustrated by changes in the unemployment rate. While the peak unemployment rate during the most recent recession (10.0 percent) was lower than the peak during the 1981 recession (10.8 percent), the pace of subsequent improvement has been slower. Unemployment fell by 2.5 percentage points in the 12 months following its December 1982 peak, compared to a decline of just 0.5 percentage points in the 12 months after the October 2009 peak. As of May 2014, the U.S. unemployment rate stood at 6.3 percent, 3.7 percentage points below its peak, but still 1.7 points higher than in 2007.
Explaining regional differences in the effects of the recession
During the recession, unemployment rates rose fastest in the West, South, South Atlantic, and in parts of the Midwest. States most reliant on manufacturing—including Michigan, Rhode Island, South Carolina, and North Carolina—were hit especially hard. Many of the States with the smallest increases in unemployment were located in the Great Plains and had relatively high employment shares in agriculture, which was largely unaffected by the recession. Domestic demand for agricultural production is not highly sensitive to fluctuations in the business cycle, and agricultural prices were bolstered by demand for biofuel during the 2007/09 recession. Similarly, States in the West South Central region (which includes Oklahoma, Texas, Louisiana, and Arkansas) saw their unemployment rates held in check by growth in oil and gas drilling.
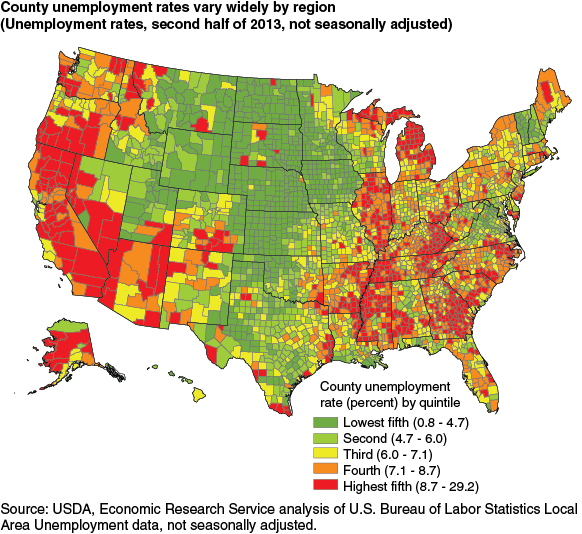
Since 2009, unemployment rates have fallen in all States, with large improvements in a few. In general, States that experienced the largest increases in unemployment rates during the recession have seen the largest reductions in unemployment rates during the recovery. Still, most of the hardest hit States continue to have above-average unemployment rates. As a result, the current geography of county unemployment rates still reflects the patterns established during the recession. Many of the counties with the lowest unemployment rates (below 4.7 percent) are located in or near the Great Plains. The highest unemployment-rate counties (above 8.7 percent) are concentrated in the West, South, and South Atlantic, as well as in Appalachia and parts of the Rust Belt.
To understand the origins of these regional differences, ERS economists selected all counties in five States (North and South Dakota, Nebraska, Montana, and Kansas) with the lowest unemployment and compared them to counties in the rest of the country, using statistical techniques to assess the impact of a variety of economic and social factors on the change in unemployment rates during the recession.
The most important source of the Plains States’ advantage was their favorable mix of industries at the start of the recession, which served to moderate the recession-induced increase in unemployment by an estimated 0.9 percentage points compared to counties in other States. In particular, Plains counties were far more likely to have farming- and energy-dependent economies, and this reduced their unemployment rates by 0.3 percentage points as compared to non-Plains counties. Equally important, however, were the Plains counties’ much lower shares of employment in the most rapidly contracting industries, especially manufacturing and professional services. Higher levels of educational attainment and lower population growth also contributed to limiting the increase in unemployment in the Plains States during the recession. This reflects the fact that rates of employment loss during the recession were lower for better educated workers and that slower population growth translated into fewer new labor force entrants seeking employment.
| Category | Change in unemployment rate (percentage points) |
|---|---|
| Average county change, Plains State | 1.9 |
| Average county change, rest of country | 4.9 |
| Total difference | -3.0 |
| Difference explained by differences in pre-recession attributes | -1.4 |
| Industrial Composition | -0.9 |
| Educational Composition | -0.3 |
| Age Distribution | -0.1 |
| Population Growth | -0.1 |
| Unexplained difference | -1.5 |
| Note: For purposes of this analysis, Plains States include North and South Dakota, Nebraska, Montana, and Kansas. Source: USDA, Economic Research Service analysis of data from Bureau of Labor Statistics, Local Area Unemployment Statistics. |
|
Why is rural employment growth lagging?
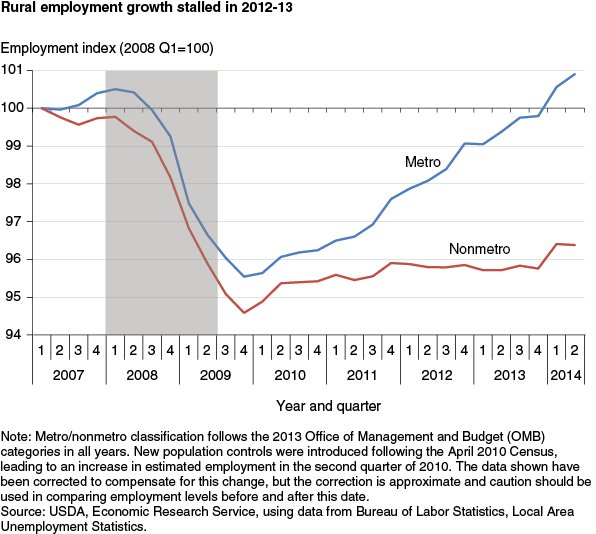
Employment of rural (nonmetro) residents peaked in the first quarter of 2007 and had begun to fall prior to the official start of the recession in December 2007. By the end of 2009, rural employment had fallen by 5.4 percent. In contrast, urban employment grew during 2007 and peaked in the first quarter of 2008, a full year after the rural employment peak. Urban employment then fell for the next 2 years, and was 5 percent below its peak by the end of 2009. Estimated employment losses as a proportion of their peak value were thus 0.4 percentage points larger in rural than in urban areas and began a year earlier.
Employment recovered over the course of 2010, growing at a comparable pace in metro and nonmetro counties, but nonmetro employment growth slowed in 2011 and fell to zero or slightly below thereafter. Total nonmetro employment was estimated at 20,165,000 in the 4th quarter of 2013, compared to 20,224,000 in the 4th quarter of 2011. As a result, the gap between the metro and nonmetro employment indices grew rapidly in the past 3 years.
About one-half (1.1 percentage points) of the recent rural employment growth deficit can be explained by the lower rate of population growth in rural areas. On the eve of the recession, the rural population was growing at less than half the rate of the urban population (0.5 percent per year versus 1.2 percent), and counties with the slowest population growth had the slowest subsequent rates of employment growth. Since the end of the recession, rural population growth has slowed to near zero as outmigration has accelerated, likely in response to employment losses associated with the recession.
A significant positive relationship was found between local employment growth rates and the share of the adult population that were college graduates. The college-educated share of the population was lower in nonmetro counties (16 percent) than in metro areas (23 percent), and this education gap reduced nonmetro employment growth relative to growth in metro areas during the recovery. About one-third (0.7 percentage points) of the deficit in nonmetro employment growth is due to differences in educational attainment across all levels. The higher share of older workers in rural areas also contributed to lower employment growth, accounting for 0.4 percentage points of the difference between urban and rural employment growth.
On the other hand, differences in industrial composition appear to favor nonmetro areas, adding 0.6 percentage points to rural employment growth (relative to urban) within each State since the end of the recession. Rural areas’ higher employment shares in agriculture and the relatively fast-growing mining industries reduced the rural growth deficit, as did their smaller shares of employment in the slow-growing professional services industries.
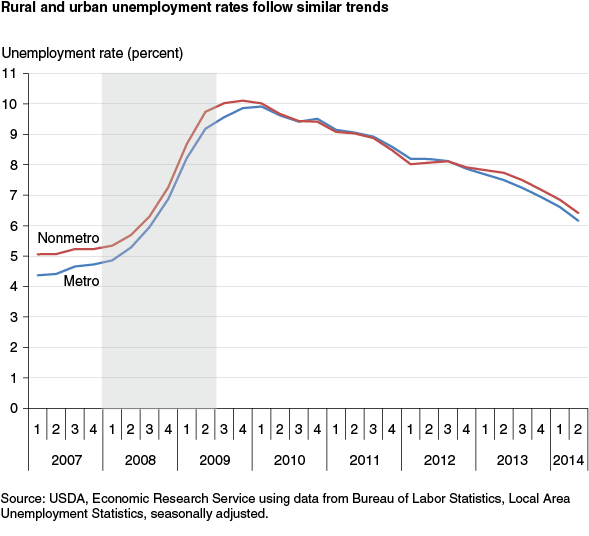
Despite the difference in employment growth patterns, rural and urban unemployment rates have followed similar trends during the recovery period. The slower rate of growth of the rural population and labor force has made it possible for unemployment to fall even with little growth in employment.
Why did the least densely populated rural areas lose fewer jobs during the recession?
The least densely populated one-third of nonmetro counties saw average employment fall by just 1.3 percent during the recession, compared to 5-6 percent for the medium- and high-density nonmetro counties. State-level effects accounted for most of this difference; low-population-density counties are disproportionately located in States in the Northern Plains and Mountain regions, where both low- and higher-density counties fared comparatively well during the recession. Low-density counties also benefited from a favorable mix of industries: their much lower shares of manufacturing employment, higher shares of farm employment, and somewhat higher shares of Federal employment all served to protect them from the worst employment effects of the recession. Together, these industrial composition effects raised employment growth (or reduced employment losses) by almost 2 percentage points relative to more densely populated nonmetro areas. None of the other variables considered, such as age and education distributions, were significant in explaining the better outcomes in low-density counties. Nonmetro counties that were adjacent to metro areas experienced higher rates of employment decline during the recession for many of the same reasons as counties with higher population density; such counties are disproportionately located in States that suffered greater employment losses overall. Nonmetro counties adjacent to metro areas also had higher levels of employment in manufacturing, which shed employment rapidly, and relatively low levels of employment in natural resource-based industries (farming and oil and gas extraction) and the Federal Government.
This article is drawn from:
- Hertz, T., Kusmin, L., Marré, A. & Parker, T. (2014). Rural Employment Trends in Recession and Recovery. U.S. Department of Agriculture, Economic Research Service. ERR-172.


