
Productivity Impacts on Food Security in Sub-Saharan Africa
- by Stacey Rosen, Keith Fuglie, Nicholas Rada and Birgit Meade
- 8/4/2014
Highlights
- A projected 22 percent of Sub-Saharan Africa’s (SSA) population is food insecure in 2014, meaning that per capita consumption for this group falls below a nutritional target of 2,100 calories per day.
- The relatively poor performance of SSA’s agricultural sector is attributed to lower levels of agricultural land and labor productivity than the rest of the world.
- Model results suggest that widespread adoption of modern varieties of crops in SSA can significantly improve food security in the region.
The number of food-insecure people in 76 low- and middle-income countries worldwide is projected at 490 million in 2014 according to ERS’s International Food Security Assessment, 2014-24. This is equal to roughly 14 percent of the total population of the 76 countries. Among the four regions of focus in the study, North Africa is generally considered to be the least food insecure, as nearly all of its population is projected to meet a nutritional target of roughly 2,100 calories per day. Asia follows North Africa, with 8.5 percent of its population considered to be food insecure. In Latin America and the Caribbean, a projected 22 percent of the population falls short of the nutritional target. Sub-Saharan Africa is the most vulnerable of the four regions, as more than 29 percent of its population does not meet the target for consumption.
The distribution gap, the quantity of food needed to raise consumption in each income decile within a country to the nutritional target, illustrates the vulnerability of SSA to an even greater degree than the share of food-insecure people. SSA accounts for 83 percent of the total distribution gap for the 76 countries examined, but the region accounts for only 25 percent of the population of the 76 countries.
Domestic grain production accounts for roughly 80 percent of SSA’s grain supply. Therefore, the key to improving food security in this region is boosting performance of the agricultural sector. SSA currently has some of the lowest levels of agricultural land and labor productivity in the world.
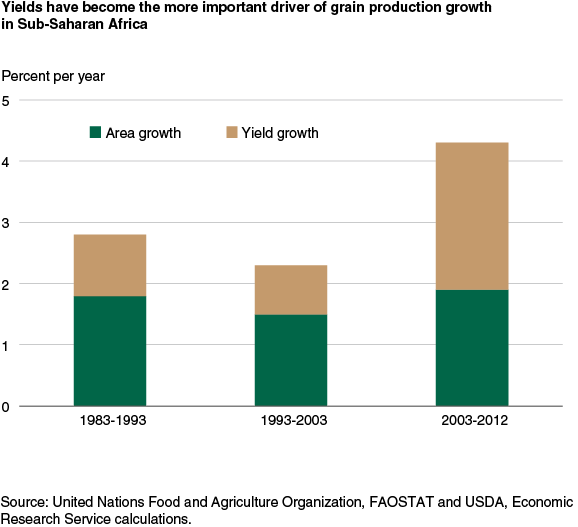
Historically, the sources of agricultural growth for SSA have been the addition of land, labor, and other resources to production. In fact, area expansion accounted for nearly half of grain production growth between 1995 and 2010. In comparison, area expansion accounted for only 12 percent of grain-output growth in Asian countries during the same period. Grain yields in SSA are among the lowest in the world, with an average of roughly 1.2 tons per hectare in 2010-12. The average is 3.3 tons per hectare for low- and middle-income countries, 4.56 tons per hectare in high-income countries, and 3.62 tons per hectare for the world as a whole. One hectare equals 2.47 acres.
In recent years, productivity-based growth in SSA raised average farm output per unit of input, thereby contributing to an increase in the growth rate of agricultural production. In fact, with the rise in productivity, agricultural output in 2010 was roughly 30 percent higher than it would have been if the region had continued to rely on resource-based growth alone.
Despite the improvement in productivity-based growth, the region’s agricultural productivity growth rate continues to lag behind that of the rest of the world. Moreover, the productivity gap is widening over time. Total factor productivity (TFP) compares growth in the total output of crop and livestock commodities to the growth in total inputs of agricultural land, labor, capital, and material resources (see box, “Total Factor Productivity'). For developing countries as a whole, the TFP index increased roughly 2 percent per year, since 1961; the index for SSA grew at only half that rate.
TFP growth rates vary widely within SSA, as some of the countries have been able to sustain modest rates of improvement for a few decades. On average, SSA’s TFP grew roughly 1 percent per year between 1985 and 2008. Among the SSA subregions, the highest growth was in Southern Africa, 1.1 percent per year, while the lowest rate was in Central Africa, where TFP declined 0.4 percent per year. A declining TFP growth rate indicates resource use has risen faster than productivity growth. Among individual countries in SSA, the strongest TFP growth was in Angola, Malawi, Benin, Ghana, and Nigeria—all exceeding 2 percent per year.
The SSA TFP growth was partly driven by investment in research and development (R&D), which resulted in improved technologies for producers. These technologies included improved crop varieties, pest control, livestock disease controls, and more efficient management of natural resources. ERS estimates that by 2005, these new technologies were adopted on at least 25 percent of the region’s cropland.
Research and Adoption of New Varieties Have Stimulated Some Yield Growth
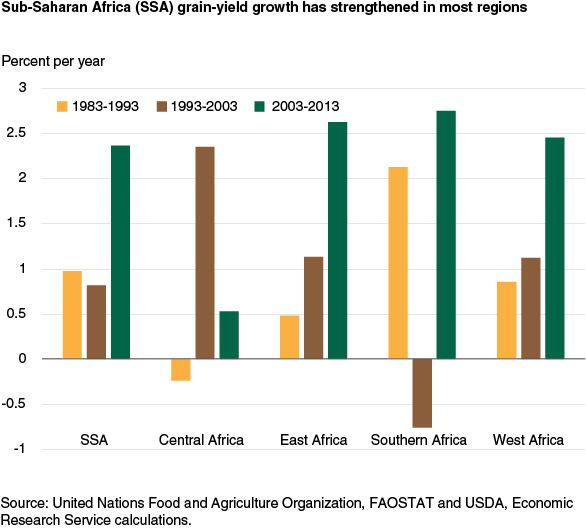
SSA grain-yield growth averaged 1 percent or less per year between 1983-1993 and 1993-2003. Since that time, however, it has averaged 2.4 percent. Among the 39 SSA countries examined by ERS, the number achieving average grain yields above 1.5 tons per hectare increased from 3 in 2000-02 to 11 in 2010-12. In Southern Africa, yields grew close to 3 percent per year between 2003 and 2013, mostly driven by Malawi, where yields increased more than 10 percent per year, reflecting policies that subsidized agricultural inputs such as seeds and fertilizers. Eastern Africa’s yield growth of 2.6 per year during the period was driven in large part by improvements in Rwanda and Ethiopia. In West Africa, Sierra Leone and Mauritania had the strongest yield growth. In some West Africa countries, like Sierra Leone, yield growth resumed after a period of agricultural decline or stagnation during years of war. In the Central African region, continued civil strife over the last decade has stagnated grain yield growth.
Higher yields are, in part, a response to better seeds and farming techniques. Many of the new technologies adopted by SSA farmers are attributed to research conducted by the 15 international agricultural research centers of CGIAR (the Consultative Group on International Agricultural Research). By 2011, CGIAR was investing more than $300 million annually—roughly half of its research funding—in SSA. In addition to this research funding, many SSA countries have established their own agricultural research systems, with total spending in the region approaching $600 million in 2008.
Policy reforms have also contributed to the higher productivity in the region. These changes included freeing up agricultural markets, reducing taxes on exports and imports, freeing exchange rates, and reducing subsidies for energy and fertilizer. Farmers responded by investing in the adoption of new technologies, which resulted in accelerated productivity growth.
The African Union, an organization with representation of 54 countries in Africa, has called for an increase in investment in the agricultural sector with a goal of doubling current growth in the sector to 6 percent per year. Achieving this growth would require an increase in both resource use and productivity.
Broader Adoption of Modern Varieties Could Reduce Food Insecurity in SSA
To the extent that higher productivity rates are reflective of new technologies, gains in TFP will equal those of yield. In many SSA countries, adoption of new technologies has already resulted in higher output per hectare. For example, in Nigeria, Benin, Ghana, Senegal, Malawi, and Zambia, 27-55 percent of crop area was devoted to modern varieties in 2006-10. In each of these countries, grain yields increased from 4 to 16 percent per year. If all countries in the region were able to replicate these changes, food security would likely improve significantly.
To project potential impacts of new technologies across SAA, ERS used its International Food Security Assessment (IFSA) model to simulate the impact of increases in modern varieties, and ensuing higher yields, on food security. Researchers estimated a productivity elasticity of 0.65, meaning that a 1-percent increase in area dedicated to modern varieties leads to a 0.65-percent increase in net yields (the increase in output per hectare minus any increases in costs due to the changes in input use.) This increase is synonymous to improvement in TFP.
In the first scenario, the percentage of land devoted to modern varieties (MVs) in SSA is assumed to rise to the average of the subregions: West, Central, East, and Southern Africa. The difference between actual levels allocated and the target level was calculated and then multiplied by the 0.65 productivity elasticity to determine the expected increase in net yields. This increase was then applied to the 2014 estimated yield of the IFSA model.
Only 10 SSA countries were included in this scenario: the other 29 were estimated to be food secure or were already devoting more of their cropland to MVs than the regional average. Despite the small number of countries included in the scenario, the number of food-insecure people in the region is estimated to decline by 13 percent, and the distribution gap is projected to fall by more than 5 percent from the baseline. Four of the 10 countries become food secure under this scenario.
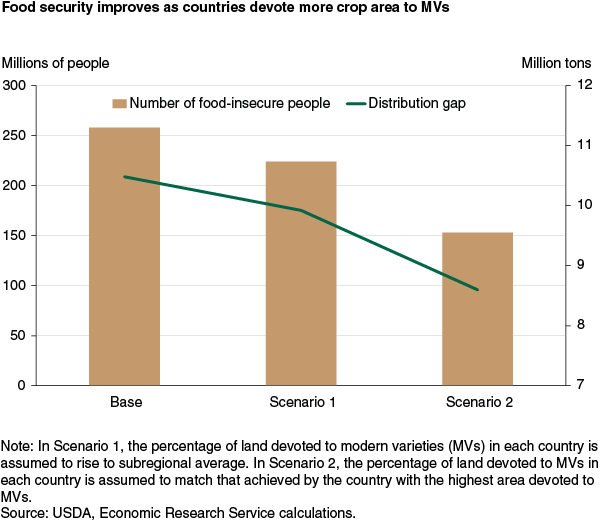
In the second scenario, the percentage of land devoted to MVs is assumed to match that achieved by the country within the subregion with the highest area devoted to MVs. As a result, the impact for the 17 countries included in this scenario was greater than that in the first scenario. The number of food-insecure people in the region is estimated to decline 40.7 percent, and the distribution gap is projected to fall by 18 percent. Seven countries are estimated to become food secure in this scenario.
The results suggest that in SSA countries where food insecurity was not severe—30 percent or less of the population consumes below the nutritional target—the increased crop area devoted to MVs boosted productivity enough to enable the countries to become food secure. Higher productivity in SSA in recent years has been driven by increased investment in R&D by the countries themselves as well as international institutions. Spending by CGIAR generated an internal rate of return of 58 percent per year—or roughly $6 of benefits for every $1 spent in the region. Rates of return for national R&D spending were about half that level. Given these returns and the continued emphasis on agricultural development in the region, land area devoted to modern varieties is likely to continue rising. With that increase, as illustrated here, food security can be significantly improved for many SSA countries, and indeed, achieved for others.
This article is drawn from:
- Rosen, S., Meade, B., Fuglie, K. & Rada, N. (2014). International Food Security Assessment, 2014-24. U.S. Department of Agriculture, Economic Research Service. GFA-25.
You may also like:
- Fuglie, K. & Rada, N. (2013). Resources, Policies, and Agricultural Productivity in Sub-Saharan Africa. U.S. Department of Agriculture, Economic Research Service. ERR-145.
- Food and Agriculture Organization of the United Nations. (2014). FAOSTAT database. World Bank. World Development Indicators database.