
A Visual Primer for the Food and Agricultural Sectors
- by Lewrene Glaser, Kathleen Kassel and Rosanna Mentzer Morrison
- 12/16/2013
In September 2013, ERS released Ag and Food Statistics: Charting the Essentials, a collection of charts and maps covering fundamental statistics and trends related to the U.S. agricultural and food sectors. This new online product, which brings together 79 charts and maps with brief accompanying text, is designed to be a visual primer for those wanting to understand the issues facing U.S. food and agriculture today.
Grouped into nine sections, the Essentials provides the big picture of U.S. farming, agricultural production and trade, rural well-being, food prices and consumption, food security and the Nation’s food assistance safety net, and the interaction of agriculture and natural resources. The charts and maps will be periodically updated and can be accessed at www.ers.usda.gov/essentials
Below are a few of the questions that can be answered by the Essentials:
Where are fragile farm lands being protected?
U.S. agricultural production relies heavily on the Nation’s land, water, and other natural resources and has a direct impact on environmental quality. The Conservation Reserve Program (CRP) is currently USDA’s largest conservation program in terms of spending. The program covered 27 million acres of environmentally sensitive land at the end of 2011, with an annual budget of roughly $2 billion. Enrollees receive annual rental and other incentive payments for taking eligible land out of production for 10 years or more. Program acreage tends to be concentrated on marginally productive cropland that is susceptible to erosion by wind or rainfall. A large share of CRP land is located in the Plains (from Texas to Montana), and smaller concentrations of CRP land are found in eastern Washington, southern Iowa, northern Missouri, and the Mississippi Delta.

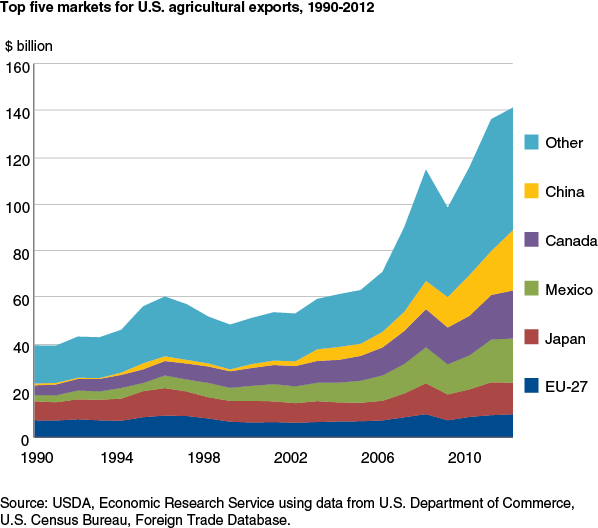
What’s the leading destination for U.S. agricultural exports?
World demand for U.S. agricultural products has strengthened in recent years as the Nation’s agricultural exports outpaced imports. The leading U.S. agricultural exports are grains and feeds, soybeans, livestock products, and horticultural products. Over the past decade, the value of U.S. agricultural exports to China has grown an average of over 33 percent per year—strong demand for soybeans, cotton, corn, other feeds, cattle hides, tree nuts, and pork are behind this growth. China was the No. 1 destination for U.S. agricultural exports in 2012. Canada—which held the top spot for most of the 2000s—and Mexico continue as strong trading partners. Japan—the top destination for U.S. exports in the 1990s—slipped to fourth place in 2009-12.
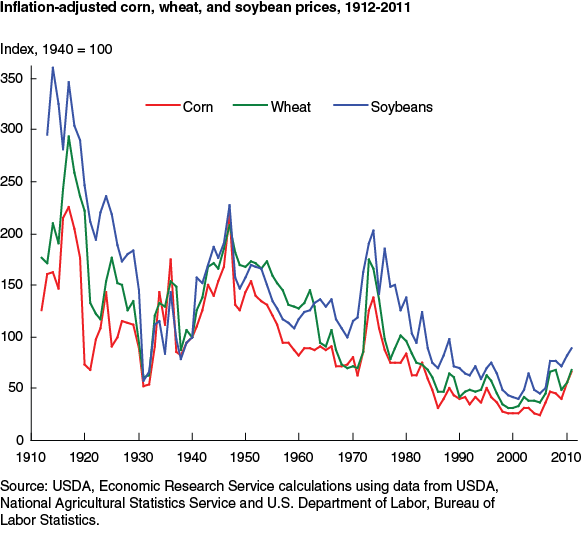
Why do real prices for agricultural commodities sometimes depart from long-term downward trends?
In nominal terms, prices received by U.S. farmers for crops have generally moved upward over time, although they vary from year to year. When these nominal prices are adjusted for inflation, real farm-level prices for corn, wheat, and soybeans show long-term declines, largely reflecting increased U.S. productivity in crop production over the past century. Historically, real prices for these crops rose during times of market shocks—such as prolonged drought (1930s) and wars (World War I and World War II)—and during times of new market developments—such as increased export demand for grain and oilseeds and a depreciation of the U.S. dollar in the early 1970s. Increasing real prices for these crops during the past decade again largely reflect evolving market developments as growth in global population and income and increasing biofuel production raised demand for these crops.
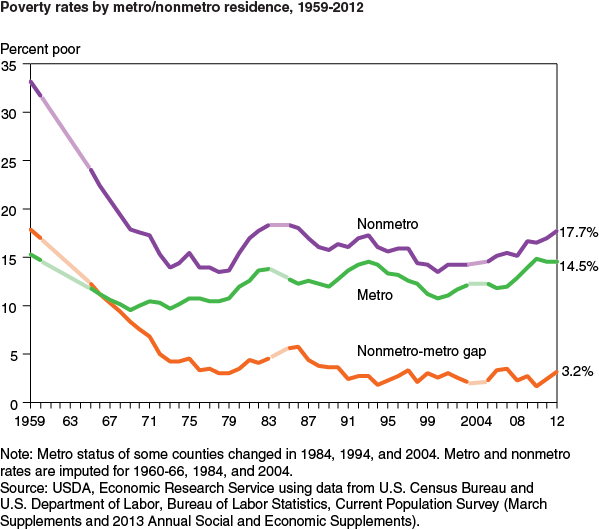
How does the economic well-being of people in rural areas compare to city and suburban dwellers?
Rural (nonmetro) areas have had a higher rate of poverty than metro areas since the 1960s, when poverty rates were first officially recorded. Over time, the gap between nonmetro and metro poverty rates has generally narrowed, falling from an average difference of 4.5 percentage points in the 1980s to a record low of 1.6 percentage points in 2010. In 2012, the nonmetro poverty rate ticked up to 17.7 percent, while the metro rate dropped slightly to 14.5 percent. The current nonmetro poverty rate is at its highest since 1986. Labor force participation is lower in nonmetro areas than in metro areas, reflecting a higher proportion of elderly and disabled among the adult population in nonmetro areas and lower participation rates among working-age adults.
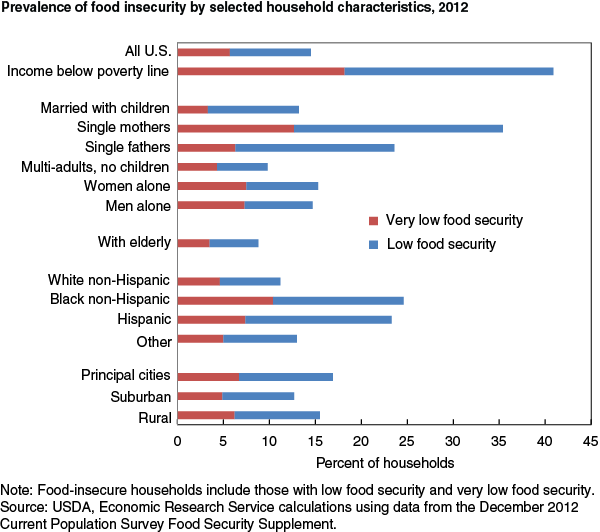
Which American households struggle to put food on the table?
While most U.S. households are food secure, a small percentage experience food insecurity at times during the year, meaning that their access to adequate food for active, healthy living is limited by a lack of money and other resources. Some experience very low food security, a more severe range of food insecurity where food intake of one or more members is reduced and normal eating patterns are disrupted. In 2012, about 41 percent of U.S. households with incomes below the Federal poverty line were food insecure. Rates of food insecurity and very low food insecurity were substantially higher than the national average for single-parent households and for Black and Hispanic households. Food insecurity was more common in large cities and rural areas than in suburban areas.
This article is drawn from:
- Ag and Food Statistics: Charting the Essentials. (n.d.). U.S. Department of Agriculture, Economic Research Service.