New Loss Estimates Suggest Higher Vegetable and Protein Consumption
- by Jean C. Buzby and Hodan Farah Wells
- 9/1/2011
Each year, ERS estimates the amount of food available for consumption in the U.S. By summing production, beginning stocks, and imports, and subtracting exports, ending stocks, and nonfood uses, ERS calculates the total supply of hundreds of foods. But supply or availability does not equate to consumption. Bones, peels, and other inedible parts are discarded, spoilage losses occur throughout the marketing system, and not everything on the dinner plate makes it into our stomachs. From kids feeding vegetables to the dog to family members refusing to eat leftovers again, not all the food we buy or prepare is actually consumed.
ERS researchers recognize this discrepancy and adjust the Food Availability data for nonedible parts and food losses from farm to retail, at retail, and at the consumer level. Good information exists to adjust for nonedible shares and losses at the retail level, but consumer-level food loss is not as well documented. These losses vary greatly depending on a food's perishability, how it is used (as an ingredient or eaten as is), and whether it is typically consumed by children or adults.
ERS contracted with the research organization RTI International to develop updated consumer-level loss estimates. RTI researchers compared purchase data from Nielsen Homescan and Perishables Group, Inc., with consumption data from the National Health and Nutrition Examination Survey (NHANES) to estimate annual consumer-level losses for approximately 200 foods.
For some foods, the new RTI estimates and the original ERS loss estimates are similar. For example, ERS assumed 13 percent of provolone cheese is lost annually at the consumer level, while the RTI estimate is 14 percent. RTI loss estimates for fresh pumpkin, Swiss cheese, and lard are much higher than those previously used by ERS, while RTI estimates for chicken, lamb, and frozen potatoes are lower. These differences could stem from changes in food demand and preparation habits or simply from different measurement techniques.
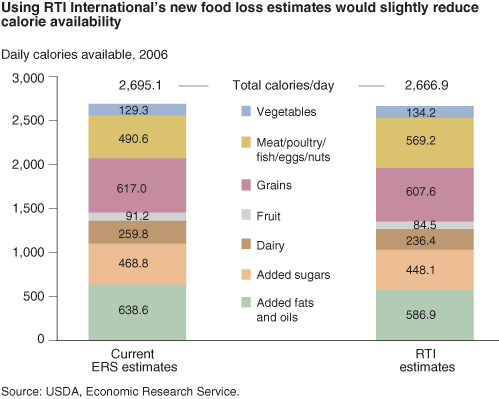
If all of RTI's food loss estimates are adopted, changes to ERS's current Loss-Adjusted Food Availability data would vary for individual foods. Changes over entire food groups, however, would be small. The most affected group would be meat, poultry, fish, eggs, and nuts. Using RTI estimates would increase annual food availability for this group by 22.6 pounds per person, or 14.7 percent. Grain and grain products would have the smallest change--a decrease of 2.1 pounds per person, or 1.5 percent.
Overall, using RTI's proposed estimates would reduce estimated total per capita availability by 10.0 pounds of food per year, or roughly 28 fewer calories per day, for the average American. ERS plans to use many of the RTI loss estimates in its loss-adjusted data series.
This article is drawn from:
- Muth, M.K., Karns, S.A., Nielsen, S.J., Buzby, J.C. & Wells, H.F. (2011). Consumer-Level Food Loss Estimates and Their Use in the ERS Loss-Adjusted Food Availability Data. U.S. Department of Agriculture, Economic Research Service. TB-1927.
You may also like:
- Food Availability (Per Capita) Data System. (n.d.). U.S. Department of Agriculture, Economic Research Service.


