Rising Food Prices and Declining Food Security: Evidence From Afghanistan
- by Anna D'Souza
- 9/1/2011
Highlights
- In Afghanistan, the 2007/08 rapid rise in wheat prices impacted urban and rural household food security, with observed declines in food consumed, calories, protein, and dietary diversity.
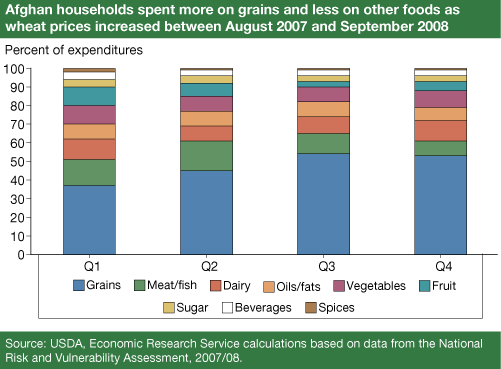
- Households traded off quality for quantity, moving away from micronutrient-rich foods like meat, fruit, and vegetables toward staples.
- Food price shocks can exacerbate chronically low levels of nutrient intake in countries with large populations living in poverty with generally poor diets.
In 2008, the price of wheat--the dietary staple--rose dramatically in Afghanistan due to a confluence of international (high global food prices), regional (export restrictions in neighboring trading partner countries), and domestic (drought) factors. Analysis of consumption and price data from the National Risk and Vulnerability Assessment 2007/08 (NRVA) shows that the price increase led to a decline in food security across rural and urban areas. The implications of greater food insecurity for Afghan households can be serious; even a short period of low nutrient intake can have long-term repercussions for young children in developmental stages, pregnant mothers, the elderly, or other vulnerable groups.
With a long history of political instability and conflict, as well as weak infrastructure and mountainous terrain, Afghanistan is particularly vulnerable to economic and natural shocks. Recent increases in the level and volatility of food prices pose a threat to countries like Afghanistan, where large populations often live in a state of food insecurity (defined as limited or uncertain availability of nutritionally adequate and safe foods).
Understanding how households respond to price shocks can help national and local governments and aid agencies design interventions and respond to local needs during economic crises or natural disasters. Such efforts are particularly important in poor, conflict countries where there is often limited data and analysis pertaining to food consumption and household coping mechanisms.
Afghanistan Is One of the World's Poorest, Most Food-Insecure Countries
After decades of war and political instability, landlocked Afghanistan remains one of the world's least-developed nations. Estimates from the International Monetary Fund show the gross domestic product averaged US$470 per capita between 2007 and 2010. Based on the broader set of indicators, such as health and education, used in the United Nations Development Programme's Human Development Index, Afghanistan ranked 181st out of 182 countries in 2008. And, according to the World Food Programme, Afghanistan is among the world's most vulnerable countries in terms of absorbing food and fuel price shocks.
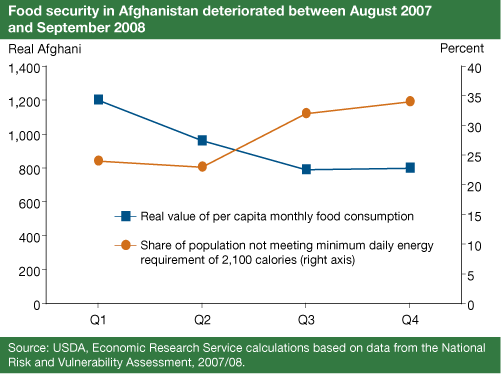
Based on ERS research, Afghanistan had a nutrition gap--the difference between available food and food needed to support intake of 2,100 calories per capita per day--of approximately 2 million tons in 2008; only North Korea had a larger estimated nutrition gap in that year. Using NRVA survey data, ERS researchers found that approximately 28 percent of the Afghan population did not meet the minimum daily energy requirements of 2,100 calories per day per person.
Wheat Is the Main Staple…
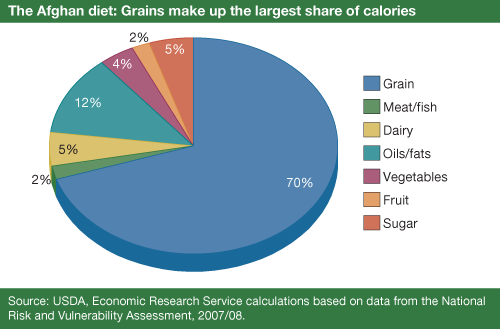
The composition of the Afghan diet is similar to that of populations in other developing countries. Over 80 percent of total calories come from grains, oils, and fats, with the majority of calories (54 percent) coming from wheat. On average, Afghan households spend over 60 percent of their budgets on food, making them particularly vulnerable to declines in purchasing power brought on by increases in food prices.
…and the Largest Production Crop
The Afghan economy is largely based on agriculture; major crops include wheat, rice, maize, barley, vegetables, fruit, and nuts. About 80 percent of the population live in rural areas, where farming and agricultural labor are important sources of livelihood. About 67 percent of rural households and 15 percent of urban households have access to agricultural land--an important resource when food prices are high.
Over 70 percent of cultivated crop area in Afghanistan is devoted to wheat. Due to large fluctuations in weather and sporadic conflict, agricultural production is highly volatile and the country is dependent on its trading partners to meet any shortfalls. According to ERS research, imports made up about 30 percent of annual consumption from 2000 to 2008.
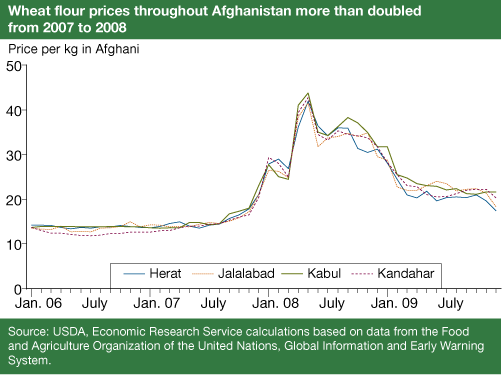
During 2007/08, Afghanistan experienced several shocks that disrupted its food supply network, causing food prices to soar throughout the country. The 2008 wheat harvest of 1.5 million metric tons (1 metric ton=2,200 pounds) was the worst since 2000 due to drought and early snow melt. In February 2008, the Afghanistan Government eliminated import tariffs on wheat and wheat flour, but the downward effect on prices was small due to export bans in Pakistan (Afghanistan's biggest supplier), Iran, and Kazakhstan, as well as rising international food prices. Between fall 2007 and summer 2008, domestic wheat flour prices increased by over 100 percent, peaking around May-July 2008.
Analyzing the Impact of the Wheat Flour Price Shocks
ERS researchers used NRVA survey data and econometric techniques to estimate the impact of rising wheat flour prices on household food security. The NRVA survey is a nationally representative sample of over 20,000 households from all 34 provinces of Afghanistan. It is unique in that it was conducted over 1 full year and was designed to be nationally representative for each survey quarter.
The analysis covered four measures of food security: the real value of monthly per capita food consumption; daily per capita calorie availability; daily per capita protein availability; and household dietary diversity. The measures relate to two specific dimensions of food security: access and utilization. Access refers to a household's ability to obtain food throughout the year, which depends on income, prices, and distance to local food markets. Utilization refers to the ability to process nutrients and energy from food, which depends on many factors, including dietary diversity and nutrient absorption, intra-household allocation of food, and hygienic preparation.
The real value of monthly per capita food consumption provides a measure of how much food is consumed. It is an important measure of household well-being and is often used by international aid organizations like the World Bank to analyze household poverty. The measure is calculated by multiplying prices by quantities of food consumed per capita over a month. The total is then deflated by price indices that account for differences across regions and over time to get the real value. For example, consider a mix of food worth $100 in 2008 U.S. dollars. Once inflation is taken into account, the real value of the mix of food today is less than $100; if inflation is high, then the real value will be even smaller.
Daily per capita calorie availability and daily per capita protein availability relate to the number of calories and grams of protein contained in the food acquired by a household; these measures do not reflect actual intake levels since detailed food diaries are needed to obtain such information. Calorie availability is a commonly used measure in food security assessments. Protein is an essential macronutrient that supports hormone and enzyme functions and immune system health and is particularly important during developmental stages.
Household dietary diversity reflects the quality of a household's diet and is measured by the World Food Programme's food consumption score. The score represents how frequently households consume foods from eight different food groups over a 1-week period: staples, pulses, vegetables, fruit, meat/fish, milk/dairy, sugar, and oils/fats. The measure is used in food security assessments across the globe.
Price Shocks Led to Increases in Household Food Insecurity…
ERS research findings suggest a significant household response to rising food prices in Afghanistan, reflecting an overall decline in food security as measured by the four food security indicators described earlier. The estimation results imply that for a 1-percent increase in the price of wheat flour, Afghan households reduced the real value of monthly per capita food consumption by 0.20 percent. Thus, households cut back on the total amount of food consumed in response to declining purchasing power.
…Causing Households To Trade Off Quality for Quantity in Their Choice of Foods
To maintain calories as purchasing power declined, Afghan households changed the composition of their diets. Thus, households were able to buffer the impact of the price shock on calorie availability to some extent. The results imply that for a 1-percent increase in the price of wheat flour, calories declined by 0.07 percent, less than half the observed decline in food consumption.
Similarly, the results imply a large decline in dietary diversity; for a 1-percent increase in the price of wheat flour, Afghan households reduced the diversity of their diets by 0.10 percent. The shift toward lower quality (less micronutrient-rich), cheaper foods (like staples) can be seen in the expenditure shares that households devoted to specific food groups, as well as a reduction in per capita protein availability. Higher wheat flour prices induced households to increase the total food expenditure shares devoted to grains and to reduce expenditure shares for the other major food groups (meat/fish, dairy, oils/fats, vegetables, fruit, and sugar). Additionally, the dietary shifts are observed in protein availability changes; for a 1-percent increase in the price of wheat flour, there was a 0.25-percent decline in daily per capita protein availability.
While the magnitude of these effects may appear small, the estimation results presented pertain to a 1-percent increase in prices. In 2007/08, however, wheat flour prices increased by more than 100 percent throughout Afghanistan. Therefore, there may have been serious repercussions for the food security status of Afghan households.
The changes in dietary diversity can be seen through shifts in calorie and expenditure shares devoted to various food groups as well. The estimated changes in calorie shares are less stark than the estimated changes in expenditure shares. Increasing wheat flour prices are associated with smaller shares of calories from fruit and oils/fats, a larger share from grains, but no observed change in calorie shares from meat/fish or from vegetables. These results may be due partly to a shift to lower quality, cheaper foods within the same food group. For example, if households began purchasing the cheapest meat possible, the expenditure share on meat/fish may decrease without an accompanying reduction in calorie share on meat/fish.
Taken together, these findings may indicate reduced micronutrient intake, with important implications for nutrition and health. Researchers at the International Food Policy Research Institute have linked low levels of dietary diversity to poor dietary quality and inadequate nutrient availability. According to the United Nations Children's Fund, micronutrient deficiencies have been linked to multiple negative outcomes for children, as well as adults, including impaired cognitive development, physical and mental disabilities, infant and maternal deaths, and lower productivity. According to the World Health Organization, undernutrition is a leading cause of child mortality worldwide.
Household Responses Varied Across Rural and Urban Areas
Economic theory and empirical data suggest that urban or landless rural households are likely to be more adversely affected by food price increases than agricultural rural households that can produce their own food. When food prices increase, purchasing power--the amount of a good that a consumer can buy with a given sum of money--declines. Some households, however, are less dependent on food purchases than others. For example, if a household is a net seller of food (the total value of food produced is greater than the total value of food consumed), then its income will increase as food prices rise, mitigating the decline in welfare due to lower purchasing power.
ERS researchers used two broad categories to examine differential effects of the wheat flour price increases in Afghanistan: (1) rural versus urban areas; and (2) households with versus households without access to agricultural land. In both categories, the former group is more likely to include some net sellers of food.
The analysis reveals that urban areas experienced a much greater decline in the real value of food consumption than rural areas. For a 1-percent increase in wheat flour prices, the value of real monthly per capita food consumption in rural areas declined by 0.19 percent, while the decline in urban areas was 0.37 percent. Other studies on the impacts of the high food price inflation in 2007/08 also found a disproportionate impact on urban areas in terms of poverty and total consumption.
Urban households made large reductions in dietary quality--as measured by dietary diversity and protein availability--to maintain energy levels; thus, they did not experience a significant decline in calorie availability. Further, urban households exhibited a more pronounced shift from higher quality food groups toward grains--in terms of calorie and expenditure shares--than did rural households. Urban households reduced calorie shares from dairy, vegetables, fruit, and sugar, while rural households only reduced calorie shares from oils/fats and fruit. Rural households did not make large changes in dietary composition; thus, they experienced a small decline in calorie availability.
Differences in coping strategies for rural and urban households may be driven by stronger preferences for maintaining dietary quality in rural areas. Alternatively, rural households that engage in home food production may have had greater access to an assortment of foods, which would have made it relatively easier for them to maintain a more diverse diet as wheat prices rose.
The difference in impact of the wheat price increases on households with and without access to agricultural land was generally similar to that observed for households in rural and urban areas. Households with agricultural land experienced smaller declines in the real value of food consumption and dietary diversity but a slightly larger decline in calorie availability than households without access to agricultural land. The impact of the wheat price increases on protein availability was similar for both groups.
Wheat Flour Price Increases Led to Higher Wheat Demand in Urban Areas
Given the importance of wheat in the Afghan diet, ERS researchers examined changes in the demand for wheat products as measured by daily grams of wheat consumed per capita. At the national level, there was no observable change in total demand for wheat products associated with price increases. However, in examining the effects for urban and rural areas separately, ERS researchers found a large positive effect in wheat consumption in urban areas but no statistically significant effect in rural areas. This result may seem counter to the law of demand because higher prices usually lead to lower consumption. In this case, however, urban consumers were substituting wheat for other higher priced products (see box, 'The Paradox of Giffen Goods'). As purchasing power declined, urban households made budgetary adjustments, shifting their consumption toward the cheapest foods to maintain energy levels. Wheat products provide the most calories per Afghani, so consumption of wheat products increased.
Implications for Afghanistan and Beyond
The United Nations Food and Agriculture Organization estimated that in 2010, nearly a billion people in the world were undernourished with calorie intake below the minimum dietary energy requirement. Recent wildfires and export bans (Russia), flooding (Pakistan), and political instability (Middle East) have added to international commodity price volatility and raised concerns about potential increases in food insecurity and global poverty. For households that spend the majority of their budgets on food, large increases in food prices erode purchasing power, disproportionately affecting poor households and threatening their nutrition and health. Potential policy interventions to mitigate the effects of food price shocks could include micronutrient supplementation programs based on food inflation indicators; employment-generation programs; incentives to encourage the adoption of yield-increasing agricultural practices; improvements in transportation and irrigation infrastructure; targeted food distribution programs; and wheat fortification programs.
This article is drawn from:
- D'Souza, A. (2011). Wheat Flour Price Shocks and Household Food Security in Afghanistan. U.S. Department of Agriculture, Economic Research Service. ERR-121.
You may also like:
- Persaud, S. (2010). Wheat Outlook: May 2010. U.S. Department of Agriculture, Economic Research Service. WHS-10d01.
- Shapouri, S., Rosen, S., Tandon, S., Gale, F., Mancino, L. & Bai, J. (2011). International Food Security Assessment, 2011-21. U.S. Department of Agriculture, Economic Research Service. GFA-22.
We’d welcome your feedback!
Would you be willing to answer a few quick questions about your experience?


