Mapping Population and Economic Trends in Rural and Small-Town America
- by John Cromartie, Timothy Parker, Vince Breneman and David Nulph
- 3/14/2011
Nearly 50 million people live in nonmetropolitan (nonmetro) America, covering approximately 2,000 counties. Nonmetro areas--widely used to depict rural and small-town conditions and trends--contain 17 percent of the U.S. population but extend across 80 percent of the land area. Economic and social challenges facing rural areas and small towns differ greatly from those affecting larger U.S. cities, and the opportunities for rural population growth and economic expansion vary substantially from one nonmetro county to the next.
The ERS Atlas of Rural and Small-Town America helps shed light on the overall scope and diversity of demographic, economic, and social trends across the United States by providing county-level mapping of over 60 statistical indicators. Along with nonmetro-metro differences, interactive features of the Atlas enable users to view indicators for the full array of ERS county typologies, such as nonmetro counties that are farm dependent, persistently high poverty, or recreation based. Knowledge regarding the population's age structure, race and ethnicity, income, employment, and other measures in different geographic areas can help national, State, and local policymakers create economic development strategies targeting challenges specific to particular regions and building on local assets. For example, planners in rural Great Plains communities may want to compare population trends in their area with those in less-isolated communities.
Atlas Features New Data From the American Community Survey
The Atlas of Rural and Small-Town America assembles the latest county-level statistics from the U.S. Census Bureau, the Bureau of Labor Statistics (BLS), the Bureau of Economic Analysis, USDA, and other Federal sources. The debut of the Atlas follows the release of the first full set of county-level data from the Census Bureau's American Community Survey (ACS). For hundreds of small counties throughout the U.S., these data offer the first chance to measure key socioeconomic information since the previous decennial census in 2000. New population profiles from the ACS (such as percentage of elderly or foreign born) are combined with the latest agricultural statistics from USDA, employment data from the BLS, and other indicators in four broad categories:
- People--county demographic profiles, including age, race/ethnicity, education, family composition, population change, migration, and immigration.
- Jobs--conditions and trends affecting the labor force, such as employment change, unemployment, industry, and occupational structure.
- Agriculture--indicators of farm structure and the well-being of farm households, including farm size, income, sales, and tenure.
- County classifications--ERS county classifications based on the rural-urban continuum, economic structure, and other key locational features, such as landscape amenities, creative class occupations, persistent poverty, or population loss status.
The time periods for the data vary because they are obtained from multiple sources. ACS demographic data, for example, represent average conditions in counties in 2005-09, while employment data measure 1-year averages through 2009. Most of the farm data come from the 2007 Census of Agriculture. Metro-nonmetro status and other county classifications, currently based on 2000 decennial census data, will be updated when the 2010 Census becomes available.
What Can Users Do With the Atlas?
The Atlas allows users to create county-level maps showing the variation in key socioeconomic conditions across the United States. The first map, reproduced from the Atlas, depicts county-level unemployment, showing high rates in the Pacific Northwest, northern Michigan, and parts of the Southeast, compared with lower rates in the Great Plains and Intermountain West. Employment data in the Atlas show that many pockets of high unemployment also have large percentages of workers employed in manufacturing.
Clicking on any county produces a pop-up box containing statistics for all indicators in the category relevant to the county. If a user clicks on Bamberg County, SC, for example, a pop-up box shows that 16.5 percent of Bamberg's workers were unemployed in 2009 and that 16 percent of those employed had jobs in manufacturing.
Michigan hit hard by unemployment in 2009, along with parts of the South and Far West

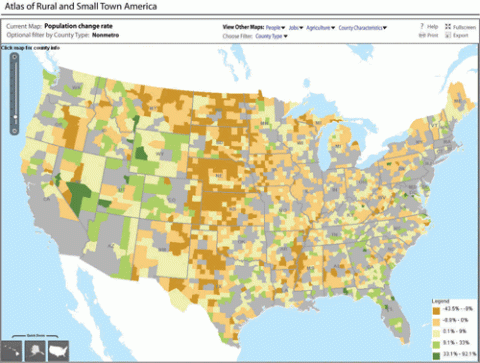
The Atlas also enables users to selectively highlight groups of counties based on nonmetro-metro status and other county typologies. For example, the second map shows population change for nonmetro counties, highlighting the difficulties that relatively remote communities may have in attracting new residents.
The map clearly shows that the vast majority of rapidly growing nonmetro counties are adjacent to metro areas. However, more isolated communities with scenic amenities, such as mountains and bodies of water, also typically have growing populations.
Nonmetro population growth in the Mountain West contrasts with loss throughout the Great Plains

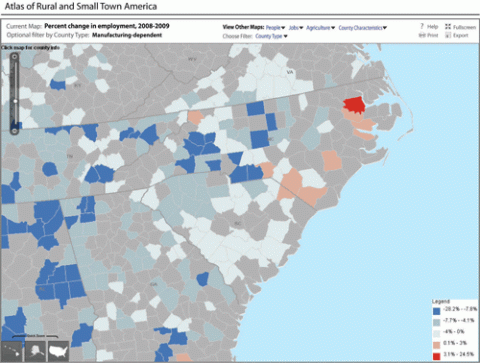
The Atlas includes easy-to-use zoom and panning features; users may click on the scaling bar (upper left) for zooming or use a mouse to move around. The last map shows employment change since 2000 for South Carolina and vicinity, with nonmetro manufacturing counties highlighted. The concentration of employment loss over the past 10 years in counties dependent on manufacturing is clearly depicted.
The Piedmont South's manufacturing-dependent counties continue to exhibit high job loss

Once a user has configured a map to his or her satisfaction, the map may be printed or saved to a PDF- or JPG-formatted file. An appropriate title and legend is generated automatically. Users will be able to download the data found in the Atlas in ready-to-use Excel files that include State summaries of all the data. With regular updates of available data, the Atlas can be a quick, easy way of getting an overview of conditions and trends affecting rural America.
This article is drawn from:
- Atlas of Rural and Small-Town America. (n.d.). U.S. Department of Agriculture, Economic Research Service.
We’d welcome your feedback!
Would you be willing to answer a few quick questions about your experience?

