New Database Shows Substantial Geographic Food Price Variation
- by Jessica E. Todd and Ephraim Leibtag
- 9/1/2010
The role of food prices in influencing consumer food choices and, in turn, dietary quality is an important research topic at ERS and in the food economics research field in general. Food prices vary across the United States, but until now, a data set that provides a consistent and statistically detailed measure of food prices across geographic markets did not exist. Without such data, researchers could not determine if differences in food choices and health outcomes in specific locations were due to differences in retail food prices, other factors, or both.
New Price Database Provides Geographic Detail
An expert panel convened by the National Academies’ Committee on National Statistics (CNSTAT) reviewed the data needs of USDA to support research and decisionmaking for USDA’s food and nutrition policies and programs. The panel recommended that USDA continue to explore the use of data on food purchases, prices, and consumption from proprietary sources (retail scanner systems, household scanner panels, and household consumption surveys) and to develop ways to increase access to these data for research purposes.
In response, ERS developed the Quarterly Food-at-Home Price Database (QFAHPD) to fill the gap in available food price data. The QFAHPD contains quarterly geographically specific prices for 52 food-at-home food groups between 1999 and 2006. The data set includes such food groups as fresh and frozen dark-green vegetables, low-fat milk, packaged whole-grain products, and carbonated nonalcoholic beverages.
The QFAHPD was constructed using Nielsen Homescan data, which contain detailed information about household food-at-home purchases from all retail outlets, including grocery stores, supercenters, club stores, convenience stores, and other stores. QFAHPD prices, calculated as dollars per 100 grams of food purchased by consumers, are the average household prices paid for each food group within a geographic market group.
A geographic market group consists of either a single metropolitan area (such as Philadelphia, Boston, or Los Angeles), grouped metro areas (such as metro Ohio, which includes Cincinnati, Cleveland, and Columbus), or other groups of counties. A total of 35 geographic market groups cover the contiguous United States between 2002 and 2006, and 30 market groups cover 1999-2001.
Geographic Variation Is Greater Than Annual Inflation
Using the 2006 QFAHPD data, ERS examined the spread between the highest and lowest market price within selected food groups across geographic market groups. Eggs have one of the largest price spreads across geographic market groups. For example, in the first quarter of 2006, in the geographic market group with the highest price, eggs cost 75 percent more than in the market group where eggs were least expensive. Low-fat milk and fresh and frozen fruit also had large geographic price spreads. On the other hand, geographic price variation for carbonated nonalcoholic beverages was on the lower end, with an average price spread of 39 percent in the first quarter of 2006.
| Food groups | Jan - March | Apr - June | July - Sept | Oct - Dec | Yearly average |
|---|---|---|---|---|---|
| Eggs | 75 | 93 | 89 | 65 | 80 |
| Low-fat milk | 86 | 75 | 75 | 72 | 77 |
| Fresh/frozen fruit | 84 | 90 | 57 | 88 | 80 |
| Canned fruit | 62 | 50 | 60 | 46 | 55 |
| Carb. nonalc. beverages | 39 | 48 | 43 | 44 | 43 |
| *Difference between highest and lowest market group price (percent). Source: USDA, Economic Research Service calculations using the 2006 Quarterly Food-at-Home Price Database. |
|||||
These geographic price spreads are much larger than year-to-year changes in food prices, which averaged 2.3 percent in 1999-2006, according to the Consumer Price Index. Most analyses of the effects of price on food choices look at price changes over time at the national level. The new ERS database reveals that analyses using national time series statistics ignore much of the geographic price variation that consumers actually face.
Relative Prices Also Vary Geographically
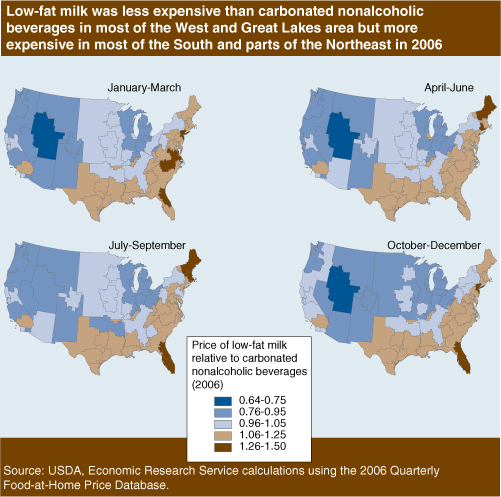
In addition to revealing geographic price differences, the QFAHPD shows that relative prices between food groups differ geographically. For instance, ERS compared the prices of two beverages often consumed by children—low-fat milk and carbonated nonalcoholic beverages (soda). In each quarter of 2006, low-fat milk was less expensive than soda throughout most of the West (with price ratios of low-fat milk to soda less than 1) but more expensive in much of the South and Northeast (with price ratios above 1).
Price differences varied also by season. For example, in parts of the Northeast, the price differential between low-fat milk and soda was greater in the spring and summer than in the fall and winter. Future research will help illuminate whether such variations in relative prices are important in determining differences in food choices across the country.
This article is drawn from:
- Food-at-Home Monthly Area Prices. (n.d.). U.S. Department of Agriculture, Economic Research Service.
- Todd, J.E., Mancino, L., Leibtag, E. & Tripodo, C. (2010). Methodology Behind the Quarterly Food-at-Home Price Database. U.S. Department of Agriculture, Economic Research Service. TB-1926.


