Accelerated Productivity Growth Offsets Decline in Resource Expansion in Global Agriculture
- by Keith Fuglie
- 9/1/2010
Highlights
- Rapid increases in agricultural commodity prices during 2006-08 raised concerns that agricultural productivity growth may not be keeping up with increasing demand for agricultural commodities.
- ERS has developed a new index of total factor productivity (TFP) in global agriculture to provide a more comprehensive understanding of longrun sources of agricultural output growth.
- ERS research shows that the average rate of growth in global agricultural TFP has accelerated in recent decades and accounts for an increasing share of growth in agricultural production. Faster TFP growth has offset declining growth in agricultural land, labor, and other resources, although TFP growth across countries and global regions remains unevenly distributed.
Recent assessments of the global agricultural economy suggest a significant slowdown in the rate of growth in crop yields, raising the specter of heightened supply-side constraints and rising prices at a time when growing population, income, and energy needs are driving up agricultural demand. The March 26, 2010, issue of Science magazine points to evidence that the growth rate in yields for major cereal grains and soybeans fell by half between 1961-1990 and 1990-2007.
While yield growth for some crops may have indeed slowed, it is not evident that growth in overall agricultural productivity also has slowed. Assessments of changes in global agricultural productivity, to date, have been hampered by conceptual and empirical problems. Partial measures like crop yield trends typically are limited to one or a few commodities and consider output relative to only one input—in this case, cropland. This limitation ignores the potential for new technology or efficiency improvements to raise productivity by saving other resources or shifting resources to produce more highly valued outputs. Partial measures also confuse the immediate causes of productivity change by failing to distinguish between the effects of more intensive use of existing technology and the effects of adopting new technology.
Assessing total factor productivity (TFP)—the amount of output per unit of total factors, or inputs, used for production—for the entire global agricultural sector provides a more comprehensive picture of changes in resource requirements to produce outputs (see box, “Measuring the Growth Rate in Agricultural Total Factor Productivity”).
A 1 percent increase in TFP, for example, means that 1 percent fewer agricultural resources are required to produce a given bundle of crop and livestock outputs. Put another way: if prices remain unchanged, then the average cost of production falls by 1 percent. Previous estimates of TFP change in agriculture have generally been limited to individual countries, however, and have not been applied to the global agricultural economy because information on input use and production costs has been incomplete.
To overcome this gap, ERS developed a model to assess productivity change in the global agricultural economy. The model brings together the results of more than a dozen country- and region-specific studies on agricultural productivity, makes reasoned extrapolations for the rest of the world, and aggregates these results using a consistent framework.
While the ERS model does not compare levels of agricultural TFP across countries, it does provide a measure of the growth in agricultural TFP over time for each country, global region, and the world. The results suggest that, rather than the rate of global productivity growth slowing, TFP has accelerated and accounts for an increasing share of the growth in global agricultural output. TFP growth has eased resource constraints facing agriculture, and continued improvement in TFP will be critical in the coming decades if agricultural supply is to keep up with growth in global demand for agricultural commodities.
Why Total Factor Productivity Is Important
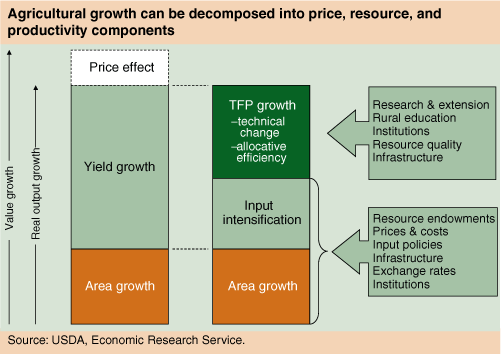
Agricultural growth can arise from a number of sources: changes in real (adjusted for inflation) prices (or the “terms of trade” effect), increased agricultural land, and greater yields. Higher real prices or improved terms of trade increase the value of the same quantity of output, while area and yield growth result in a larger quantity of output (real output growth).
Yield growth itself can occur either from intensifying the use of existing technology (for example, using more fertilizer or labor per acre) or from greater efficiency in overall input use (getting more output from a given level of inputs). Greater efficiency in overall input use is known as growth in total factor (input) productivity. This growth is often a result of adopting new technology or farming practices. In a multiple-output sector like agriculture, TFP will also increase if resources are shifted from producing lower valued outputs to higher valued outputs.
Breaking down agricultural growth in this way is intuitive and has some direct relevance for policy, as the two sources of yield growth arise from very different processes. Cropland expansion and input intensification are strongly influenced by resource endowments and relative prices. Increases in rural population or crop prices can induce cropland conversion and more intensive use of existing resources. But in many regions of the world, the ability to bring new cropland into production is severely limited or comes at increasing environmental cost, and in the short run at least, the ability to raise yields through intensification is largely confined to existing technology. Changes in TFP, on the other hand, are caused by changes in technology and efficiency in allocating inputs. The rate of TFP growth will be influenced more by long-term investments in agricultural research, extension, and rural schooling. Market liberalization and increased commercialization can also be sources of TFP growth if they cause producers to shift resources to grow more high-value commodities.
Global Agricultural Productivity Grew from 1961 to 2007 . . .
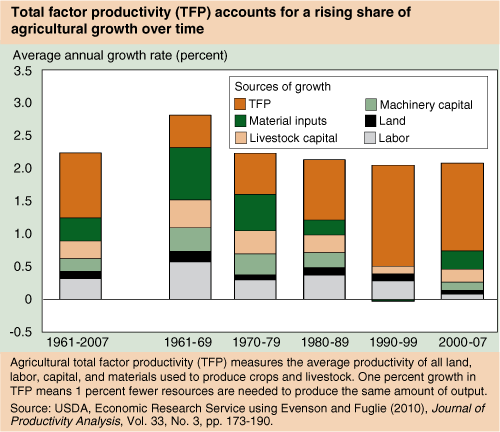
Global agricultural output grew about 2.2 percent annually in 1961-2007, with an exceptionally high growth rate of 2.8 percent per year in the 1960s, followed by average annual growth of 2.0 to 2.3 percent for each decade since the 1970s. Increases in fertilizer use were a leading source of agricultural output growth in the 1960s and 1970s, when Green Revolution cereal crop varieties, which were highly responsive to fertilizer, became widely available in developing countries. Fertilizer use also expanded considerably in the Soviet Union during these decades when fertilizer was heavily subsidized.
The longrun pattern shows that global growth in agricultural production inputs gradually slowed, while the rate of increase in TFP accelerated to maintain real output growth at just over 2 percent per year. Resource expansion in global agriculture was exceptionally low during the 1990s due to the rapid withdrawal of resources from agriculture in the countries of the former Soviet bloc. But many of the inputs used in these countries were apparently not efficiently applied, as their withdrawal significantly increased the average productivity of the resources remaining in agriculture, shown by the high TFP growth rate in the 1990s. By 2000, agricultural resources in the former Soviet Union had stabilized and the rate of global input growth recovered as compared with the rate in the 1990s, but was still markedly lower that input growth in the 1960s, 1970s and 1980s.
. . . But Productivity Growth Varied Across Commodities, Regions
While the world agricultural TFP growth rate has risen, productivity performance across countries and regions has hardly been uniform. The ERS analysis reveals three general patterns in global productivity growth:
- The dissolution of the USSR in 1991 imparted a major shock to agriculture in the countries of the former Soviet bloc. In the 1990s, agricultural resources sharply contracted and output fell significantly. However, by 2000, agricultural resources had stabilized and growth resumed, led entirely by productivity gains in the sector.
- For developing countries as a group, productivity growth began accelerating in the 1980s. Some large developing countries, particularly China and Brazil, have registered robust TFP growth over the past three decades. Other regions have not, however, including Sub-Saharan Africa, West Asia, and the Caribbean. In Sub-Saharan Africa in particular, low agricultural productivity is linked to pervasive poverty and food insecurity.
- In industrialized countries, growth in TFP helped offset a decline in resources employed in agriculture. However, TFP growth averaged only 0.9 percent per year during 2000-07, the slowest of any decade since 1961.
Prospects for Future Agricultural Growth
While the ERS analysis found no evidence of a general slowdown in global agricultural total factor productivity through 2007, there was a slowdown in the growth of resources employed in agriculture. The results have important implications for the appropriate supply-side policy response to increased real agricultural prices in the global economy since 2005. The principal policy lever to increase TFP growth is to boost spending on agricultural research, but the time lags between research investment and productivity growth are long.
The slowdown in the rate of growth in agricultural resources was partly a consequence of declining or low real (inflation-adjusted) agricultural commodity prices between 1981 and 2005. That situation encouraged producers to find better opportunities for their capital and labor outside of agriculture. It is also partly a consequence of the institutional changes in the countries of the former Soviet bloc that precipitated a massive exit of resources from agriculture in the 1990s. The substantially higher real agricultural prices observed since 2005 and renewed agricultural growth in the former Soviet countries should positively affect the rate of global agricultural investment and resource growth. As long as TFP growth continues at its recent pace, the rate of real output growth in global agriculture should increase in the short run.
Despite this generally optimistic conclusion, agricultural productivity growth clearly has been uneven. The evidence suggests that TFP growth may in fact be slowing in developed countries while accelerating in some developing countries. Nonetheless, many developing countries have been unable to achieve or sustain productivity growth in agriculture and, as a consequence, suffer from low levels of rural welfare and food security. While this inability to achieve or sustain productivity growth has not contributed to a slowdown in global TFP growth because the developing countries’ growth rates were never high to begin with, it has led to agriculture performing below its potential and has kept these countries poor. The largest group of countries in this low-growth category is in Sub-Saharan Africa, but the category also includes countries in West Asia and the Caribbean. Strengthening research, extension, and rural education in these countries, as well as maintaining these capacities in more advanced countries, is a requisite for enhancing long-term agricultural productivity growth.
This article is drawn from:
- “Is a Slowdown in Agricultural Productivity Growth Contributing to the Rise in Commodity Prices?”. (2008). ERS. Agricultural Economics 39 (supplement):431-41, 2008.
- “Total Factor Productivity in the Global Agricultural Economy From 1961 To 2006: Evidence From FAO Data”. (2010). ERS. The Shifting Patterns of Agricultural Production and Productivity Worldwide, Midwest Agribusiness Trade and Research Information Center, 2010, pp. 63-95..
You may also like:
- Is U.S. Agricultural Productivity Growth Slowing?. (2010). ERS. Productivity growth, a major determinant of economic expansion, is vital for promoting an improved standard of living. Increasing U.S. agricultural productivity can reduce commodity prices for U.S. consumers and free land, labor, capital, and other inputs for use elsewhere in the economy. .
- ERS Data on Agricultural Productivity in the United States. (2010). ERS. It is widely agreed that increased productivity is the main contributor to economic growth in U.S. agriculture. This data set provides estimates of productivity growth in the U.S. farm sector for the 1948-2008 period, and estimates of the growth and relative levels of productivity across the States for the period 1960-2004. Note that this data series has been revised (see the complete documentation for details, or go to the data tables)..


