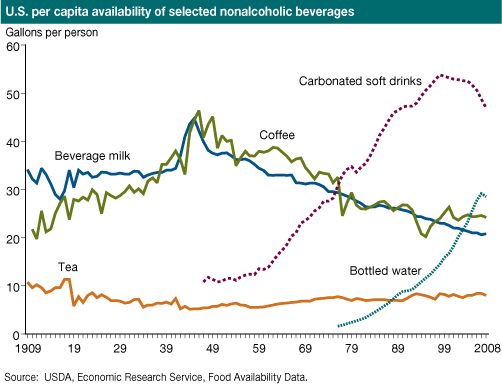
In the Long Run: Milk and Coffee Displaced by Other Beverage Options
- by Jean C. Buzby and Hodan Farah Wells
- 3/1/2010
Per capita availability (a proxy for consumption) of beverage milk and coffee in the United States peaked in the mid-1940s and then gradually declined as consumers took advantage of an ever-increasing selection of beverages. Bottled water availability has skyrocketed since the 1970s, surpassing that of both milk and coffee. In 1977, soft drinks became the most popular beverage. Fruit juice availability has remained relatively stable over time, averaging 8.3 gallons per capita between 1985 and 2008, while fruit drinks, cocktails, and ades grew slightly over this time period, averaging 13.5 gallons per capita.


