Economic Recovery: Lessons Learned From Previous Recessions
- by Timothy Parker, Lorin Kusmin and Alexander Marré
- 3/1/2010
Highlights
- The rates of employment loss and unemployment in the recent recession are about the same in metro and nonmetro areas, but based on previous recessions, nonmetro employment may recover more slowly.
- As in past recessions, manufacturing-dependent nonmetro counties felt the effects of the recession sooner than other nonmetro areas.
- Unemployment rates continue to be lowest for the college-educated in both nonmetro and metro areas.
The recession beginning in December 2007 led to the largest overall job losses and increases in unemployment rates since the early 1980s. Evidence from the four recessions since 1980 provides a possible road map of the pattern of recovery from the most recent recession.
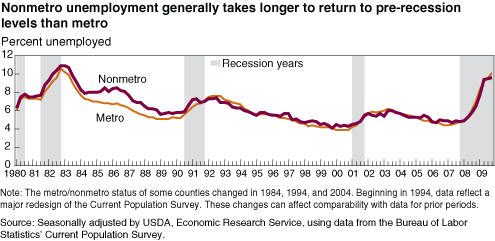
The intensity, duration, and depth of past recessions varied widely across nonmetro and metro areas depending on the recessions’ underlying causes, the shifting industrial structure of local economies over time, and the Federal Government’s economic policy responses. During the 1980 and 1981-82 recessions, for example, nonmetro areas experienced very high unemployment rates and were generally slower to recover from economic downturns than metro areas. In the 1990-91 and 2001 recessions, nonmetro areas fared somewhat better than metro areas. The most recent recession also appears to have affected metro areas more severely.
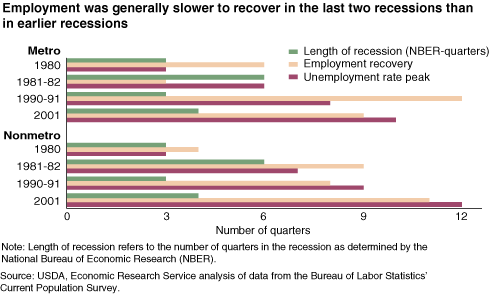
Evidence from earlier recessions suggests that recovery to pre-recession levels of metro and nonmetro employment could be lengthy. The 1990-91 and 2001 recessions were relatively mild. However, because unemployment rates usually continue to rise after a recession has ended, it was 8 to 12 quarters before nonmetro employment and unemployment returned to pre-recession levels.
In past recessions, nonmetro areas have generally taken longer to recover than metro areas. The data suggest that industry mix, as well as demographic factors, play a role in determining how long it takes for metro and nonmetro areas to recover. For example, lower levels of education and less access to the diverse set of job opportunities typically available in metro areas likely led to longer periods of unemployment in past recessions for nonmetro residents.
Nonmetro Areas Fared Better Than Metro in Recent Recessions
The U.S. economy entered into a recession in late 2007 (see “How Recessions Are Determined”). By mid-2008, metro and nonmetro unemployment rates were just over 5 percent. As the recession deepened in late 2008 and early 2009, unemployment rates climbed, reaching 9.6 percent in metro areas and 9.0 percent in nonmetro areas—the highest fourth-quarter unemployment rate for both metro and nonmetro areas since 1982. The overall pace of employment decline was also greater in metro areas (-4.3 percent) than in nonmetro areas (-2.3 percent) between the fourth quarters of 2008 and 2009. High commodity prices and greater nonmetro shares of employment in industries that are faring better than others in this recession, such as mining, education, and health care, may help explain this difference.
The 1990-91 and 2001 recessions were also milder in nonmetro areas than in metro areas. The 2001 recession was comparatively mild and short, lasting only three quarters. Nonmetro areas again fared slightly better than metro areas, although job recovery was slow. Nonmetro employment fell 0.5 percent, compared with 1.1 percent for metro areas. It took about ten quarters for metro and nonmetro employment to reach pre-recession levels. The nonmetro unemployment rate peaked 12 quarters after the beginning of the recession. During the 1991 recession, nonmetro and metro employment declined 0.9 percent. Recovery times were shorter than after the 2001 recession—six quarters for nonmetro areas and five quarters for metro areas.
Nonmetro and metro employment and unemployment were more sharply affected by the back-to-back 1980 and 1981-82 recessions. Together they lasted 24 months, resulting in slow job growth and high unemployment in nonmetro and metro areas. Nonmetro and metro unemployment peaked in the fourth quarter of 1982 at 10.9 percent and 10.6 percent, respectively. The metro unemployment rate did not fall to pre-1980 recession levels until 1987; nonmetro recovery took until 1988.
Nonmetro employment fell by 1.1 percent from peak to trough during the 1981-82 recession, compared with a 1.6-percent increase in metro areas. The nonmetro unemployment rate did not begin to fall until seven quarters after the beginning of the 1980 recession. Unemployment rates often do not decline until after a recession has officially ended because businesses do not begin to hire until there is a clear indication that the economy is improving.
Unemployment Rates Vary by Sector and Skill Level
Two factors help explain unemployment during recessionary periods since the 1980s. First, improvements in and increased adoption of labor-saving technology, coupled with increasing globalization, have contributed to a shift away from producing goods in the U.S. to providing services. In several recessions since 1980, employment in the manufacturing and other goods-producing industries of the U.S. economy has fared poorly. Nonmetro counties with a large share of employment in the education, health care, leisure and hospitality, and public administration sectors should fare better during the most recent recession than nonmetro counties dependent on manufacturing.
Recessions affect industries and sectors of the economy in different ways. For example, in the most recent recession, employment in construction, transportation and utilities, finance, and mining has significantly decreased in both metro and nonmetro areas. In the 2001 recession, industries that were more concentrated in metro areas, such as high technology and finance, were particularly affected. During the 1991 recession, nonmetro areas fared about the same as metro areas in most industries. In the 1980 and 1982 recessions, nonmetro employment declined in major goods-producing industries, such as manufacturing, construction, and mining. These losses were offset by employment gains in the service and government sectors of the economy.
A second and related factor helping explain unemployment during recessionary periods is the increasing demand for highly skilled labor. This trend affects both nonmetro and metro areas. Unemployment rates are consistently lower for workers with a college education than for those who have completed only high school or less. In both nonmetro and metro areas, the unemployment rate for those without a high school diploma is high, 13.7 percent and 14.9 percent, respectively. These workers were most affected by the recessions that impacted goods-producing industries. Between the first quarter of 1980 and the fourth quarter of 1982, the unemployment rate for nonmetro workers without a high school diploma increased by 5.2 percentage points to 12.7 percent. At the bottom of the 1991 recession, metro and nonmetro workers without a high school diploma fared roughly the same, as the recession affected automobile manufacturing, construction, and related industries.
While recessionary unemployment rates were always lower for those with more education, the two most recent recessions did significantly affect the employment prospects for the college-educated. For example, the technology and finance sectors employ many highly skilled college-educated workers and are more concentrated in metro areas. The unemployment rate for metro college-educated workers increased from 2.3 to 3.5 percent between the first and fourth quarters of 2001. In contrast, the unemployment rate for nonmetro college-educated workers decreased from 2.2 to 1.8 percent during the same period. This decrease is likely due to increased employment in state and local government, public and private education, and health services. These sectors employ a significant proportion of college-educated workers in nonmetro areas.
The same pattern holds for the most recent recession. The unemployment rates for college-educated workers in the fourth quarter of 2009 were 4.8 percent in metro areas and 3.1. percent in nonmetro areas.
Intensity and Duration of Recessions Vary Across Nonmetro Areas
Although recessions are economy-wide, local areas are affected differently. Diversity is a key feature of nonmetro areas and a factor in their vulnerability to fluctuations in national economic conditions. Nonmetro locations differ from each other and from metro areas in a variety of ways, such as industrial structure, demographic conditions, and level of economic well-being (see “What Is Nonmetro?”).
Analyzing counties classified according to their economic base, demographic makeup, or socioeconomic status provides another measure of how recent recessions affected nonmetro areas. ERS county classifications identify farming-dependent, mining-dependent, manufacturing-dependent, government-dependent, and services-dependent nonmetro counties, as well as persistent poverty and retirement destination counties (see the ERS topic “Rural Classifications”).
Nonmetro Manufacturing Counties Hardest Hit by Recessions
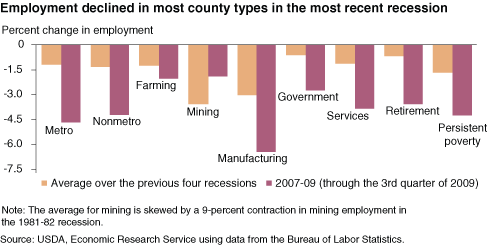
In the most recent recession, metro areas experienced slightly larger employment declines than nonmetro areas, but unemployment in nonmetro areas varied considerably depending on the economic base. Nonmetro counties classified by ERS as heavily dependent on manufacturing, for example, showed the largest employment decline among nonmetro areas—they lost more than 6 percent of all their jobs from a peak in the first quarter of 2007 to the third quarter of 2009.
This finding is consistent with that of past recessions. Nonmetro manufacturing counties were the most affected among the county groups in the recessions of 1980 and 2001 and ranked second behind mining-dependent and persistent poverty counties in the 1981-82 and 1990-91 recessions. Employment in manufacturing-dependent counties fell by at least 3 percent in each of these recessions except for 1990-91, a mild recession in nonmetro counties. This pattern, in turn, is consistent with the known cyclical sensitivity of durable-goods manufacturing and also with the general downward trend in the manufacturing sector’s share of national employment over the past 30 years.
Using changes in unemployment rates rather than in employment levels to compare the intensity of recessions across nonmetro counties yields a similar picture: manufacturing-dependent counties were generally more affected by national recessions than the average for all counties. In the most recent recession, the unemployment rate in nonmetro manufacturing-dependent counties rose 6.2 percentage points from the second quarter of 2007 through the third quarter of 2009 to 11.6 percent. Unemployment in nonmetro counties as a whole increased 5.0 percentage points to 10.0 percent.
Employment declines began in manufacturing counties earlier than in other nonmetro areas in the last two recessions. Nonmetro manufacturing county employment declined over 3.7 percent between the first quarter of 2000 and the third quarter of 2003 (interrupted by a slight upturn during 2002).
Employment declines in the most recent recession began in early 2007 for nonmetro manufacturing-dependent counties while in most other nonmetro counties the declines did not occur until 2008. Nonmetro manufacturing-dependent county employment also began falling two quarters earlier than the official start of both the 1981-82 and 1990-91 recessions.
Nonmetro Counties Not Dependent on Manufacturing Lost Less Employment
Service-dependent counties lost nearly 4 percent of their employment between the second quarter of 2008 and the third quarter of 2009. Persistent poverty counties lost more than 4 percent between late 2006 and late 2009. Employment losses were slightly smaller in retirement-destination counties, and smaller still in government-dependent, mining-dependent, and farming-dependent counties. Counties in most of these categories also suffered smaller percentage employment losses (or in some cases, none at all) in most past recessions.
Mining counties, however, experienced higher job losses than the nonmetro average in the 1991 recession. Similarly, from the fourth quarter of 1981 to the second quarter of 1983, mining counties saw a 9-percent loss in employment, the steepest drop experienced over the last 30 years by any county type. Even in the nonrecession years of 1984-86, mining-dependent counties dropped more than 12 percent.
Recovery Is Expected To Be Slow
Nonmetro manufacturing counties have generally been harder hit by recent recessions than other nonmetro counties. Nonetheless, they do not appear to be disproportionately affected by persistent recessionary conditions. In the past four completed recessions, employment in nonmetro manufacturing counties began to recover in the same quarter as employment in all nonmetro counties. This pattern suggests that when the recession ends in nonmetro America, some employment recovery will be seen in the manufacturing counties as well, although the higher proportion of these jobs in nonmetro areas will slow their recovery.
This article is drawn from:
- Employment & Education. (n.d.). U.S. Department of Agriculture, Economic Research Service.
- Kusmin, L. (2009). Rural America At A Glance, 2009 Edition. U.S. Department of Agriculture, Economic Research Service. EIB-59.
You may also like:
- Rural Classifications. (n.d.). U.S. Department of Agriculture, Economic Research Service.
We’d welcome your feedback!
Would you be willing to answer a few quick questions about your experience?


