Measures of Farm Household Well-Being Tell Different Stories
- by Carol Jones and Daniel Milkove
- 3/1/2010
Traditionally, the economic well-being of households is gauged by indicators of the financial resources available—household income and, when available, wealth. ERS publishes estimates of farm household income and wealth based on responses to USDA’s annual Agricultural Resource Management Survey (ARMS). Since 1998, average farm operator household income has exceeded that of the typical U.S. household by 3 to 21 percent, and median farm household wealth has been 4-5 times that of all U.S. households. But the variability of income complicates farm-nonfarm comparisons.
A complementary approach examines the household’s standard of living, as measured by its consumption of goods and services. For the first time, ERS has estimated the annual consumption of farm households, using new survey questions in ARMS. The extent to which consumption and income tell a similar story about relative household well-being depends on the stability of a household’s income and its access to resources other than income, such as wealth.
Households create long-term income expectations based on their lifetime earning capacity and financial wealth and strive to maintain a consistent standard of living over time based on these expectations. For households with higher income variability, changes in current income are more likely to be temporary; and when substantial wealth is available, households temporarily receiving lower incomes can draw down savings to maintain their standard of living.
Farmers, for example, generally not only have higher wealth than the typical U.S. household but also have more variable household income. Farm self-employment income tends to fluctuate more from year to year than wage and salary income, due to unexpected variations in yields and prices.
Consequently, when farm household income is unexpectedly high, farm households may be less inclined to expand discretionary purchases than similar households with more stable sources of income. On the other hand, when farm household income is unexpectedly low, farm households may be less inclined to cut back essentials.
Measuring Consumption, Comparing Farm and Other Households
Household living expenditures data are collected for farm households in ARMS and, for all U.S. households, in the Bureau of Labor Statistics’ Consumer Expenditure Survey. ERS analysts made several key adjustments to expenditures to calculate current household consumption, a measure that more closely reflects household standard of living.
For example, for housing and motor vehicles, which last many years, ERS substituted market rental values for expenditures to capture the annual value of services. Actual expenditures will vary with the financial terms of loans, including size of the down payment, and drop to zero when loans are paid off (or when goods are purchased outright) though the value of services provided continues. For housing, farm household expenditures are substantially lower than consumption because three-quarters of farm households lived in a residence owned by the farm and thus incurred no shelter outlays.
Household consumption estimates also do not include expenditures on personal insurance and retirement plans, because they provide resources for future, rather than current, consumption; nor do they include charitable contributions or child support/alimony, which provide resources to other households.
After these adjustments, total consumption is similar on average for farm and nonfarm households—though component shares vary, notably for housing and health care.
Distributions of Income and Consumption Differ for Farm Versus All U.S. Households
The well-being associated with a given level of consumption or income depends upon household size. Consequently, ERS analysts compared per person equivalent-consumption and income measures to account for differences in household size. The adjustment assumes that for households to have an equivalent standard of living, income and consumption are, for example, 41 percent more for two-person households and 73 percent more for three-person households, relative to a single-person household.
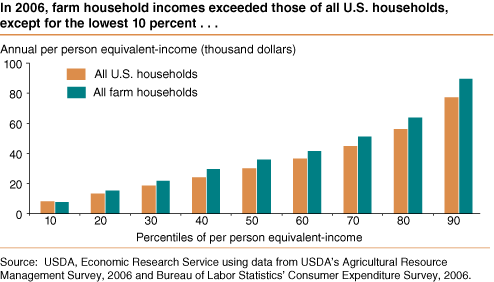
To compare the distributions of income, ERS ranked households by the level of their per person equivalent-income, going from lowest to highest. Equivalent-income at the 10th percentile among farm households is $8,000, meaning that 10 percent of farm households have per person equivalent-income lower than $8,000 and 90 percent have higher equivalent-income.
Equivalent-income was consistently higher for farm households, with the single exception being at the 10th percentile of the farm population, where farm households have lower income than all U.S. households. The lowest 10 percent includes the 6 percent of farm households, and the 0.1 percent of all U.S. households, with negative income.
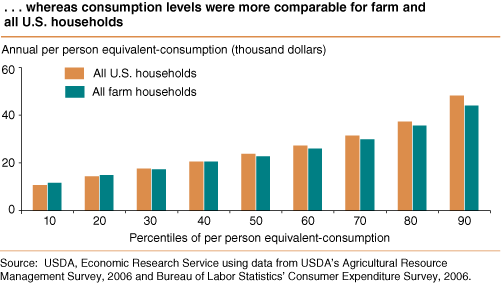
The distribution of farm household consumption is comparable to that of all U.S. households. However, as predicted, among lower-income households, the per person equivalent-consumption is higher for farm households than for all U.S. households; and among higher income households, the per person equivalent-consumption is lower for farm households than for all U.S. households.
These results suggest that relying on income alone to measure the well-being of farm households may provide an incomplete picture. A richer set of indicators is more informative, particularly when incomes are highly variable from one year to the next.
This article is drawn from:
- Jones, C., Milkove, D. & Paszkiewicz, L. (2010). Farm Household Well-Being: Comparing Consumption- and Income-Based Measures. U.S. Department of Agriculture, Economic Research Service. ERR-91.
We’d welcome your feedback!
Would you be willing to answer a few quick questions about your experience?


