Several School Policies Are Associated With Less Fat in School Lunches
- by Constance Newman
- 6/1/2010
In 2009, 31 million children participated in USDA’s National School Lunch Program. Most schools serving lunches met the basic nutrient standards required by USDA for vitamins, protein, calcium, and iron. In 2005, however, only one in five schools served lunches that met the standard for total fat, set at 30 percent or less of a meal’s calories.
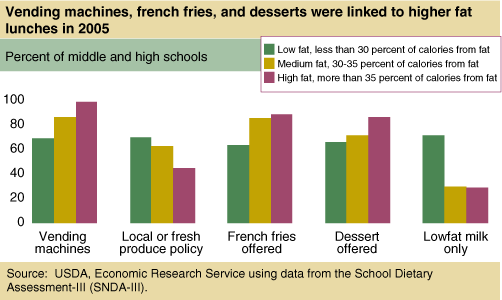
Using data from a 2007 study sponsored by USDA’s Food and Nutrition Service, ERS found that the fat content of school lunches is correlated with certain school policies and characteristics. For example, schools that served the lowest fat lunches offered only low-fat milk and/or participated in at least one program promoting purchases of locally grown food or fresh produce. In contrast, middle and high schools with the highest fat lunches served french fries or dessert at least once a week as part of the USDA lunch.
Meal planning methods also were linked to the fat content of lunches. In the traditional “food-based” method, each meal consists of certain foods such as meat, vegetable, or starch. Some schools use a nutrient-based method to plan lunches according to the nutrient content of foods. Others rely on an “enhanced food-based” plan that combines the food-based method with more fruit and vegetables. The food-based method was used more by elementary and middle/high schools with the highest fat lunches. Middle and high schools with the lowest fat lunches were more likely to use the enhanced method.
Other school district policies, such as allowing vending machines that compete with school meals for students’ appetites, can indirectly affect USDA lunches by possibly spurring lunch planners to include less healthy options to attract students. Middle and high schools that served higher fat lunches were more likely to have vending machines. Elementary schools serving lunches with medium-fat levels were more likely to offer a la carte items purchased separately from the lunch line than elementary schools with the lowest fat lunches. A la carte foods were offered by 78 percent of elementary schools and 82 percent of middle/high schools.
Of the school characteristics examined, including the percent of students receiving free and reduced-price lunches, the school district’s child poverty rate, school size, and region, only urbanicity mattered. Schools with the lowest fat meals were more likely to be in urban areas, and schools with the highest fat meals were in rural areas.
This article is drawn from:
- Newman, C., Guthrie, J., Mancino, L., Ralston, K. & Musiker, M. (2009). Meeting Total Fat Requirements for School Lunches: Influence of School Policies and Characteristics. U.S. Department of Agriculture, Economic Research Service. ERR-87.


