The Two Faces of Rural Population Loss Through Outmigration
- by David McGranahan, John Cromartie and Tim Wojan
- 12/1/2010
Highlights
- Over a third of nonmetropolitan counties lost more than 10 percent of their population over the past 20 years through net outmigration.
- Poverty and low education account for the high net outmigration in some of these counties, but most are relatively prosperous. Their outmigration is related to low population density, geographic isolation, and a lack of scenic amenities.
- Programs that reduce the disadvantages of geographic isolation and that enhance residents’ access to scenic amenities could help slow or reverse net outmigration in many nonmetro counties.
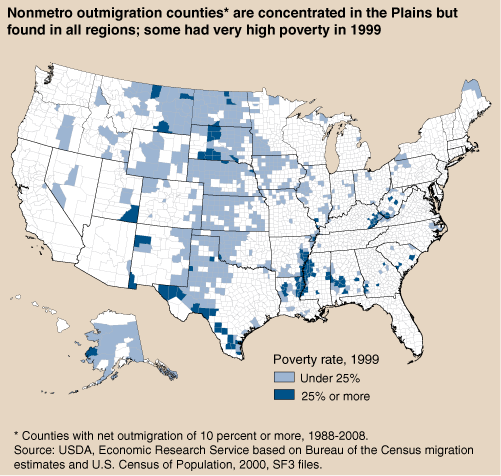
Population loss is endemic to many rural areas. Nearly half of the Nation’s 2,050 nonmetropolitan counties lost population through net outmigration between 1988 and 2008; for over 700 counties, this loss exceeded 10 percent. In counties with a long history of high outmigration, the loss is often exacerbated by “natural decrease,” an excess of deaths over births due to an aged population. Rural depopulation is a continuing concern in the rural policy community, and repopulating rural communities is one of the goals of USDA’s Strategic Plan for 2010-2015.
What makes nonmetro high net outmigration counties different from other nonmetro counties? Research results suggest that no single set of characteristics differentiates high outmigration counties. Some outmigration counties have populations with low education, high unemployment, and high poverty; most, however, have relatively well-educated populations and below-average unemployment rates. Their high outmigration appears related to geographic isolation and a lack of natural amenities.
Poverty Does Not Drive Outmigration in Most Counties
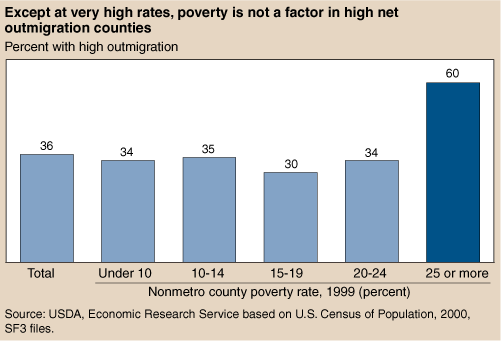
ERS researchers began with an examination of the relationship between poverty and high net outmigration. High net outmigration might be expected in areas with above-average poverty rates, since poverty suggests a lack of economic opportunity. The working-age population in particular is likely to react to economic opportunity in deciding where to live. In 1988-2008, however, this relationship held only in counties with poverty rates above 25 percent. While 60 percent of these “high-poverty” counties had high net outmigration, poverty rates below 25 percent had no apparent relevance, indicating that different factors underlie high net outmigration in most nonmetro areas. The analysis that follows distinguishes the 733 nonmetro high net outmigration counties (hereafter labeled “outmigration counties”) according to whether their poverty rates were 25 percent or more (167 high-poverty counties) or lower (626 low-poverty counties).
About half of the low-poverty outmigration counties were located in the Great Plains, where they comprise nearly 80 percent of nonmetro counties. The area of low-poverty outmigration extends east of the Great Plains into the agricultural counties of Iowa, Illinois, and southwestern Minnesota. High-poverty outmigration counties often had large minority populations—Native Americans in the Northern Plains, Hispanics in southern Texas, and Blacks in the Mississippi Delta and across the Cotton Belt. Some Appalachian Highland counties in Kentucky and West Virginia also had high poverty combined with high outmigration.
All Rural Areas Lose Young Adults, But Most Gain Families and Retirees
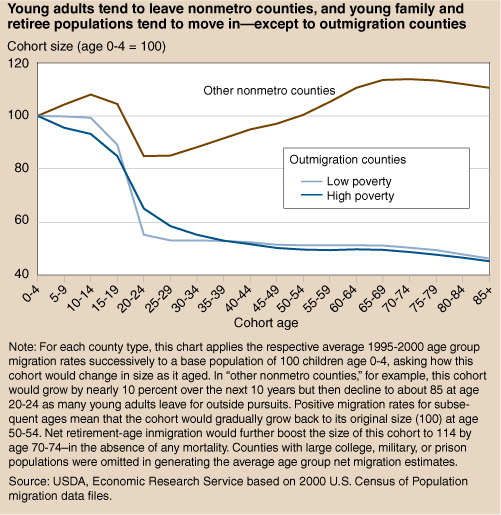
One way to gain insight into factors underlying high net outmigration is to divide the population into age cohorts—groups born in particular time spans—and examine the net migration of each cohort. For instance, a positive 1995-2000 net migration of children age 0-4 in 1995 (and 5-9 in 2000) indicates that young families are being attracted to an area. By examining the migration patterns of each age cohort in 1995-2000, one can better understand how a typical nonmetro county is affected by net migration over its population’s life cycle.
Rural communities see many of their young adults leave after high school, often to further their education or join the Armed Forces. To maintain their population size, these communities need to attract other age cohorts, such as young families with children, midlife career changers, or retirees. In 1995-2000, most nonmetro counties tended to gain through the net inmigration of children through age 14 (as young families with children moved in) but then lose young adults through age 24 (as young adults left for college and other pursuits). As adults finish school or begin settling down at around age 30, inmigration in the typical nonmetro county (other than high outmigration counties) increases and continues doing so through retirement age, before declining after age 74.
The migration pattern in low-poverty outmigration counties reveals a starkly different picture. Typically, there was no net inmigration of children and much larger outmigration of young adults. Consistent with the pattern for children, the middle-aged population shows little change due to net migration. Families are generally not leaving, suggesting that economic opportunities are adequate for existing residents. Retirement-age population also shows little net change. Since people at this age are less dependent on the local economy than younger people are, this lack of inmigration suggests that the low-poverty outmigration counties are less attractive than other nonmetro counties as places to live.
The high-poverty outmigration counties present a still different picture. They tended to lose not only young adults, but families with children as well, consistent with the limited economic opportunities represented by high poverty rates. As with the low-poverty outmigration counties, these counties also showed no gain in the retirement age population, suggesting that these counties, too, lack the amenities found in other nonmetro counties. In this case, the high-poverty environment itself may discourage retirees from migrating to the area.
Return migration is a major component of inmigration to rural communities, especially among migrants in their late 20s and 30s. They are often returning home to raise families. The proportion of outmigrants who return at this life stage is lower in outmigration counties than in other nonmetro counties, but the returnees represent 85 percent of the inmigrant pool in high-outmigration counties, compared with 66 percent in other nonmetro counties. This confirms the wisdom of several States’ focus on return migrants to repopulate rural areas undergoing substantial population loss. These counties are unlikely to attract migrants who lack pre-existing social ties to the area.
Low- and High-Poverty Outmigration Counties Differ From Other Nonmetro Counties, But in Highly Distinct Ways
Comparisons of outmigration counties with other nonmetro counties across a range of characteristics reinforce the idea that rural population loss through high net outmigration does not stem from a single set of conditions. Migration to the low-poverty outmigration counties is limited primarily by their geography and the scenic amenities they offer. Over half of these counties have fewer than 10 residents per square mile, and two out of three are not adjacent to a metro area. ERS research has shown that pleasant landscapes are associated with population gain through migration: 70 percent of the low-poverty outmigration counties fall in the bottom third on a composite measure of landscape attractiveness. Lack of forest is a major reason for the low landscape scores, as nearly two-thirds of these counties have less than 5 percent forest cover. Most of these counties have extensive farmland and very little public land. However, socioeconomic conditions in low-poverty outmigration counties are similar to those in other nonmetro areas. With relatively low unemployment (in 2000), economic conditions should not be forcing people to leave low-poverty outmigration counties. Nonetheless, prospective young inmigrants may not see much future for advancement in small, declining economies with few compensating residential amenities.
Over 40 percent of the low-poverty outmigration counties were classified as farm dependent in 2000, compared with less than 9 percent of the other nonmetro counties. Given that many of the other nonmetro counties have over 50 percent farmland, this difference appears to reflect the absence of other activities such as manufacturing and recreation in the low-poverty outmigration counties rather than a disproportionately high presence of agriculture.
Although their geography and landscape are not as attractive as those of other nonmetro counties, the central issue for high-poverty outmigration counties appears to be lack of economic opportunity. Over 30 percent of the working-age populations in these counties do not have a high school diploma or equivalent—double the proportion in the low-poverty outmigration counties. Even with the high outmigration of young adults, 19 percent of the residents in their 20s were unemployed—twice the rate in other nonmetro counties. Median household incomes were only two-thirds the level found in other nonmetro counties.
| County characteristics | Other nonmetro | Outmigration counties: low poverty |
Outmigration counties: high poverty |
|---|---|---|---|
| Percent of category counties with condition | |||
| Geography | |||
| Under 10 residents per square mile | 14.1 | 50.8 | 30.8 |
| Not adjacent to a metro area1 | 37.7 | 67.6 | 64.5 |
| Landscape (1996) | |||
| Bottom third on landscape score2 | 16.3 | 70.0 | 31.1 |
| Under 5% forestland (1996)3 | 12.0 | 61.9 | 29.2 |
| Over 50% farmland (1997)4 | 41.4 | 83.8 | 56.6 |
| Public land under 2% of total land (1996)2 | 42.9 | 73.9 | 56.6 |
| Economic type (2000)5 | |||
| Farm dependent | 8.5 | 42.2 | 25.2 |
| Manufacturing dependent | 35.1 | 17.6 | 11.2 |
| Recreation county | 19.0 | 5.0 | 5.0 |
| Demography | |||
| Natural population decrease | 26.7 | 46.2 | 8.4 |
| Minority population over 50% | 3.6 | 3.0 ns | 58.9 |
| Average | |||
| Education (age 25-64, 2000) | |||
| No high school degree (%) | 19.3 | 14.9 | 30.1 |
| College diploma (%) | 15.7 | 16.8 | 12.6 |
| Socioeconomic conditions | |||
| Employment rate (age 21-64) (%) | 70.8 | 75.2 | 58.7 |
| Unemployment rate (age 20-29) (%) | 8.9 | 7.8 | 19.0 |
| Median household income ($1,000) | 32.9 | 31.9 | 22.8 |
| Median value of single family houses ($1,000) | 81.1 | 54.9 | 50.0 |
| Number of counties | 1,317 | 626 | 107 |
| Note: Unless otherwise noted, 2000 Census of Population data files are the original data source. Differences from “other nonmetro” counties are significant at p<.05 level unless noted with “ns.” For each set of outmigration counties, the five factors most distinguishing them from other nonmetro counties are bold underlined (based on Wald statistic tests). 1Source: ERS 2004 rural-urban continuum codes. 2Scale based on water area (lakes, ponds, and ocean), topographic variation, forest, and crop covers, weighted by strength of relation to nonmetro county net migration in 1990-2000, net of other factors (see McGranahan, 2008). 3Source: USDA, Economic Research Service, based on USDA, Forest Service inventory data, 1997. 4Source: USDA, Economic Research Service, based on Census of Agriculture, 1997, data files. 5Source: USDA, Economic Research Service 2004 county economic typology. |
|||
Attracting Managers and Professionals to Outmigration Counties Can Be a Major Problem
In a 1996 ERS survey of rural manufacturers, respondents were asked which of 21 local factors created problems for their ability to compete. The list included items related to infrastructure and access to customers and suppliers, but most of the factors reported as major problems by large numbers of respondents involved human capital in one form or another. Given that global competitive pressures have increased since 1996 and many rural manufacturing jobs have been lost, these problems are unlikely to have abated.
Manufacturers in low-poverty outmigration counties cited the quality of labor most often as a major problem, although the proportion citing this problem was significantly smaller (29 percent) than in other nonmetro counties (35 percent). Manufacturers who pay higher wages tend to cite this problem less often, so the issue is in part whether manufacturers can afford to pay for the quality of labor they need. The other major drawback for manufacturers in low-poverty outmigration counties was the low attractiveness of the area to managers and professionals, reported as a major problem by one of every four manufacturers, nearly twice the frequency found in other nonmetro counties. In general, this problem was cited most often in counties where population density, landscape attractiveness, and educational attainment are low. The first two conditions are typical of the low-poverty outmigration counties.
Human capital was the overwhelming issue for manufacturers in high-poverty outmigration counties. The quality of local schools was cited as a major problem by 41 percent of the manufacturers, followed by the quality of available labor, the area’s attractiveness to managers and professionals, and access to training courses. While they result in a low-skilled local labor force, poor quality schools can also create difficulties in finding upper-level employees. About 85 percent of the manufacturers in the high-poverty outmigration counties who reported low area attractiveness to managers and professionals as a major problem also cited poor local school quality as a major problem.
| Local factor | Other nonmetro counties | Outmigration counties1: low poverty |
Outmigration counties1: high poverty |
|---|---|---|---|
| Percent of manufacturers reporting problem as major | |||
| Quality of available labor | 35.4 | 28.8 | 30.1 |
| State and local taxes | 23.2 | 19.9 | 19.7 |
| Environmental regulations | 22.6 | 21.9 | 19.8 |
| Attractiveness of area to managers and professionals | 13.5 | 24.9 | 28.0 |
| Access to training courses | 9.7 | 7.8 | 19.9 |
| Quality of local schools | 9.5 | 8.0 | 41.4 |
| Number of respondents | 1,757 | 394 | 67 |
| 1Statistically significant differences (p<.05) from other nonmetro counties are in bold underline, based on Wald statistic tests. Source: USDA, Economic Research Service based on ERS Rural Manufacturing Survey, 1996. |
|||
Jobs Help, But Reducing Net Outmigration Is Also About Attracting People
Much attention given to stemming outmigration focuses on job creation, particularly through local entrepreneurship. While certainly relevant, particularly in the current economy, it is not clear that job creation itself addresses the basic drivers of high net outmigration. In most high-poverty outmigration counties, the basic problem appears to be poor schools. Poor schools lead to an underskilled labor force and discourage potential high-skill inmigrants concerned about their children’s schooling. The fact that manufacturers in these counties frequently reported the attractiveness of the area to managers and professionals as a major problem suggests that these counties are unlikely to attract talented entrepreneurs as new or return migrants. Schooling is not typically a rural development issue, but it is difficult to see how sustained growth in high-poverty outmigration counties could be achieved without attention to local education systems.
In the low-poverty outmigration counties, schools are not an issue. Indeed, their good schools are likely a major reason that so many young adults are able to leave these counties for further education and employment elsewhere. Compared with other nonmetro counties, these outmigration counties are typically more remote from large urban areas, more thinly settled, and more lacking in the ingredients of attractive landscapes.
USDA has a long history of redressing problems of remoteness and small size, most notably with the formation of rural electric cooperatives and rural telephone services. A current concern, expressed in the Department’s 2010-2015 Strategic Plan, is to ensure that rural populations have access to affordable broadband. ERS researchers have found that counties with early broadband accessibility grew more than similar counties without such accessibility (see “Broadband Internet Service Helping Create a Rural Digital Economy” in the September 2009 issue of Amber Waves). Other initiatives include long-distance learning and telemedicine (see also “Taking the Pulse of Rural Health Care” in the same issue).
The rural outdoors is an important rural development asset, attracting not only tourists and second-home owners, but also people seeking an attractive environment in which to raise a family, switch from hectic urban careers, or retire. While the concept of “ecosystem services” is usually applied to benefits such as clean water, carbon sequestration, or pollination of crops by bees, it extends to the enjoyment of nature by visitors and residents. USDA’s largest environmental improvement effort, the Conservation Reserve Program (CRP) pays farm owners to retire environmentally sensitive land from production. In 2002, an average of 2.5 percent of nonmetro county land was enrolled in the CRP, with larger shares in the outmigration areas in the center of the country. Eligibility is based on benefits to air and water quality, reduction in soil erosion, wildlife habitat provision, and enduring benefits, such as the planting of trees.
Although no explicit attention is currently given to rural development impacts, CRP lands appear to be generating economic benefits by increasing recreation—most likely through improved wildlife habitat. This recognition has induced a number of States to initiate programs to supplement CRP payments for farmers who allow public access to their land for recreation—often with hunting and fishing in mind. A new USDA Voluntary Public Access and Habitat Incentive Program supports these State initiatives. These and other extensions may serve to reduce the difficulty in attracting both return migrants and new residents to an area by enhancing its appeal as a place to live and work.
This article is drawn from:
- McGranahan, D., Cromartie, J. & Wojan, T. (2010). Nonmetropolitan Outmigration Counties: Some Are Poor, Many Are Prosperous. U.S. Department of Agriculture, Economic Research Service. ERR-107.
We’d welcome your feedback!
Would you be willing to answer a few quick questions about your experience?


