Taking the Pulse of Rural Health Care
- by Carol Jones, Timothy Parker and Mary Ahearn
- 9/1/2009
Highlights
- Rural households have higher rates of mortality, disability, and chronic disease than urban households, even after taking into account the different age distributions of the two populations.
- Rural households have less access than urban households to affordable, nearby, high-quality health care.
- Adoption of new health information technologies, promoted by a $19 billion allocation in the 2009 economic stimulus package, holds promise for improving coordination among geographically dispersed health care providers.
- Listen to an interview with an author (7 minutes, 16 seconds).
Reforming the U.S. health care system is high on the national policy agenda. Debate over U.S. health policy has focused on expanding health insurance coverage, improving the quality of health care, and reducing costs. These three goals are interrelated because lack of insurance coverage and poor coordination of services across care providers tend to drive up costs.
Within this broader context, rural households confront special health care challenges due to their lower socioeconomic status, higher average age, and greater geographic dispersal than the U.S. population as a whole. Rural households, on average, have less education and fewer financial resources, both of which are associated with lower health status. Approximately 15 percent of rural residents (compared with 12 percent of urban residents) are age 65 or older, which leads to a greater incidence of chronic disease and disability. Lower population densities in rural areas mean that residents must typically travel longer distances for health services, especially for specialty care.
The Gap Between Rural and Urban Mortality Rates Is Increasing
It has been widely observed that rural populations have higher rates of disability and chronic diseases than their urban counterparts. Research published in the American Journal of Public Health found that a gap opened between metro and nonmetro mortality rates about 1990. Mortality rates are a key indicator of health status when they are adjusted for age (since mortality increases with age beyond early childhood). Age-adjusted mortality rates of both metro and nonmetro counties declined about 1.5 percent per year from 1968 through 1989. However, the nonmetro decline in age-adjusted mortality slowed markedly compared with the metro trend beginning in 1990. As a result, the average annual difference in mortality rates between nonmetro and metro areas increased from approximately 6 additional deaths per 100,000 population in nonmetro areas in 1989 to 82 more deaths per 100,000 population in 2005.
Nonmetro counties can be further segmented into micropolitan (micro) counties—larger counties that include urban clusters with between 10,000 and 50,000 people—and the more remote, less densely populated noncore counties—those not part of an urban cluster of at least 10,000 people. Nationally, the mortality rate increases as the level of urbanization declines, with metro counties having the lowest mortality rate and noncore counties having the highest rate. But the level of divergence between metro and nonmetro counties varies within each region. The South had the greatest metro-nonmetro difference in mortality rates in 2005, while there was essentially no difference across metropolitan, micropolitan, and noncore counties in the Midwest. Spatial statistical analysis of high- and low-mortality rates clusters indicates that higher county mortality rates are associated with high persistent-poverty rates, high percent of Black or Appalachian population, and low rates of high school graduation.
| U.S. region | Total | Metro | Nonmetro: total |
Nonmetro: micro |
Nonmetro: noncore |
|---|---|---|---|---|---|
| Number of deaths per 100,000 population | |||||
| Northeast | 762.7 | 757.2 | 809.0 | 804.5 | 820.9 |
| Midwest | 813.0 | 813.5 | 814.1 | 816.4 | 812.9 |
| South | 845.6 | 818.7 | 938.8 | 922.5 | 960.6 |
| West | 737.4 | 730.0 | 796.7 | 799.5 | 792.3 |
| Total | 798.8 | 784.2 | 866.1 | 857.1 | 880.0 |
| Among nonmetro counties, micropolitan counties are centered on urban clusters with populations between 10,000 and 50,000, and noncore counties have no nearby urban clusters with a population of 10,000 or more. Source: USDA, Economic Research Service using National Center for Health Statistics Compressed Mortality File, 2005. |
|||||
Rural Households Have Less Access to Health Care
Insurance coverage and financial affordability, as well as geographical availability, are important components of access to health care. Lack of health insurance creates a range of consequences, including increased illness and death, and greater financial burdens. In addition to protecting households against the financial risks imposed by expensive and unanticipated medical events, health insurance coverage tends to increase timely access to health care, including preventive care, diagnostic tests, and prescriptions, which can help avoid escalation of health problems. As a result, broader health insurance coverage may reduce U.S. health care costs for chronic care, for example, by preventing avoidable hospitalizations for chronic conditions, such as congestive heart failure or uncontrolled diabetes.
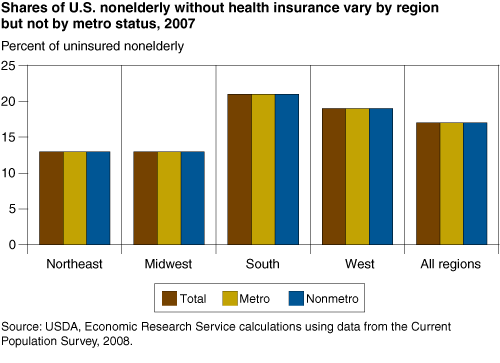
About 17 percent of all nonelderly individuals nationwide lack health insurance. Coverage rates are comparable for metro and nonmetro residents. (Because Medicare coverage starts at age 65, only a very small share of the elderly is uninsured.) Nonmetro coverage was lower as recently as the 1990s, and individuals in the more remote (noncore) counties still have lower coverage than urban residents. However, regional location appears to have more impact than rurality, with the Northeast and Midwest having consistently higher rates of health insurance coverage than the South and the West.
Though metro and nonmetro insurance coverage rates may be comparable, nonmetro residents still spend a larger share of household income on out-of-pocket health expenditures (for health care and health insurance premiums) than metro residents. Overall, for those under age 65, household health expenses exceeded 10 percent of after-tax income in 2005 for 24 percent of nonmetro households and 18 percent of metro households. While both metro and nonmetro households of the nonelderly spend on average about $3,300 per year on out-of-pocket health expenses, nonmetro households have lower average incomes.
Most households in both metro and nonmetro areas are covered by employment-based insurance. The rural economy has a disproportionate share of small businesses, which tend to pay lower wages and are less likely to provide health insurance coverage. Due to their different economic circumstances, nonelderly nonmetro households have lower rates of employment-based coverage and higher rates of public health insurance coverage than nonelderly households in metro areas.
Since most proposed or enacted employer-based reforms as of mid-2009 have excluded small businesses, health reform options expanding public insurance may have more impact in rural areas than reform based on expanding employment-based insurance. The nonmetro uninsured are more likely than the metro uninsured to have low income and to have a household member covered by Medicare, Medicaid, or the Children’s Health Insurance Program.
For rural populations, geographical access is also a major issue. Due to low population densities and small patient volumes, the rural health care model—particularly in smaller and more remote counties—focuses on providing primary care and emergency care locally. For specialized care, patients are referred to (often distant) regional health care centers. The referral system imposes higher travel costs on rural patients and may result in fragmented care if followup treatment is provided more locally. Alternatively, rural patients may rely more extensively on generalists rather than on specialists for their treatments, or they may forego treatment altogether.
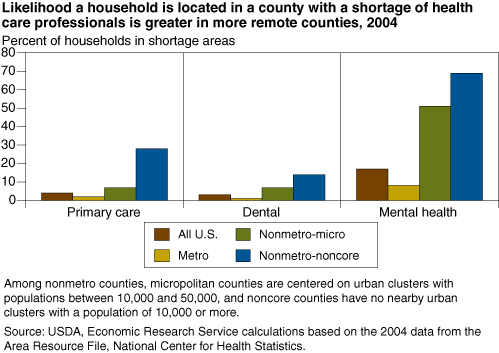
Rural counties are more likely to be designated Health Professional Shortage Areas for basic (primary, dental, and mental health) providers. The share of households in counties designated as shortage areas increases sharply as the level of urbanization declines for all three types of care. The shortages are greatest for mental health professionals across the board. As a result of the limited access to mental health professionals, rural primary care physicians often treat mental as well as physical health problems.
Rx—Health Information Technology?
During the past few decades, government policies implemented to redress the uneven geographic distribution of health care resources have had an impact. But access remains an issue, particularly in remote, sparsely populated areas. Adoption of health information and communications technologies—widely promoted to increase patient safety and health, while reducing costs—holds particular promise for remote areas by facilitating coordination of care across geographically dispersed providers.
The key elements of these technologies include individual electronic health records, a network to exchange health information, and the information and communications technology and standards to support both. Telemedicine applications can reduce costs and improve health care by allowing remote health care facilities to consult with primary care physicians and specialists at other hospitals or regional medical centers through the use of high-resolution cameras, digital-imaging equipment, and high-speed connections.
Adoption rates are generally low, however, particularly in nonmetro areas. Though high-speed connection to the Internet is becoming less of a stumbling block for telemedicine (see “Broadband Internet Service Helping Create a Rural Digital Economy”), nonmetro hospitals report lower adoption rates for electronic medical records than metro hospitals. Adoption rates are comparable for metro and nonmetro private physician practices. Health care organizations may be reluctant to adopt new information systems because of the current lack of technology standards and patient privacy liability concerns.
Other impediments are driven by the intensive investments required to adopt these new technologies, both in financial capital and skilled labor. Under current reimbursement systems, health care organizations that invest in the technology do not receive the related savings. (Patients benefit from better health, and insurers benefit from lower costs; providers, however, face higher costs for implementation and lower revenues after implementation.) Reimbursement for telemedicine services is expanding but is not universal. Medicare pays only for some procedures. State Medicaid programs also have differing policies on telemedicine reimbursement, as do private insurers.
The limited access to capital and infrastructure and the lack of workforce expertise may pose particular challenges to technology adoption in rural areas. Small organizations need financial resources, as well as technical assistance, to successfully implement health information technology and to adjust workflow to achieve the potential efficiencies. The American Recovery and Reinvestment Act of 2009 allocated $19 billion to reduce some of these impediments, including $17 billion in incentive payments through Medicare and Medicaid reimbursements to reward health providers that can show meaningful use of new information technologies. The remaining funds help finance various programs to support adoption, including community-based regional extension services.
This article is drawn from:
- Jones, C., Parker, T., Ahearn, M., Mishra, A.K. & Variyam, J. (2009). Health Status and Health Care Access of Farm and Rural Populations. U.S. Department of Agriculture, Economic Research Service. EIB-57.
- Preliminary Evidence for an Emerging Nonmetropolitan Mortality Penalty in the United States. (2008). American Journal of Public Health, 98(8):1470-1472.
We’d welcome your feedback!
Would you be willing to answer a few quick questions about your experience?


