Food Insecurity up in Recessionary Times
- by Margaret Andrews and Mark Nord
- 12/1/2009
Highlights
- The number of U.S. households unable to put adequate food on the table increased sharply during the latest recession, reaching the highest level recorded since USDA began monitoring household food security in 1995.
- Proportionally, increases in food insecurity were greatest in groups that were historically less vulnerable to food insecurity.
- In the 2001 recession—the only previous recession for which food security data are available—food insecurity increased not only during the downturn but also in the first 3 years of renewed economic growth.
Making ends meet is a struggle for some Americans regardless of the state of the general economy. Such a struggle can leave families insecure about having enough food to get them through the month. Some may have to scrimp on the quantity or quality of the food that they eat. While these situations happen in the best of times, they become more common and acute in economic recessions when job markets are weak and State and local government assistance is curtailed by tight budgets.
USDA has monitored food insecurity—defined as inadequate or unsure access to enough food for active, healthy living—in the United States since 1995 (see box, “How Is Food Security Measured?”). Over that period, there have been two recessions—one from March to November 2001 and the recession that began in December 2007. The decline in food insecurity that began in the late 1990s was reversed with the onset of the 2001 recession. The recent economic downturn has brought a sharp increase in the number of Americans who report having difficulty meeting their food needs. In fact, in 2008, the number and percentage of U.S. households classified as “food insecure” reached the highest level recorded since Federal monitoring of food insecurity began in 1995.
Number of Food-Insecure Households Currently on the Rise . . .
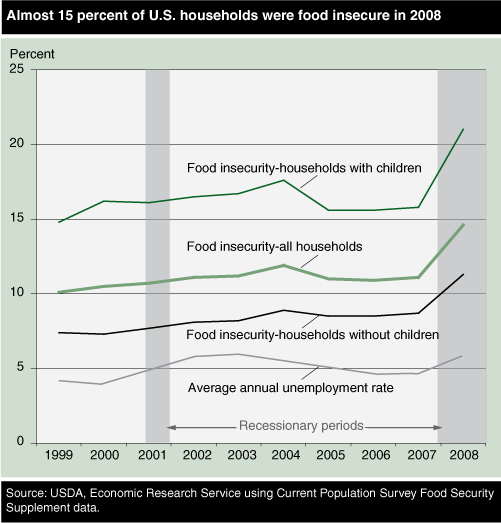
The number of food-insecure U.S. households rose from 13.0 million (11.1 percent of all households) in 2007 to 17.1 million (14.6 percent) in 2008. The additional food-insecure households were nearly evenly split between households with and without children, about 2 million in each group. However, the increase was proportionally larger for households with children. Among these households, the prevalence of food insecurity rose from 15.8 percent in 2007 to 21.0 percent in 2008. The corresponding increase for households without children was from 8.7 to 11.3 percent.
The rise in food insecurity during the milder 2001 recession was smaller than in 2008. Although food insecurity continued to worsen through 2004, the overall increase from 1999 to 2004 was substantially less than the single-year increase from 2007 to 2008. For example, between 1999 and 2004, an additional 1.4 million households with children and 1.5 million households without children were classified as food insecure. The national food insecurity prevalence rate increased over that period from 10.1 to 11.9 percent.
After 2004, the prevalence of food insecurity declined somewhat but was still above the 1999 level when the latest recession began in late 2007. Unemployment typically continues to worsen for some time after the end of a recession, and the evidence from the 2001 recession suggests that this may also be true of food insecurity, which is closely linked to employment.
. . .and More Households Are Facing Food Shortages
USDA food security statistics distinguish a subset of food-insecure households that experience more severe or frequent food insecurity—a condition called “very low food security.” In households with very low food security, the food intake of some household members is reduced, and their normal eating patterns are disrupted.
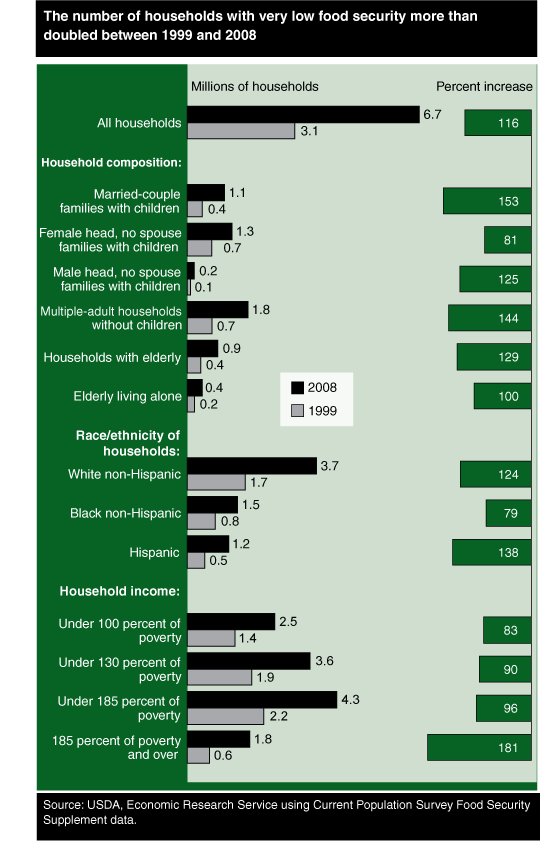
The prevalence of very low food security, like food insecurity, has increased sharply in the past decade. The number of such households more than doubled between 1999 and 2008, increasing 116 percent from 3.1 to 6.7 million. Over half of the increase occurred from 2007 to 2008. The increase over the decade was greater for households without children—an increase of 121 percent, from 1.9 to 4.1 million—than for households with children, which registered an increase of 109 percent, from 1.3 to 2.6 million.
Over the decade, the prevalence of very low food security increased in all subpopulations analyzed by USDA. For the most part, percentage increases were largest for groups in which very low food security has historically been less prevalent. For example, percentage increases of very low food security were larger than the national average for married couples with children (up 153 percent), multiple adult households without children (up 144 percent), and households with incomes above 185 percent of the Federal poverty level (up 181 percent).
However, even with the larger than average increases, the prevalence rates of very low food security in these groups remained well below the national average in 2008. For example, the prevalence of very low food security in married-couple families with children increased from 2.7 percent in 2007 to 4.1 percent in 2008, but was still below the national average of 5.7 percent in 2008.
On the other hand, percentage increases in the prevalence of very low food security were smaller than the national average for single mothers with children (81 percent), non-Hispanic Black households (79 percent), and households with incomes less than 185 percent of the poverty line (83 to 96 percent)—groups whose rates of very low food security historically were higher than the national average.
USDA Programs Provide Additional Resources in a Time of Rising Food Insecurity
To a great extent, USDA’s food and nutrition assistance programs adjust automatically to provide additional resources when need increases. Two of the largest programs, the Supplemental Nutrition Assistance Program (SNAP, formerly known as the Food Stamp Program) and the National School Lunch Program, are entitlements. Outlays for these programs increase as more households become eligible due to job loss or declines in income, and as a larger share of eligible households apply because of increased need. In fiscal 2008, combined expenditures for all USDA food and nutrition assistance programs totaled $60.6 billion, an increase of 10 percent over expenditures in 2007.
Expenditures for SNAP totaled $37.7 billion in fiscal 2008, up 13 percent from the previous year. Average monthly participation in SNAP increased from 26.5 million in 2007 to 28.4 million in 2008. Four other programs—the National School Lunch Program, the Special Supplemental Nutrition Program for Women, Infants, and Children (WIC), the Child and Adult Care Food Program, and the School Breakfast Program—accounted for all but 11 percent of the remaining $23.2 billion in spending for USDA’s food and nutrition assistance programs in 2008.
These food and nutrition assistance programs provide the core of the Nation’s nutritional safety net. They provide a buffer against the more severe outcomes of food insecurity, although the recent spike in the prevalence of very low food security indicates that they do not fully protect against those conditions. In the 30-day period prior to the food security survey in December 2008, 14.4 percent of households that received SNAP benefits had very low food security. Although this rate was higher than the corresponding rate in 2007, it was up by only 10 percent, compared with a 46-percent increase among similarly low-income households that did not receive SNAP benefits.
Congress included a major increase in SNAP benefits in the 2009 American Recovery and Reinvestment Act. As a result, SNAP maximum per household benefits increased by 13.6 percent in April 2009, which will help SNAP participants better tackle food insecurity. Also, the increase in benefits, in combination with tight economic times, is likely to have encouraged more Americans to participate in SNAP. As of May 2009, the number of participants in SNAP reached a historically high level of 34.4 million—more than 11 percent of the Nation’s population.
This article is drawn from:
- Nord, M., Andrews, M. & Carlson, S. (2009). Household Food Security in the United States, 2008. U.S. Department of Agriculture, Economic Research Service. ERR-83.
You may also like:
- Food Security in the U.S.. (n.d.). U.S. Department of Agriculture, Economic Research Service.
- Nord, M. & Andrews, M. (2002). Issues in Food Assistance-Reducing Food Insecurity in the United States: Assessing Progress Toward a National Objective. U.S. Department of Agriculture, Economic Research Service. FANRR-26-2.
- Oliveira, V. (2009). The Food Assistance Landscape: FY 2008 Annual Report. U.S. Department of Agriculture, Economic Research Service. EIB-6-6.


