Data Feature
- by Karen Hamrick, David Hopkins and Ket McClelland
- 6/1/2008
How Much Time Do Americans Spend Eating?
Successful policies to mitigate the rise in obesity and other diet-related health conditions in the U.S. depend on an understanding of Americans' eating patterns. Eating patterns encompass not only what and how much people eat, but also when and where they eat, how long they spend eating or snacking, and whether they dine alone or with others.
The Eating & Health Module of the American Time Use Survey (ATUS) collects information on Americans' eating patterns, general health, food and nutrition assistance program participation, grocery shopping, and meal preparation. Funded by ERS and the National Cancer Institute, the Module is a supplement to the U.S. Bureau of Labor Statistics' ATUS, a continuous survey that began in 2003. One individual from each sampled household is interviewed about his or her use of time for the 24-hour period on the day before the interview. Survey respondents are asked to identify their primary activity if they were engaged in more than one activity at a time.
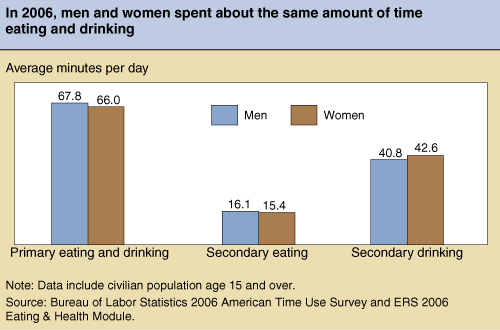
According to 2006 ATUS and Module data, Americans age 15 and older spent 67 minutes on an average day in 'primary' eating and drinking of beverages, that is eating/drinking as a self-reported main activity. In addition, Americans spent an average of 16 minutes eating and 42 minutes drinking beverages (except for plain water) as secondary activities, such as while working, watching television, or playing sports. An additional 7 minutes were spent in associated activities (such as travel time to a restaurant and waiting to order). Men and women spent about the same amount of time eating/drinking.
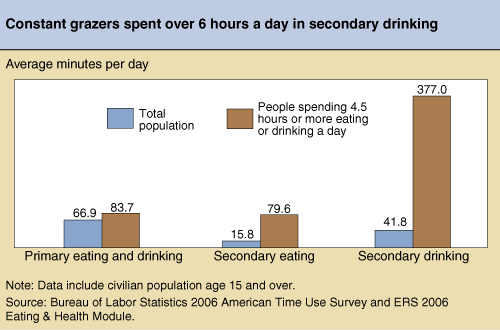
Four percent of the U.S. population reported spending no time in primary eating/drinking on an average day, but they did spend an average of 35 minutes in secondary eating and 107 minutes (1.8 hours) in secondary drinking. Another 8 percent of the population, referred to as 'constant grazers,' spent an unusually long time eating and drinking—4.5 hours or more each day. Most of this group's food consumption time was spent in secondary drinking or sipping of beverages.
About two-thirds of Americans' primary eating/drinking occurrences were with family or others. However, only 42 percent were with others for secondary eating or secondary drinking, with the rest done either alone, at work, or while engaged in grooming or other personal care activities.
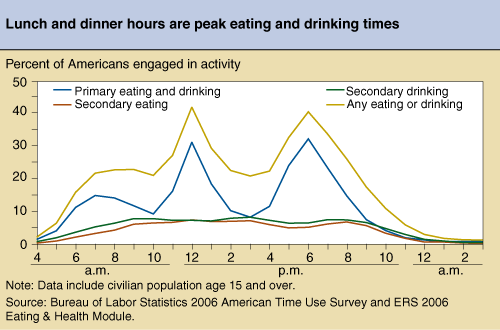
Over the course of the day, about 22 percent of the population was engaged in some eating or drinking activity between 7 a.m. and 10 a.m. Between noon and 1 p.m., 42 percent of Americans were engaged in eating and/or drinking activity. The evening peak was between 6 p.m. and 7 p.m., with 40 percent engaged in eating or drinking.
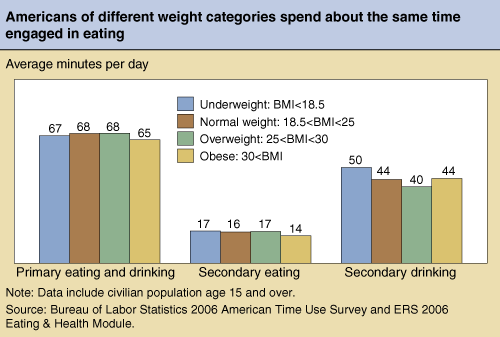
Average time spent in primary and secondary eating/drinking did not vary much by Body Mass Index (BMI), contrary to expectations. Those considered underweight spent more time in secondary drinking than the other BMI groups. More research is needed to understand the complexities of food consumption time patterns and BMI, such as looking at whether an individual's eating is a primary or secondary activity, and analyzing eating time patterns over the day.
The Eating & Health Module was added to the ATUS in January 2006 and is scheduled to beincluded through 2008. Analyses of the additional survey information collected will allow researchers to study the relationship between obesity and allotment of time (eating, exercise, inactivity); differences in time-use patterns between households that receive food stamp benefits and other low-income households; and the relationship between parents' time-use patterns and their children's consumption of meals purchased at school or day care.
This article is drawn from:
- Eating and Health Module (ATUS). (n.d.). U.S. Department of Agriculture, Economic Research Service.
You may also like:
- American Time Use Survey. (2014). Bureau of Labor Statistics.


