Hired Farmworkers a Major Input For Some U.S. Farm Sectors
- by William Kandel
- 4/1/2008
Highlights
- As the total U.S. agricultural labor force has declined over the past century, hired farmworkers have become a larger proportion of all farmworkers and are especially important in the production of fruit, tree nuts, vegetables, and horticultural crops.
- Hired farmworkers earn lower incomes than most other wage and salary workers and face demanding working conditions.
- Because an estimated half of hired farmworkers lack the legal status to work in the U.S., legislative reforms of immigration policies could have an impact on the sectors employing these workers.
Hired farmworkers make up a third of the total U.S. agricultural labor force but are a much higher share of workers in the production of labor-intensive crops, such as fruit, tree nuts, vegetable, and horticultural crops. The hired farmworker-labor market is unique because it includes a relatively low-paid, heavily foreign-born, and frequently migrating population, an estimated half of whom lack the legal authorization to work in the U.S.
Although agriculture employs less than 2 percent of the U.S. labor force, hired farmworkers are receiving greater attention because of two pronounced trends. First, changing agricultural production methods that permit year-round employment and increasing immigrant employment have contributed to a greater presence of immigrants in some rural counties. Second, public concern over U.S. immigration policy has given the mostly Hispanic immigrant hired farmworkers increased visibility. While the overwhelming majority of U.S. farm operations are too small to need hired farmworkers, larger farms and those that require hired help have an interest in evolving U.S. immigration policies.
Reliance on Hired Farmworkers Varies Considerably
The geographic distribution of the hired farm labor force is determined by the total quantity of agricultural production and the kind of crops grown in an area. Certain crops are more labor intensive. One way to put this in context is to compare labor expenses to cash receipts. For the U.S., the total farm labor expense in 2006 was $24.4 billion—amounting to 10.2 percent of total agricultural commodity cash receipts. But, in California, which has the greatest cash receipts of all States and produces many labor-intensive crops (such as dairy, grapes, and greenhouse and nursery), total farm labor expense amounted to 22.3 percent of the total value of agricultural cash receipts for 2006. In contrast, in Iowa, farm labor expense totaled 2.5 percent of cash receipts. Iowa has the third highest total cash receipts but grows primarily non-labor-intensive agricultural commodities (such as corn, hogs, and soybeans). Six States—California, Florida, Washington, Texas, Oregon, and North Carolina—account for about half of the Nation’s expenditure on hired labor.
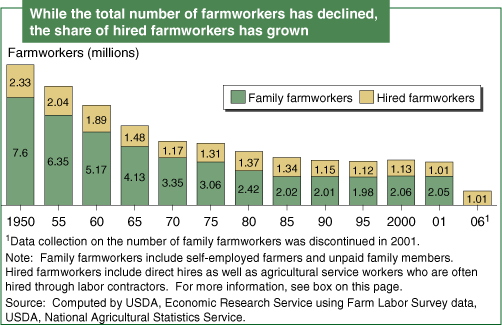
Hired farmworkers represent an increasing proportion within an agricultural workforce that has been declining consistently for the past century (see box, “Data Sources on Hired Farmworkers”). Extraordinary increases in agricultural labor productivity due to technological innovation reduced farm employment from almost 10 million in 1950 to just over 3 million by 2006. At the same time, agricultural output increased by more than 150 percent. Over time, agricultural production has concentrated on fewer and larger farms.
From 1950 to 2001, according to the Farm Labor Survey (FLS), the average number of family farmworkers declined, while the average number of hired farmworkers per farm increased. As a consequence, the ratio of hired to total farmworkers has increased from roughly 1 in 4 in 1950 to 1 in 3 in 2001. Moreover, because the FLS is a cross-section estimate at various points during the year and hired farmworkers are often seasonal workers, notwithstanding the recent increase in year-round workers, the total number of hired farmworkers over the course of a year is likely to be significantly higher than the FLS estimates.
The trend toward a greater reliance on hired labor, relative to farm family labor, is even more evident for the larger farms that account for most production. Members of family farm households have increasingly engaged in employment activities off the farm during the last 50 years. But, part of the explanation underlying the shifts in labor use is due to the concentration of production on larger farms, which require nonfamily farmworkers since family workers alone cannot meet the labor requirements of these large operations.
Labor is the agricultural sector’s third largest production expense (considering all cash and noncash expenses, such as capital depreciation), trailing only feed and capital depreciation. For 2008, wages paid to hired farmworkers are forecast to be $27.3 billion. After declining for decades, labor’s share of U.S. farm expenses began increasing in the mid-1980s. Consequently, among labor-intensive agricultural sectors, factors affecting the farm labor supply—such as increases in the minimum wage, changes in labor demand from other industries employing low-skilled workers, or new immigration policies—can alter farm profitability for growers who rely heavily on farm labor. Growers who specialize in vegetable, fruit, tree nut, or horticultural production, for whom labor costs total 30-40 percent of cash expenses, are especially sensitive to fluctuations in the cost and availability of labor.
While labor tasks for some crops are automated, some growers contend that the expense of mechanization to replace labor-intensive tasks would prevent them from remaining competitive with foreign producers. Alternative perspectives suggest that growers could adjust to smaller workforces by using labor-efficient technologies and management practices. Both arguments remain untested because growers have long relied upon an ample labor supply.
What Do We Know About Hired Farmworkers?
Recent ERS research on hired farmworkers reveals a higher proportion who are foreign-born, have limited English language skills, and have less U.S. working experience than workers in other sectors of the economy. They are also younger and have significantly less schooling than all other wage and salary workers in the U.S. labor force.
These characteristics have consequences for farmworkers’ employment opportunities. Low earnings among hired farmworkers are pervasive. Median weekly earnings of full-time farmworkers are 59 percent of the average wage and salary worker. Hired farmworkers earn significantly less than workers in most other occupations, including some similarly low-skilled jobs. In addition, Federal minimum wage laws, which exempted employers of all farmworkers when passed during the Great Depression, still exempt growers who employ fewer than seven workers.
Hired farmworkers have less stable work schedules than other wage and salary workers and unemployment rates that, on average, are twice as high. An estimated half of all hired farmworkers are migrants who work considerable distances from their homes. Migrant farmworkers are more likely to be younger, male, and Hispanic than settled hired farmworkers. Compared with settled hired farmworkers, migrant farmworkers have even fewer years of schooling and U.S. work experience, even less knowledge of English, and, for most, no legal status to work in the U.S. Migrant farmworkers also earn less than settled farmworkers. In 2006, migrant crop farmworkers received $7.52 per hour, compared with $8.53 per hour for settled crop farmworkers. Beyond monetary compensation, migrant farmworkers are less likely than settled farmworkers to have health insurance. Since many migrant farmworkers travel with their families, including children, the disadvantages of low earnings, lower health insurance rates, and changes in location extend to their families.
| Characteristics | Hired farmworkers: noncitizen (percent) |
Hired farmworkers: citizen (percent) |
Other wage and salary workers: noncitizen (percent) |
Other wage and salary workers: citizen (percent) |
|---|---|---|---|---|
| Demographic characteristics | ||||
| Male | 82.7 | 79.9 | 63.6 | 50.7 |
| Hispanic ethnicity | 94.6 | 12.0 | 61.8 | 9.1 |
| Less than ninth grade education | 63.4 | 9.9 | 22.2 | 1.4 |
| Mexican-born | 90.3 | 5.3 | 41.2 | 1.2 |
| Pre-1986 U.S. entry (foreign-born) | 17.5 | 72.5 | 15.7 | 60.4 |
| Only Spanish spoken in household | 64.0 | 4.1 | 30.7 | 1.3 |
| Married | 62.5 | 46.9 | 60.3 | 55.3 |
| Children under 18 in household | 46.7 | 29.2 | 42.4 | 34.5 |
| Median age (years) | 34 | 34 | 34 | 40 |
| Employment characteristics | ||||
| Median weekly earnings (dollars) | 340 | 470 | 480 | 700 |
| Median hourly wage (dollars) | 7.50 | 10.00 | 10.00 | 13.00 |
| Employed part-time (percent) | 6.3 | 25.0 | 11.9 | 17.0 |
| Unemployed (percent) | 9.9 | 7.7 | 4.3 | 4.5 |
| Median unempl. duration (months) | 8 | 4 | 7 | 8 |
| Union membership (percent) | 1.7 | 2.2 | 6.3 | 12.6 |
| Number of workers | 284,315 | 472,470 | 12,082,393 | 116,455,584 |
| Source: Computed by USDA, Economic Research Service using the average of all 12 months of the 2006 Current Population Survey Earnings File data. The noncitizen category includes authorized and unauthorized workers. | ||||
Data from the U.S. Department of Labor show that agricultural work consistently ranks among the more hazardous occupations in the U.S. for the incidence of fatalities, injuries, and illnesses. Farmworkers face occupational hazards not generally found in other industrial settings, such as pesticide exposure and risk of heat exhaustion and heat stroke. Almost three-quarters of crop farmworkers possess some type of health insurance for work-related injuries, but few workers have it for non-work-related injuries or illnesses.
U.S. Census Bureau data indicate that farmworker housing conditions, which historically have often been substandard, have improved relatively little in recent years. Substandard farmworker housing conditions have been well documented by a variety of sources, including the U.S. Government Accountability Office at the national level, as well as a variety of small area studies by nonprofit housing organizations and State university researchers.
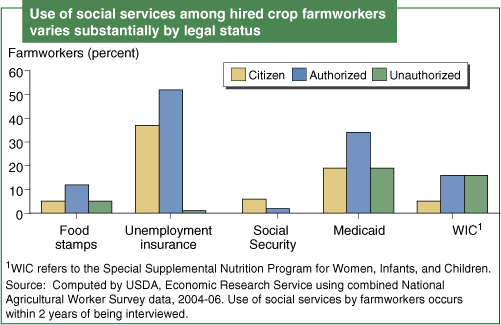
Hired farmworkers use some selected Federal assistance programs for themselves and their family members at higher rates than other wage and salary employees. These include food stamps, WIC (Special Supplemental Nutrition Program for Women, Infants, and Children), Medicaid, and free school lunches. Higher use of such social services is likely due in part to lower earnings among hired farmworkers. Unauthorized immigrants are eligible for WIC, and citizen children of unauthorized immigrants are eligible for food stamps and Medicaid. Among hired farmworkers, authorized workers use more social services than unauthorized workers. Among authorized crop farmworkers, citizens—whose poverty rates are a third of those of noncitizens—typically have lower participation levels in social service programs than noncitizens.
Differing Perspectives on Unauthorized Farmworkers
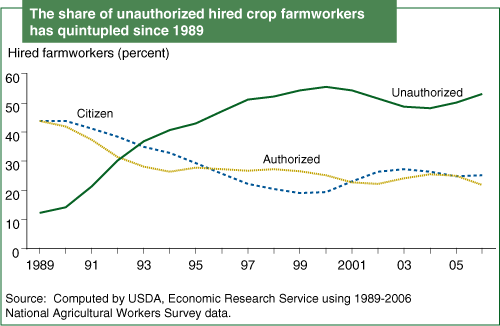
According to the U.S. Department of Labor’s National Agricultural Workers Study (NAWS), roughly half of crop farmworkers are not authorized to work in the United States. Because the number of unauthorized low-skill immigrants in the U.S. far exceeds immigration quotas, the immigrants’ opportunities to obtain legal status depend almost entirely on changes in U.S. immigration policy. U.S. farm operators likewise rely on immigration policy for guidance on employment decisions. Immigrants who arrived after 1990 were ineligible to qualify for legal status under the Immigration Reform and Control Act of 1986 (IRCA). This legislation granted legal status to those who have lived in the U.S. since 1982 or who could prove they engaged in agricultural employment between 1985 and 1986. Because no major legislation has offered legal status to unauthorized immigrants since IRCA, immigrants arriving after 1990 are far more likely to be unauthorized.
Unauthorized workers appear in greater proportions in agriculture than in other industries. Current and widely cited estimates by the Pew Hispanic Center place the entire unauthorized workforce at 7 million workers in 2006. Of these, an estimated 500,000 are employed as hired farmworkers at any given point in time. But, because different workers often work at the same location at different times of the year, the estimated total number of unauthorized workers employed in agriculture throughout a year is likely to be greater.
According to the NAWS data, since 1989, a substantial portion of crop farmworkers have consistently reported they expected to remain in farmwork for the for seeable future. However, several studies based on the experience with IRCA suggest that if unauthorized workers were granted legal status, they would be less likely to take seasonal agricultural production jobs and agricultural wages would increase significantly. Hence, those employing seasonal workers would face the greatest financial challenges resulting from labor market constriction due to immigration reform. Farm operators are likely to adjust over time by acquiring additional capital equipment, switching commodities, or possibly ceasing agricultural production.
Opponents of additional immigration restrictions believe that imposing them would jeopardize the supply of labor available to farmers during critical planting and harvest seasons. They contend that if restrictive immigration policies were to occur, it could lead to reduced profits for some farms and threaten the viability of agricultural subsectors that remain heavily dependent on farm labor, especially fruit, tree nuts, vegetables, and horticulture. Others contend that little evidence supports the existence of farm labor shortages. To support their view, the latter group points to relatively slight increases in recent hired farmworker wages, greater production of labor-intensive fruit and vegetables, the small proportion of food products’ final cost attributed to labor, and increasing possibilities for agricultural mechanization. Because agriculture has not had to deal with a critical shortage of labor in the recent past, it is difficult to reconcile these two perspectives.
Agricultural Labor and Immigration Policies Changing
The last major national legislation passed that affected agricultural workers was the IRCA, which included a Special Agricultural Workers (SAW) legalization program for persons able to demonstrate agricultural employment prior to 1985-86. Since that time, States and municipalities across the Nation have implemented policies to address growing numbers of unauthorized workers, whether they work on farms or elsewhere. In over 20 States, legislatures have passed laws that penalize employers who knowingly hire unauthorized workers. At least 100 municipalities around the Nation have proposed or enacted ordinances that penalize businesses for hiring and landlords for renting to unauthorized workers.
At the national level, the Social Security Administration (SSA) attempted to contact all employers regarding employees whose Social Security numbers and personal identification information, as submitted by employers, did not match SSA records. These efforts have been halted in Federal courts, however, due to concerns about errors in the SSA database that might cause legally authorized residents to be mistakenly fired and/or deported.
As of early 2008, several immigration law reforms have been proposed. AgJobs, the one proposed piece of legislation directly related to agricultural workers, represents a compromise between growers, farm labor advocates, and Federal legislators. It would provide many farmworkers with temporary legal status and the possibility of obtaining permanent legal residence in the United States.
AgJobs would also restructure the current H-2A visa program—the Nation’s only legally sanctioned guestworker program—to reduce administrative requirements for growers and to increase legal protections for workers. In 2006, some 64,000 out of an estimated 1 to 2.5 million hired farmworkers—less than 3 percent—employed during the year participated in the H-2A visa program. According to some growers and worker advocates, however, problems will occur as the program is implemented. Growers sometimes claim that administrative requirements are cumbersome, while advocates contend that the program invites pervasive worker abuses through a lack of regulatory enforcement. As part of a program to address border security and immigration challenges, President Bush issued a directive to the U.S. Department of Labor to review the regulations implementing the H-2A program and institute changes to address concerns of both growers and farm labor advocates.
A Shift to Year-Round Workers
Changes in U.S. immigration policy may have repercussions for the costs of hiring farmworkers and ripple through farm management decisions. In addition to the direct effects on farm labor supply, immigration reforms will indirectly affect several opposing trends. Increased technological advances, including mechanization, and changes in labor costs may affect the agricultural sector’s demand for hired labor. Yet, a growing consumer appetite for affordable fresh fruit and vegetables, and, in particular, more labor-intensive organic produce increases labor demand.
Although the implications of future immigration reforms is highly uncertain, data indicate a growing shift from seasonal to year-round agricultural employment, corresponding in part to growing domestic demand for fresh fruit and vegetables year-round. In turn, migrant workers are increasingly settling permanently in places where they previously worked temporarily. As seasonal workers transition into year-round workers (by doing multiple tasks on the same farm or holding multiple local jobs throughout the year), not only might farmers benefit from a more stable and available workforce, but hired farmworkers could benefit from improved economic conditions.
This article is drawn from:
- Farm Labor. (n.d.). U.S. Department of Agriculture, Economic Research Service.
You may also like:
- Kandel , W. (2006, June 1). Meat-Processing Firms Attract Hispanic Workers to Rural America . Amber Waves, U.S. Department of Agriculture, Economic Research Service.
- Kandel , W. (2005). Rural Hispanics At A Glance. U.S. Department of Agriculture, Economic Research Service. EIB-8.
- Kandel , W. & Cromartie, J. (2004). New Patterns of Hispanic Settlement in Rural America. U.S. Department of Agriculture, Economic Research Service. RDRR-99.


