On The Map
- by Mark Nord
- 6/1/2007
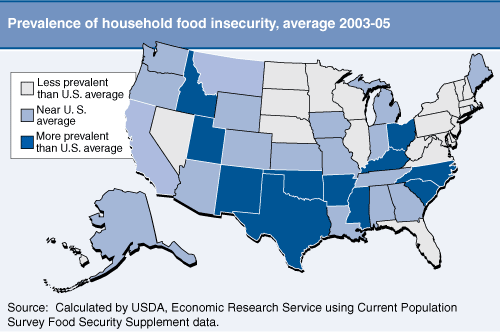
Household Food Insecurity Varies by State
Most U.S. households can consistently afford enough food for active healthy living. But 11 to 12 percent of households struggled at times to put adequate food on the table in recent years. USDA classifies such households as food insecure. During 2003-05, the national prevalence of food insecurity averaged 11.4 percent and varied from less than 7 percent in North Dakota, New Hampshire, and Delaware to over 16 percent in New Mexico and Mississippi. Food insecurity was more prevalent than the national average in 11 States, less prevalent than the national average in 20 States, and not statistically different from the national average in 19 States and the District of Columbia.


