Data Feature
- Contact: Website Administrator
- 11/1/2006
Revised Market Basket Statistics Reflect Consumers’ Changing Produce Purchases
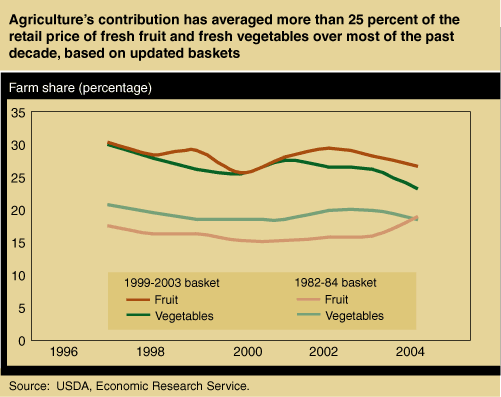
More and more of what consumers spend for their groceries has gone to the firms that process, package, and distribute agricultural commodities. The farm share of retail food prices has likewise been shrinking. For example, farmers earned 33 percent of what consumers spent for fresh fruit at retail foodstores in 1982, but just 20 percent in 2004. Likewise, the share for fresh vegetables shrank from 34 to 19 percent. However, new research finds that the more recent estimates understate the share of the produce dollar going to the farmer.
ERS’s market basket data series measures the spread (or difference) between the price paid by consumers for a mix or basket of foods purchased in foodstores and the revenues earned by farmers for supplying the commodities in those foods. ERS estimates spreads for nine commodity groups: fresh fruit, fresh vegetables, dairy foods, meat products, poultry, eggs, fats and oils, processed fruit and vegetables, and bakery/cereal products. The series aims to inform both policymakers and the agricultural community about the cost of marketing commodities and how these costs compare with what farmers themselves earn. The farm share does not measure farm income or profitability.
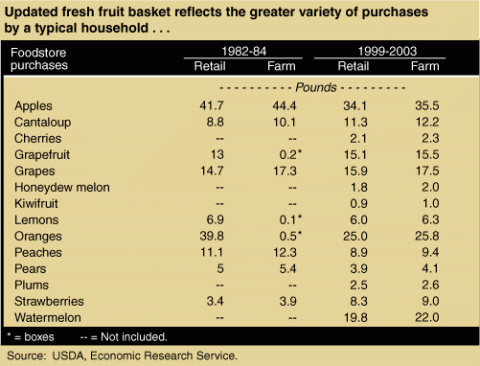
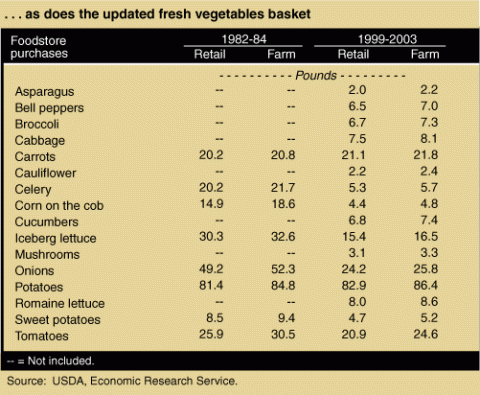
Each consumer commodity basket strives to represent the food items and quantities bought by a typical American household in a year. The corresponding farm basket contains the amounts of agricultural commodities that produce the contents of the consumer basket, taking into account losses due to trimming at processing facilities and spoilage at retail stores. Thus, the consumer basket for fresh vegetables contains 20.2 pounds of carrots, while the farm basket contains 20.8 pounds.
The contents of the consumer and farm baskets are based on 1982-84 data on American households’ grocery store purchases. Applying measures of retail price inflation supplied by the Bureau of Labor Statistics and yearly farm prices allows ERS to update values each year. The total farmgate value of all commodities used to produce the consumer basket for fresh vegetables in 2004 was $48.77, 19 percent of the estimated price of $256 for the consumer basket.
U.S. food shopping habits have changed since 1982, and fresh fruit and fresh vegetable shopping are no exception. Between 1987 and 1997, the average supermarket produce department expanded from 4,817 to 5,140 square feet, and the number of items stocked grew from 173 to 335 over the same period. ERS’s food availability data, which include both the at-home and away-from-home markets, show dramatic changes in the quantities of some fresh fruit and fresh vegetables available for consumption since 1982. Notable increases have occurred in the per capita supply of bell peppers (up 3.9 pounds) and broccoli (up 3.5 pounds). Until 1985, the supply of romaine lettuce was too small to track, but totaled 11.2 pounds per person in 2003.
ERS is currently reviewing each of the nine commodity groups in its market basket series, and used purchase data on about 7,000 households in both 1999 and 2003 to compile new consumer baskets for fresh fruit and fresh vegetables. Updated farm baskets were also calculated to correspond with these new consumer baskets.


Based on the new farm baskets, farm revenues accounted for 26.6 percent of consumer spending for fresh fruit at retail foodstores in 2004 and 23.5 percent for fresh vegetables. These estimates are higher than estimates provided by the current series partly because the new baskets contain more fruit and vegetables with higher farm values. For example, the new basket for fresh vegetables adds asparagus (with a relatively high farm value of $1.22/pound), bell peppers ($0.34), broccoli ($0.33), mushrooms ($1.14), and romaine lettuce ($0.19). By contrast, celery ($0.15), corn on the cob ($0.21), iceberg lettuce ($0.17), and onions ($0.11) are less represented in the updated basket.
This article is drawn from:
- Food Markets & Prices. (n.d.). U.S. Department of Agriculture, Economic Research Service.
- Stewart, H. (2006). How Low has the Farm Share of Retail Food Prices Really Fallen?. U.S. Department of Agriculture, Economic Research Service. ERR-24.


