Where You Shop Matters: Store Formats Drive Variation in Retail Food Prices
- by Ephraim Leibtag
- 11/1/2005
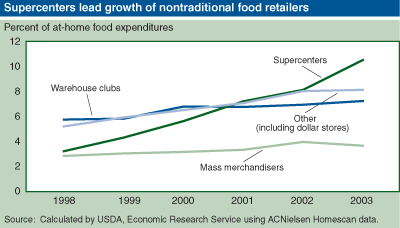
Americans' food shopping habits are changing. Just 20 years ago, traditional grocery stores claimed nearly 90 percent of Americans' at-home food purchases. Today, their share has dropped to 69 percent. Led by retail giants Wal-Mart, Costco, and Target, nontraditional food stores have managed to grab market share by enticing consumers with a formula of one-stop shopping and lower prices. Supercenters, warehouse club stores, and other nontraditional foodstores (see What's in a Name?) increased their share of consumer food expenditures from 18 percent in 1998 to 31 percent in 2003. Among the nontraditional retailers, supercenters (primarily Wal-Mart Supercenters) made the largest leap over this 6-year period, increasing in share from just over 3 percent of food-at-home sales to nearly 11 percent.
What does the eroding role of the traditional grocery store mean for consumers and for retail food prices? Over the past 20 years, the Consumer Price Index for food at home has increased by 3 percent per year, implying relatively stable food prices over time. However, this aggregate measure of food price change does not tell the whole story.
The determinants of retail food prices are many and their interaction is often complex. Certainly, the cost of procuring food (from wholesalers, distributors, or other suppliers) is a major factor, but labor and other costs associated with the operations of a store are also important. In addition, the competitive environment in which a retailer operates along with the preferences of consumers in a given market will have an effect on average prices paid, as well as on the ability of retailers to adjust prices as market conditions change.
These differences in store costs, store characteristics, and consumer preferences cause retail prices to vary across regions and markets. Even within a narrowly defined market, food prices can and do vary substantially: average prices for an identical basket of food items can vary by 5 to 15 percent between stores. Measuring variation in food prices helps improve our understanding of inter-regional variation in food purchasing power and the economic well-being of households, especially low-income households whose food purchases constitute a large share of their household budgets.
Prices Vary by Region . . .
ERS investigated variation in food prices by calculating national prices for a variety of dairy products, using a unique data set that facilitated an analysis of average prices paid across all retail outlets (see Homescan Provides Insight Into Food Purchases). Prices paid for food during 1998-2003 were found to vary geographically. Comparing food prices across four regions of the U.S., ERS found variations of as much as 11 percent. Within the milk category, for example, prices for both skim milk and low-fat milk were highest in the South, while whole-milk prices were highest in the West. Skim-milk prices showed the greatest variation in prices paid, with a 14- to 16-percent difference between the highest and lowest priced regions. For example, in 2003, consumers paid an average price of $2.55 per gallon for skim milk in the South, but only $2.14 per gallon in the Midwest. Low-fat milk prices varied 8-13 percent, while whole-milk prices varied by 7-11 percent. By comparison, these differences dwarf annual milk price inflation rates during this time period. The East averaged the highest price increase at 3.1 percent per year between 1998 and 2003, while the Midwest and West averaged annual price increases of 2.6 and 2.5 percent, respectively. The South had the most stable prices, with average increases of 2.1 percent per year.
Among major U.S. markets, general regional patterns persist for skim-milk prices, with cities in the Midwest (Chicago) and West (Los Angeles and San Francisco) having the lowest average prices paid, and cities in the East (New York and Philadelphia) and South (San Antonio and Atlanta) having the highest average prices. Consumers in nonmetro areas pay lower average prices for skim milk than consumers in major urban areas. Low-fat and whole-milk prices are also low in Chicago but are high in Los Angeles and San Francisco.
In general, variation in retail food prices across markets is a function of differences in costs of producing and transporting foods, consumer preferences, the level of competition in a given market, and USDA programs that regulate production and/or prices of certain commodity groups at earlier stages of production. In the case of milk, while Federal milk marketing orders set minimum prices for raw milk, actual prices reflecting market forces are generally, and sometimes substantially, higher than the minimum prices. In addition, a 2004 USDA Report to Congress concluded that the influence of State-level intervention on raw milk prices is minimal due to the regional and national scope of milk marketing. Variation in raw milk prices within a region would be faced by all processors. This implies that even if there are differences in the minimum allowable milk price at earlier stages of production, the effect of milk marketing regulations will be minimal at the retail level.
Other factors more closely related to the retail-level transaction must play a larger role in accounting for variations in retail milk prices. Regional variation in prices for skim milk, as opposed to whole and low-fat milk, are attributed to differences in demand for these products and differences in retailer pricing strategies. The significant differences in milk prices across U.S. markets, as well as between metro and nonmetro locations, implies that there are differences in the purchase behavior of consumers in different markets that may impact the average price paid for milk.
. . . But Less so by Shoppers' Income Levels
Consumers can affect the price they pay for foods through their purchase behavior: this can include using coupons, checking the newspaper for sale items and buying accordingly, or traveling to a store offering lower prices. Because this behavior is often linked to income, ERS examined how average prices paid for food vary by household income level to determine if income and prices paid are related.
Differences in average milk prices paid by households of different income levels ranged from 1 to 3 percent. Low-income households paid 2 to 3 cents more per gallon for skim milk than households in the other income groups; however, the order and magnitude of the price differences varied from year to year. For whole milk, low-income households paid, on average, 3 cents more per gallon than middle-income households and 5 cents more than high-income households. Lower income households do not always pay higher prices; they paid 2 to 7 cents less per gallon for low-fat milk than did high-income households.
Store Formats Matter
Given the relatively small differences in milk prices paid across income groups, but the larger differences in average milk prices among regions and markets, a store's format, including physical characteristics, product offerings, business practices, and marketing strategies, is a likely determinant of and a key to understanding retail food price variation. Earlier research by ERS and the University of Minnesota examined the relationship between variations in store characteristics, operating costs, and the income levels of consumers shopping at a given store. Store characteristics included physical characteristics, such as square feet of selling area and date of last remodeling, services offered, and operating practices.
Study results showed that stores serving low-income shoppers are generally smaller and older than stores serving moderate-income consumers and offer fewer time-saving services for shoppers. In urban locations, stores serving the poor lag behind other stores in the use of sophisticated inventory controls and in worker training and compensation practices. They also have fewer checkout lanes and parking spaces, and shorter operating hours than other metro area stores.
Despite these differences, overall operating costs for stores that serve a greater proportion of low-income consumers were not significantly different from those of stores serving more middle- and high-income consumers. However, differences do exist in terms of the sources of costs. For example, stores serving the poor incur greater costs for procuring the foods they sell, but have significantly lower payroll costs and fewer expenses on additional services. These differences in the sources of costs can impact the prices consumers pay for food.
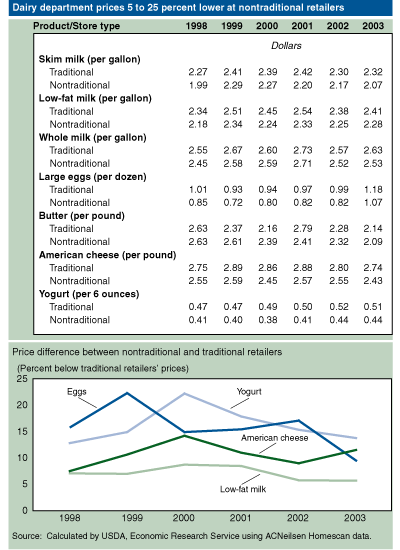
Using the Homescan data, ERS extended this earlier work by examining prices paid at traditional versus nontraditional food retailers. Even when controlling for similar-sized packages, dairy prices are 5 to 25 percent lower at nontraditional retailers than at traditional supermarkets. For example, skim and low-fat milk prices are consistently 5-12 percent lower at nontraditional stores. Similar patterns of lower prices at nontraditional store formats exist across a wide variety of food products including eggs, fruits, vegetables, beef, poultry, coffee, and cookies.
These price differences are significant, especially when compared with standard measures of food price variation. Over the past 20 years, annual food price changes have averaged 3 percent per year, while differences in food prices paid across income groups ranged from 1 to 3 percent. Differences of more than 5 percent in food prices are driven by differences in store formats, which largely account for the regional and market variation in prices observed across the U.S.
Lower Prices Not the Only Issue
Changes in food retailing affect food prices, as well as the variety of products and services available to consumers. With average food prices 5-25 percent lower at nontraditional retailers, the growing presence of these stores will benefit the average U.S. consumer. It remains to be seen, however, if the overall economy will benefit from these new retail formats, particularly when taking into account the impact on traditional retailers, food retail workers, food manufacturers, and agricultural producers.
Initially, as the share of consumer food spending dollar shifts to nontraditional outlets, traditional retailers are forced to lower costs by reducing the services they provide to consumers, by decreasing the benefits provided to their workers, or by combining the two strategies. They may also opt to expand the variety of products and services available in their stores to include additional prepared foods, carryout meals, organic and health products, and nonfood related services (banking, dry cleaning, etc.) to provide the perception of a unique shopping experience for the consumer.
Traditional food retailers that have lowered prices and/or increased the quality and variety of the services they provide have remained competitive, while those that have not adapted have struggled. Retailers that do not adjust quickly lose market share and are in jeopardy of being forced out of markets where they once were dominant, and in some cases, out of food retailing entirely. For food wholesalers, distributors, and others involved in the food supply chain, expanding and maintaining relationships with nontraditional retailers will be crucial to ensuring that their products are available to the U.S. consumer in the future.
This article is drawn from:
- King, R.P., Leibtag, E. & Behl , A.S. (2004). Supermarket Characteristics and Operating Costs in Low-Income Areas. U.S. Department of Agriculture, Economic Research Service. AER-839.
- CPI Bias from Supercenters: Does the BLS Know that Wal-Mart Exists?. (2004). NBER Working Paper No. 10712, National Bureau of Economic Research, Inc..
You may also like:
- Food Markets & Prices. (n.d.). U.S. Department of Agriculture, Economic Research Service.
We’d welcome your feedback!
Would you be willing to answer a few quick questions about your experience?


