Behind the Data: Estimating Export Share of U.S. Agricultural Production
- by Alberto Jerardo
- 11/1/2003
- U.S. agricultural production is consumed domestically, exported, or used in food processing. The share of production that is exported indicates the contribution of exports to U.S. agricultural receipts. However, two measures of export share are available, one based on volume or weight (usually referred to as the volume measure) and the other on dollar values.
| 1980-84 (average) | 1990-94 (average) | 1999 | 2002 | |
|---|---|---|---|---|
| Based on volume | ||||
| Aggregate share | 29.2 | 23.1 | 22.8 | 21.9 |
| Livestock | 2.7 | 5.4 | 10.1 | 10.3 |
| —Red meat | 1.3 | 4.1 | 8.0 | 8.6 |
| —Poultry meat | 3.9 | 7.4 | 14.3 | 14.4 |
| —Dairy products | 8.3 | 5.0 | 5.5 | 3.3 |
| Crops | 30.8 | 24.2 | 23.8 | 22.8 |
| —Food grains | 61.1 | 51.0 | 47.1 | 46.7 |
| —Feed crops | 27.4 | 21.2 | 21.2 | 21.3 |
| —Oilseeds/meal/oil | 32.9 | 25.4 | 27.2 | 24.0 |
| —Fruits and nuts1 | 8.7 | 12.2 | 13.3 | 13.9 |
| —Vegetables | 5.1 | 5.7 | 6.5 | 6.5 |
| —Cotton/tobacco | 49.0 | 40.7 | 39.3 | 57.6 |
| Based on value | ||||
| Aggregate share | 21.9 | 16.8 | 16.7 | 17.7 |
| —Livestock | 2.6 | 5.5 | 7.5 | 7.6 |
| —Crops | 41.0 | 28.5 | 26.4 | 27.3 |
1Includes fruit juices and wine. Source: USDA, Economic Research Service. ERS estimates based on data from USDA’s Foreign Agricultural Service and National Agricultural Statistics Service. |
||||
- Both the volume and value measures include primary livestock and crop commodities as well as major processed food products. Each measure has advantages. The volume-based measure reduces the variations due to product prices, while the value measure better reflects product quality, such as differences between a pound of steak and a pound of hamburger.
- To make volume- and value-based export shares comparable, the measures include only products for which both production and export volumes are available. Products excluded for this reason are mostly minor and include greenhouse and nursery products, seeds, cattle, hides and skins, and animal fats.
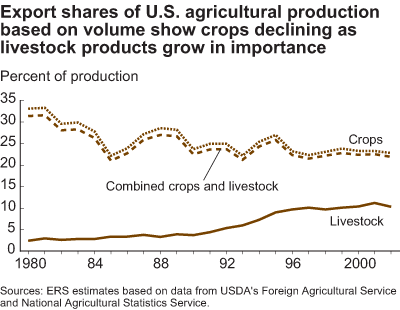
- The export share of U.S. agricultural production, based on volume, has averaged 22 percent since 1996, reflecting the high weight of exported food and feed grains, oilseeds and oilseed products, cotton, and tobacco relative to their total harvested weight. However, this overall export share masks differences in trends between livestock products and crops and crop products. The export share of U.S. livestock products rose from 3 percent in the 1980s to more than 10 percent in recent years, while the export share of crops and crop products fell from over 30 percent to 23 percent during the same period. Behind these contrasting trends has been the increase in U.S. livestock and poultry production and the corresponding feed requirements that have diminished feed grains available for export.
- The export share of U.S. agricultural products, based on values, averaged 17 percent from 1998 to 2002, 5 percentage points lower than the volume-based average. The lower value-based measure reflects the lower aggregate value of livestock exports relative to their farm production value. The historical movement of the two export share measures shows no consistent pattern—about half the time they move in the same direction and the other half not. For example, the volume-based share declined from 23 percent in 2001 to 22 percent in 2002, while the value-based share rose from 17 to 18 percent.


