Nonmetro Black Migration Reverses Trends of Earlier Decades
- by Calvin L. Beale
- 4/1/2003
The migration of Blacks out of the rural South was one of the most dramatic population trends of the 20th century. Between 1940 and 1970, about 4 million Blacks (out of an average annual base of less than 11 million) left the South altogether, while large numbers also moved from the countryside into southern cities. With farming no longer the major employment of Blacks who have remained in the rural South, what are the more recent patterns since the end of the large midcentury migration?
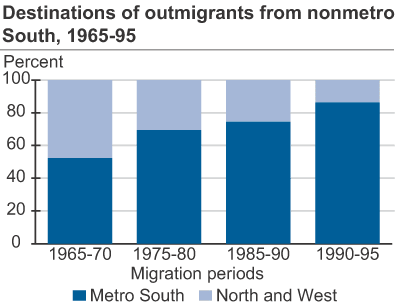
From 1965 to 1995, the most significant change in Black migration from southern nonmetropolitan (nonmetro) counties was a major drop in the number and proportion that moved to the North or West. From 1965 to 1970, near the end of the period of peak outmigration, 46 percent of Blacks leaving the nonmetro South went to the North or West. But by 1985-90, there was a small net flow of Blacks back to the nonmetro South from the North and West, and by 1990-95, only 13 percent of Blacks leaving the nonmetro South elected to go to other regions, as most settled in southern metropolitan (metro) areas instead.
Although people moving in opposite directions may offset each other in numbers, they are not necessarily alike in characteristics. From 1985 to 1995, Black migration led to a net loss of college-educated Blacks from the nonmetro South, as only half as many college graduates came in as moved out. At the same time, 11 percent more Blacks who had not finished high school moved into the nonmetro South than moved away. Thus, the loss of college graduates and the arrival of more people with limited education slowed the educational advance of the nonmetro Black population.
Given the educational makeup of migrants, it is not surprising that the 1990 poverty rate of Blacks who had moved into the nonmetro South from 1985 to 1990 nearly equaled that of nonmetro residents who had stayed put during that time. For both newly arrived and longstanding nonmetro Blacks, two-fifths lived in households with poverty-level incomes, three times the rate of the Nation as a whole (13 percent). Blacks who moved away from the nonmetro South between 1985 and 1990 had slightly lower poverty levels than those who did not move, reflecting both the outmigrants' higher schooling and the steadier, better paid jobs in their metro destinations.
Although migration data are not yet available from the 2000 Census, we know that in the 1990s the southern nonmetro Black population rose by 11 percent, versus just 1.4 percent in the 1980s. This trend suggests that many more Blacks are judging the nonmetro South favorably as a place to live than have done so in the past.
This article is drawn from:
- The Shifting Pattern of Black Migration From and Into the Nonmetropolitan South, 1965-95. (2001). USDA, Economic Research Service.


