


Crop Commodity Programs
Crop Commodity Programs: Title I
Title I of the 2018 Farm Act authorizes USDA’s Farm Service Agency to administer a variety of producer support programs, many of which carry over from the 2014 Farm Act with minor adjustments.
The two largest Title I programs, Price Loss Coverage (PLC) and Agriculture Risk Coverage (ARC), pay producers who have eligible historical base acres when prices and/or yields of covered commodities fall below a certain amount, regardless of their current planting decisions. The Nonrecourse Marketing Assistance Loan Program (MAL) offers financing options to producers facing low prices. The Noninsured Crop Disaster Assistance Program (NAP) offers risk protection for producers of crops not covered by Federal crop insurance programs.
"Covered commodities" for PLC and ARC include wheat, corn, sorghum, barley, oats, seed cotton, long- and medium-grain rice, certain pulses, soybeans/other oilseeds, and peanuts. Commodities eligible for MAL include wheat, corn, sorghum, barley, oats, upland and extra-long-staple cotton, long- and medium-grain rice, soybeans/other oilseeds, certain pulses, peanuts, sugar, honey, wool, and mohair.
Highlights
- New provisions revise the set of payment types subject to payment limitations, and a broader range of relatives of the primary operator on family operations are now potentially eligible for payments.
- As in the 2014 Act, producers elect to participate in either ARC or PLC, but the 2018 Act allows them to change their program elections annually beginning in crop year 2021.
- Price Loss Coverage and Agriculture Risk Coverage payment formulas now use an effective reference price which accounts for movements in the market price of the covered commodity, and can rise up to 15 percent above the price floors (known as reference prices) established in the 2014 Farm Act.
- ARC benchmark revenue formulas now reflect historical yield trends. Plug yields, used to mitigate the effects of low-yielding years on the benchmark, have risen from 70 to 80 percent.
Adjustments to Programs
Payment Limitations. The 2018 Farm Act maintains the limits on producer payments from PLC and ARC at $125,000 for a person or legal entity (excepting a joint venture or general partnership). Payments from marketing loan gains and loan deficiency payments, however, are no longer subject to payment limitations. Moreover, the new Act broadens the definition of a “family member” potentially eligible to receive payments to include first cousins, nephews, and nieces of the primary operator.
Base Acres Planted to Grass or Pasture. Producers with base acres planted to grass or pasture (including land that was idle or fallow) from the beginning of 2009 to the end of 2017 will maintain those base acres. However, those base acres are now ineligible for PLC and ARC payments.
Effective Reference Price. Under the 2018 Farm Act, both ARC and PLC now rely on an effective reference price for triggering payments. Defined as the greater of (1) 85 percent of the 5-year Olympic average or (2) the reference price established in the 2014 Farm Act—and limited to no more than 115 percent of the reference price—the effective reference price allows for the price trigger to adjust in response to market conditions. Table 1 presents the effective reference price calculation across a selection of covered commodities based on 2017 market conditions.
| Effective reference price ($) (lesser of A and B) | |||
|---|---|---|---|
| A. 115% of the reference price | B. The greater of (i) and (ii): | ||
| (i) Reference price | (ii) 85% of Olympic average of Market Year Average Price | ||
| Covered commodities | |||
| Wheat (bushel) | 6.33 | 5.50* | 4.42 |
| Corn (bushel) | 4.26 | 3.70* | 3.02 |
| Grain sorghum (bushel) | 4.54* | 3.95 | 5.34 |
| Barley (bushel) | 5.69 | 4.95* | 4.47 |
| Oats (bushel) | 2.76 | 2.40* | 2.24 |
| Long-grain rice (cwt) | 16.10 | 14.00* | 9.80 |
| Medium-grain rice (cwt) | 16.10 | 14.00 | 14.11* |
| Soybeans (bushel) | 9.66 | 8.40* | 8.19 |
| Dry peas (cwt) | 12.65 | 11.00* | 10.37 |
| Lentils (cwt) | 22.97 | 19.97 | 22.33* |
| Small chickpeas (cwt) | 21.90 | 19.04 | 20.60* |
| Large chickpeas (cwt) | 24.77* | 21.54 | 26.52 |
| Peanuts (ton) | 615.25 | 535.00* | 368.33 |
| Seed cotton (lbs.) | 0.42 | 0.37* | 0.28 |
| Note: * indicates the resulting reference price. An Olympic average is the average of the most recent 5 years of data, excluding the years with the highest and lowest values. Source: Marketing year average prices (MYAP) are from USDA, National Agricultural Statistics Service (NASS), QuickStats (2018). Reference prices are from the 2014 Farm Act. Nonrecourse Marketing Assistance Loan rates come from the 2018 Farm Act. Calculations performed by USDA, Economic Research Service. |
|||
Price Loss Coverage (PLC). The 2018 Farm Act updates the PLC program to pay producers with eligible historical base acres when a covered commodity’s market-based effective price (the greater of the commodity’s marketing year average price or its Nonrecourse Marketing Assistance Loan rate) falls below its effective reference price. (See discussion above.) Under the 2018 Farm Act, PLC also offers producers a one-time opportunity to update their payment yields that take effect beginning with the 2020 crop year. For each covered commodity, the update is defined as 90 percent of the farm’s average yield per planted acre over crop years 2013-17 (excluding any years where the farm’s acreage planted in the crop was zero), multiplied by a ratio that is constrained to lie between 0.9 and 1 and is calculated as the crop’s average national yields in 2008-12 divided by the crop’s average national yields in 2013-17.

Finally, for purposes of yield updates, any year during 2013-17 for which farm-level yield falls below 75 percent of the average county yield is assigned 75 percent of the 2013-17 average county yield. Seed cotton, a covered commodity since 2018, is assigned a payment yield 2.4 times the average lint yield for upland cotton.
Agriculture Risk Coverage (ARC). First introduced in the 2014 Farm Act, ARC pays producers with eligible historical base acres when their county’s average per-acre revenues for a covered commodity, based on realized yields and prices, fall below a guaranteed level (based in part on the new effective reference price). The 2018 Farm Act further updates the ARC calculation by including a trend adjustment for both the average historical county yield and the actual average county yield per planted acre. This trend adjustment cannot exceed the trend-adjusted yield factor that is used to increase yield history under the Federal Crop Insurance Act for that crop and county. Moreover, the 2018 Farm Act requires the floor of permissible annual yield values, known as the yield plug, to rise from 70 percent of transitional yields (yields used for crop insurance policies that are based on county average yields and are typically used in lieu of actual yields for producers who do not have sufficient eligible historical yields) to 80 percent.
The 2018 Farm Act prioritizes the use of USDA, Risk Management Agency administrative data in the calculation of guarantees and actual yields over the NASS survey-generated data prioritized under the 2014 Act. USDA must assign separate yields for irrigated and non-irrigated areas.
Producers who choose not to elect either ARC or PLC in 2019 will receive no ARC or PLC payments for crop year 2019. In subsequent years, USDA defaults these producers to the election made during the 2014 Farm Act.
Noninsured Crop Disaster Assistance Program (NAP). Typically considered a disaster assistance program, NAP fell under the Miscellaneous Title (Title XII) of the 2014 Farm Act. Under the 2018 Farm Act, Congress placed NAP under the Commodity Title (Title I). NAP is a risk protection program for commodities not covered under the Federal Crop Insurance Program. In the 2018 Farm Act, service fees for eligible crops rise (table 2).
| 2014 Farm Act | 2018 Farm Act | ||
|---|---|---|---|
| Lesser of: | Lesser of: | ||
| (i) $250 per crop per county | (ii) $750 per producer per county | (i) $325 per crop per county | (ii) $825 per producer per county |
| Not to exceed: $1,875 per producer | Not to exceed: $1,950 per producer | ||
| Source: 2014 Farm Act and 2018 Farm Act. | |||
The Act also sets separate annual payment limits for catastrophic coverage ($125,000) and additional buy-up coverage ($300,000). Additional buy-up coverage under NAP is also made permanently available.
Nonrecourse Marketing Assistance Loan Program. Offers producers short-term loans during harvest time when market prices tend to be lowest, allowing them to delay the sale of the commodity until market conditions improve. The 2018 Farm Act raises the loan rates (table 3) for many commodities (the price per unit—pound, bushel, bale, or hundredweight—at which the Commodity Credit Corporation provides commodity-secured loans to farmers for a specified period of time). Moreover, the 2018 Farm Act updates the upland cotton loan rate by adjusting its lower bound to include the condition that it cannot fall below 98 percent of the preceding year’s loan rate for the base quality of upland cotton.
| Commodity | 2014 Farm Act ($) | 2018 Farm Act ($) | Percent change | |
|---|---|---|---|---|
| Wheat (bushel) | 2.94 | 3.38 | 15 | |
| Corn (bushel) | 1.95 | 2.20 | 13 | |
| Grain sorghum (bushel) | 1.95 | 2.20 | 13 | |
| Barley (bushel) | 1.95 | 2.50 | 28 | |
| Oats (bushel) | 1.39 | 2.00 | 44 | |
| Extra long staple cotton (lb) | 0.7977 | 0.95 | 19 | |
| Long-grain rice (cwt) | 6.50 | 7.00 | 8 | |
| Medium-grain rice (cwt) | 6.50 | 7.00 | 8 | |
| Soybeans (bushel) | 5.00 | 6.20 | 24 | |
| Dry peas (cwt) | 5.40 | 6.15 | 14 | |
| Lentils (cwt) | 11.28 | 13 | 15 | |
| Small chickpeas (cwt) | 7.43 | 10 | 35 | |
| Large chickpeas (cwt) | 11.28 | 14 | 24 | |
| Peanuts (ton) | 355 | 355 | 0 | |
| Note: Rates for commodities not listed—including other oilseeds—graded and nongraded wool, mohair, and honey, did not change in the 2018 Farm Act. Source: 2014 Farm Act, 2018 Farm Act, and USDA, Economic Research Service calculations. |
||||
Economic Implications
- The newly created effective reference price that applies to both PLC and ARC establishes a payment trigger for covered commodities that now can vary between 100 and 115 percent of the reference price established in the 2014 Farm Act. The higher potential price trigger level under the 2018 Farm Act makes possible higher and more frequent ARC and PLC payments than under the previous Act.
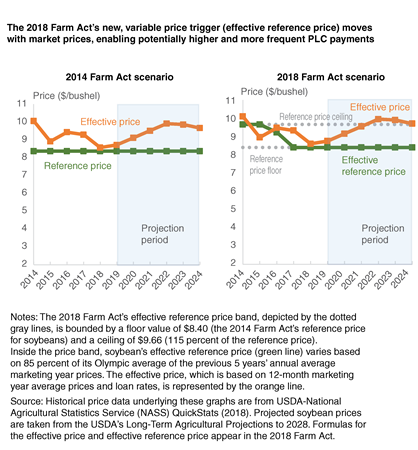
The figure below presents an example of soybean payments under PLC, comparing the 2014 and 2018 Acts. Using prices from both recent history and USDA’s latest projections, it shows the effective price of soybeans, which remains the same under both Acts, alongside each Act’s different soybean price trigger, dubbed the reference price in the 2014 Act and the effective reference price in the 2018 Act. In the 2014 Farm Act scenario (left chart), the reference price remains constant (green line) and lies below the effective price (orange line) throughout the entire period, both historical and projected. Thus, under the 2014 Farm Act scenario, a producer would not receive PLC payments in any year. In contrast, under the 2018 Farm Act scenario (right chart), the effective reference price varies from year to year. As a result, in one year, 2015, the effective reference price exceeds the effective price and triggers a PLC payment, illustrating how the 2018 Farm Act could lead to more frequent and higher payments.
- The rise in ARC’s yield plug (the floor of permissible annual yield values) from 70 to 80 percent of transitional yields potentially raises ARC payments by lifting the county benchmark yield value. Table 4 illustrates this with a fictitious county that experiences 5 years of varying corn yields, for which different Olympic averages can be obtained. Assuming a transitional yield of 150 bushels per acre and multiplying by 70 percent generates a yield plug of 105 bushels per acre under the 2014 Farm Act. Under the 2018 Farm Act, the yield plug increases to 80 percent of the transitional yield, or 120 bushels per acre. Applying these different plugs to the calculation of the county’s Olympic average yield leads to potentially higher benchmark yield values (and possibly higher ARC payments) under the 2018 Farm Act.
| Year | Actual county yield (bu/acre) | County yield benchmark (bu/acre): 2014 Farm Act | County yield benchmark (bu/acre): 2018 Farm Act |
|---|---|---|---|
| 2019 | 160 | 160 | 160 |
| 2020 | 115 | 115 | 120* |
| 2021 | 100 | 105* | 120* |
| 2022 | 90 | 105* | 120* |
| 2023 | 150 | 150 | 150 |
| Olympic average | 121.67 | 123.33 | 130.00 |
| Note: * Indicates where plug yields would be triggered. An Olympic average is the average of the most recent 5 years of data, excluding the years with the highest and lowest values. Calculations performed by USDA, Economic Research Service. |
|||
- Given the relatively low commodity prices of late and current USDA projections for relatively stable prices in the near future, near-term uptake in ARC may be low. Consequently, PLC may attract more participants and ultimately account for a greater portion of Title I payments. Also, with the new range of effective reference prices that can reach up to 15 percent above the reference price used in the 2014 Farm Act, market prices are more likely to trigger PLC payments, at potentially higher amounts