


ERS Celebrates World Statistics Day 2020
Connecting the world with data we can trust
Every five years, the United Nations designates October 20 as World Statistics Day to celebrate the importance of official statistics.
This year’s World Statistics Day theme of “Connecting the world with data we can trust,” reflects on the importance of trust, authoritative data, innovation, and the public good in national statistical systems. As one of the principal federal statistical agencies, ERS must adhere to rigorous data quality standards. Every employee is mandated to follow these standards, ensuring our agency will continue producing timely, accurate, unbiased, and trustworthy statistics.
ERS economists and social scientists develop and disseminate a broad range of science-based economic and statistical information to the public. ERS research informs decisions on agriculture, food, the environment, and rural America, and therefore, affects everyone in the U.S.
ERS Celebrates World Statistics Day
- USDA World Statistics Day Video: World Statistics Day: Connecting the world with data we can trust.
- USDA Blog: USDA’s Two Statistical Agencies Produce Quality, Trusted Information.
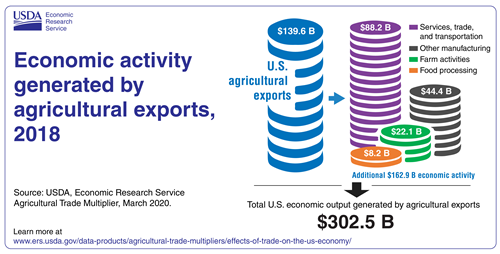
- Chart of Note: World Statistics Day: Agricultural Trade Multipliers showcase the many ways agricultural exports affect U.S. economy.
- Countdown to World Statistics Day: Follow us on Twitter @USDA_ERS for our stat-a-day Countdown to WSD.


ERS International Data You Can Use on World Statistics Day
- ERS Commodity Outlook Reports provide supply and demand forecasts for major crop and livestock commodities for the nation and the world.
- Outlook for U.S. Agricultural Trade is released quarterly (November, February, May, August) to provide information on USDA’s forecasts for U.S. agricultural trade in Fiscal Year 2020.
- International Markets & U.S. Trade data include a variety of products such as analyses of key trading partners, information on global food security, and projections of supply and demand for agricultural commodities.
- U.S. Agricultural Trade at a Glance provides charts showcasing U.S. agricultural export and import data.
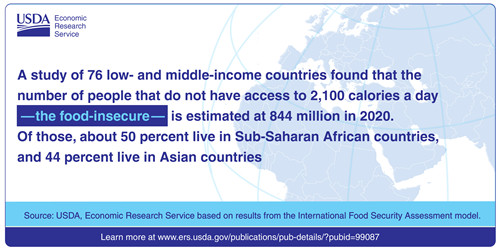
- International Food Security Assessment, 2020–30 , provides information to estimate long-term projections of food security in 76 low- and middle-income countries.
ERS Charts, Articles, Reports, and More
- Amber Waves online magazine showcases the full range of ERS research and analysis.
- Ag and Food Statistics: Charting the Essentials provides 70 charts and maps highlighting the basics on food, farming, and rural America.
- ERS Charts of Note highlight our current and past research.
- ERS State Fact Sheets include data by state on population, income, poverty, food security, education, employment/unemployment, farm characteristics, farm financial indicators, top commodities, and agricultural exports.
- Rural America at a Glance, 2019 Edition highlights the most recent indicators of social and economic conditions in rural areas, focusing on county-level population trends, employment, income, and poverty.
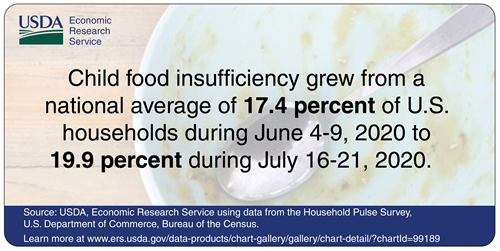
- Household Food Security in the United States in 2019 estimated 10.5 percent of U.S. households were food insecure at least some time during the year in 2019, meaning they lacked access to enough food for an active, healthy life for all household members.
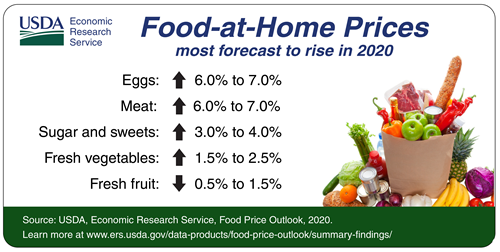
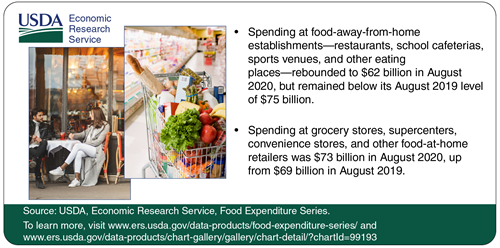
- ERS Food Price Outlook provides monthly food price forecasts, including for both food purchased for consumption at home and away from home.
- ERS Insights Webinars are available on topics such as Household Food Security in the United States, Farm Income and Financial Forecasts, and Rural America at a Glance.
- Subscribe to ERS e-newsletter.
ERS Interactive Tools
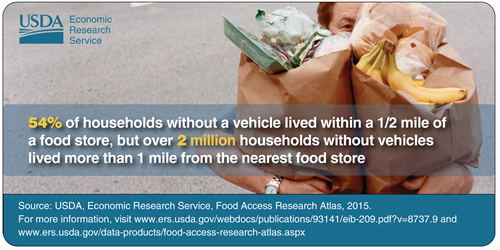
- Food Access Research Atlas presents a spatial overview of food access indicators for low-income and other census tracts using different measures of supermarket accessibility.
- Food Environment Atlas assembles statistics on over 275 food environment indicators at the county or State level that can influence food choices and diet quality.
- Atlas of Rural and Small Town America provides county-level statistics by broad categories of socioeconomic factors, including demographic and economic data and county classifications.
Learn More About ERS
- The ERS mission is to anticipate trends and emerging issues in agriculture, food, the environment, and rural America and to conduct high-quality, objective economic research to inform and enhance public and private decision making.
- ERS Data Product Quality Standards describe the principles that ERS will follow to make certain these quality standards are embedded in data products provided to key stakeholders and the public.
- USDA’s Scientific Integrity Policies ensure the flow of objective, credible statistics to support the decisions of governments, businesses, households, and other organizations.