Rural Employment and Unemployment
Note: The terms "nonmetropolitan" (nonmetro) and "rural" are used interchangeably, as are "metropolitan" (metro) and "urban." References to metro and nonmetro areas reflect either the 2003 or the 2013 definition of metropolitan counties, as determined by the U.S. Office of Management and Budget, as indicated.
This topic page examines employment and labor force trends in rural and urban areas from 2007 to 2022, using data from the U.S. Bureau of Labor Statistics. Three indicators are tracked: employment levels (number of people employed), labor force participation rates (the share of the civilian noninstitutionalized population that is working or actively looking for work), and prime-working-age unemployment rates (the share of the labor force age 25–54 that is unemployed).
The time period covers the Great Recession (2007–09), the ensuing economic recovery (2010–19), and the COVID-19 pandemic and ongoing economic recovery (2020–22). Employment and labor force impacts varied by metropolitan status, age group, and race/ethnicity—revealing the uneven impacts of economic recession and recovery across the rural and urban United States.
Employment Levels
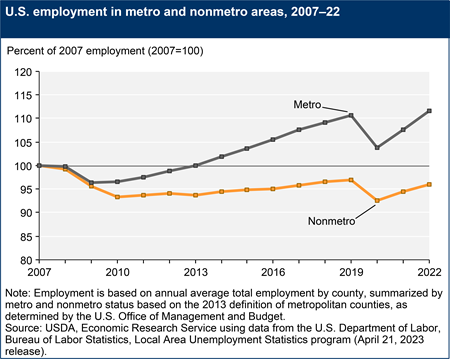
After nonmetro areas lost 1.4 million jobs between 2007 and 2010, nonmetro employment grew slowly and by 2019 had returned to 97 percent (20.4 million employed) of pre-Great Recession employment levels (21.0 million employed in 2007). The slow-employment-growth period from 2010 to 2019 partially coincided with the first ever period of overall nonmetropolitan population decline between 2010 and 2016 (see Rural America at a Glance, 2019 Edition). The lack of rural population growth and coinciding soft demand for local goods and services likely contributed to slow employment growth in nonmetro areas.
Nonmetro total employment had not yet fully recovered from the Great Recession when the COVID-19 pandemic and measures taken to limit its spread by governments, businesses, and consumers resulted in nationwide job losses. In 2020, nonmetro employment fell to 92 percent (19.4 million employed) of its 2007 level, lower than at any point during the Great Recession. Metropolitan areas lost a larger share of jobs than nonmetro areas, but metro employment remained above its 2007 level. The higher share of jobs lost in metro areas was likely due, in part, to more restrictive COVID-19 precautionary measures taken by urban local governments and because urban workers were more likely to work in 'nonessential' jobs (such as service-industry jobs) than rural workers. Many jobs transitioned to remote work during the pandemic, which may have benefitted workers who lived in places with reliable highspeed internet connections and workers in jobs where remote work is possible.
Between 2020 and 2022, employment in nonmetro areas increased 3.8 percent but did not recover to the pre-pandemic level of 2019; employment in metro areas increased 7.4 percent during the same period and, in 2022, surpassed 2019 pre-pandemic employment.
Labor Force Participation Rates
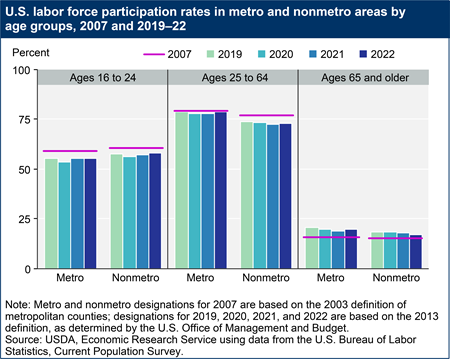
Labor force participation rates (defined as the percentage of the civilian noninstitutionalized population that is either working or actively looking for work) decreased 2.6 percentage points among people ages 25–64 in the nonmetro United States and 0.7 percentage points in the metro United States from 2007 to 2019. The larger decrease in nonmetro labor force participation rates reflects the slower recovery in rural areas after the Great Recession and suggests that rural workers faced a choice between moving to urban areas to find work and remaining in rural areas where there were fewer jobs post-Great Recession. People 65 and over were more likely to be employed or seeking employment in 2019 than in 2007. Increasing labor force participation rates for people 65 and over may indicate a lack of retirement savings or inadequate health insurance coverage (forcing people to remain in the labor force), but may also indicate better work opportunities and conditions (enticing some workers to remain at their jobs beyond age 65).
Between 2019 and 2020 (the first year of the COVID-19 pandemic), across all age groups examined, metro areas saw larger percentage-point declines in labor force participation than nonmetro areas, with the largest declines among the population ages 16–24. By 2022, the labor force participation rate for people ages 16-24 in nonmetro areas had recovered to the pre-pandemic levels of 2019, but it remained about one percentage point below 2019 levels for both older age groups.
Prime-Working-Age Unemployment Rates
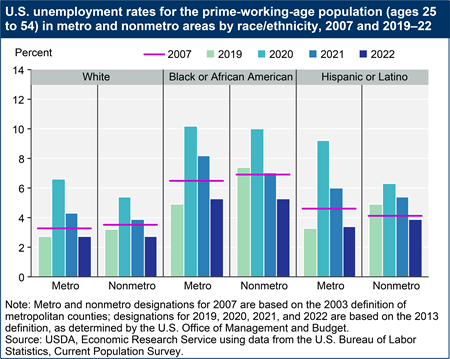
Examining unemployment rates of the prime-working-age (ages 25–54) population minimizes the effect that an aging population may have on unemployment rates over time and minimizes the effect of different age compositions across racial and ethnic groups. From 2007 to 2019, prime-working-age unemployment rates decreased from 3.7 percent to 3.0 percent in metro areas and from 3.9 percent to 3.7 percent in nonmetro areas. Unemployment rates for prime-working-age adults also declined from 2007 to 2019 among metro White, Black/African American, and Hispanic racial and ethnic groups, and for nonmetro Whites. Prime-working-age unemployment rates in nonmetro areas increased from 2007 to 2019 for Blacks/African Americans (+0.5 percentage points) and Hispanics/Latinos (+0.8 percentage points). Therefore, while the gap between prime-age unemployment rates for Whites, Blacks/African Americans, and Hispanics/Latinos narrowed in metro areas from 2007 to 2019, the gap widened in nonmetro areas between Whites (whose unemployment rates decreased) and Blacks/African Americans and Hispanics/Latinos (whose unemployment rates increased during the period).
Pandemic-related restrictions on economic activity, social distancing, and a decrease in consumer activity during the coronavirus pandemic contributed to increasing unemployment in 2020, when prime-age unemployment rates increased to 7.3 percent in metro areas and to 5.9 percent in nonmetro areas. Among racial/ethnic groups examined, prime-working-age unemployment rates increased the most for Blacks/African Americans (+5.3 percentage points) and Hispanics/Latinos (+5.9 percentage points) in metro areas from 2019 to 2020. In nonmetro areas, unemployment rates increased the most for Blacks/African Americans (+2.6 percentage points) followed by Whites (+2.2 percentage points) and Hispanics/Latinos (+1.4 percentage points). In 2022, unemployment rates in nonmetro areas dropped below pre-pandemic levels for prime-working-age Whites, Blacks/African Americans, and Hispanics/Latinos.