Editors' Pick Charts of Note 2018
This chart gallery is a collection of the best Charts of Note from 2018. These charts were selected by ERS editors as those worthy of a second read because they provide context for the year’s headlines or share key insights from ERS research.

Tuesday, May 1, 2018
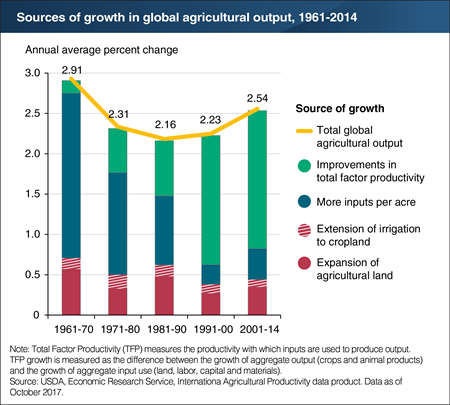
Since the 1990s, productivity growth has driven the growth in global agricultural output of total crop and livestock commodities, helping to make food more abundant and cheaper worldwide. Global output growth initially slowed in the 1970s and 1980s, but then accelerated in the 1990s and 2000s. In the latest period (2001-14), global output of total crop and livestock commodities expanded at an average rate of 2.5 percent per year. In the decades prior to 1990, most output growth came about from intensification of input use, such as using more labor, capital, and material inputs per acre of agricultural land. Bringing new land into agricultural production and extending irrigation to existing agricultural land were also important sources of growth. Over the last two decades, however, the rate of growth in agricultural resources (land, labor, capital, etc.) has significantly slowed. By comparison, improvements in total factor productivity have increased, accounting for about two-thirds of global output growth during 2001-14. TFP growth reflects the use of new technology, efficiency improvement, and changes in management by agricultural producers around the world. This chart appears in the ERS topic page for International Agricultural Productivity, updated October 2017.

Thursday, April 26, 2018
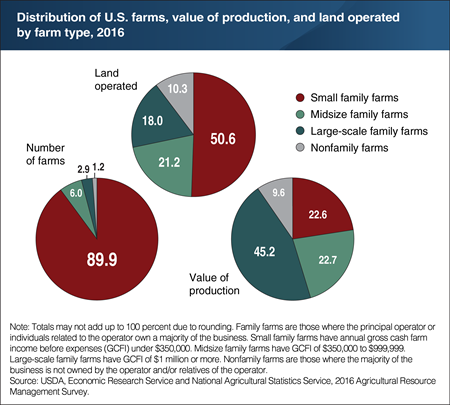
In 2016, 99 percent of U.S. farms were family farms, where the principal operator and his or her relatives owned the majority of the business. Small family farms—those with less than $350,000 in annual gross cash farm income (GCFI)—accounted for about 90 percent of U.S. farms, half of all farmland, and a quarter of the value of production. By comparison, large-scale family farms—those with $1 million or more in GCFI—made up only 3 percent of U.S. farms and 18 percent of farmland, but contributed 45 percent of production. Nonfamily farms, such as partnerships of unrelated partners and corporations, accounted for just 1 percent of U.S. farms and 10 percent of production. The 19 percent of nonfamily farms with GCFI of $1 million or more accounted for 88 percent of all nonfamily farms’ production. This chart appears in the ERS report America’s Diverse Family Farms: 2017 Edition, released December 2017.

