ERS Charts of Note
Subscribe to get highlights from our current and past research, Monday through Friday, or see our privacy policy.
Get the latest charts via email, or on our mobile app for  and
and 
Tuesday, January 19, 2021
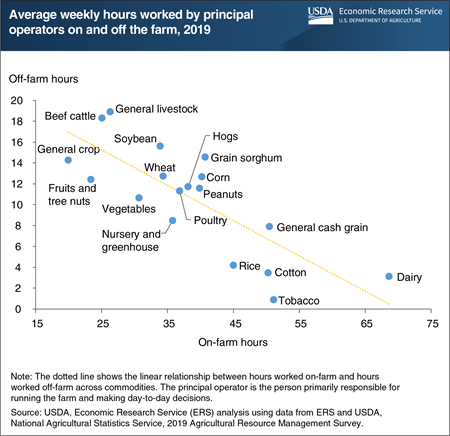
Off-farm income supplements farm income for most farm households, in addition to offering benefits such as health insurance. In 2019, about 71 percent of farm households had one or more household members earning an off-farm salary or wage. More than 40 percent of principal operators worked off-farm, contributing about 54 percent of the total off-farm labor hours reported for their households. Principal operators who reported off-farm employment worked on average 15 hours off the farm per week in 2019. Compared with the seasonality of on-farm work, off-farm work offered principal operators more consistency—with operators working about 25 percent of total off-farm hours in each quarter of the year. However, principal operators who worked more on-farm tended to work less off-farm across a variety of commodities. On average, principal operators with livestock, beef cattle, and fruit and tree nut farm operations worked fewer on-farm hours and more off-farm hours in 2019. Principal operators on those farms may be more vulnerable to disruptions in the off-farm economy, such as increased unemployment because of the COVID-19 pandemic. This chart updates data found in the December 2018 Amber Waves finding, “Farm Households Divide Their Time Between On-Farm and Off-Farm Labor.”
See also: Farms and Farm Households During the COVID-19 Pandemic.
Friday, January 8, 2021
Errata: On January 13, 2021, the charts on residence and intermediate farms were revised to correct the labels for “Median total income” and “Median off-farm income.”
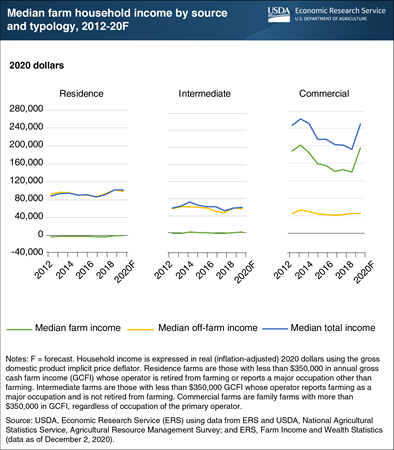
In 2020, USDA’s Economic Research Service (ERS) expects the inflation-adjusted median household income for the principal operators of commercial and intermediate U.S. farms to increase by an estimated 29.6 percent and 4.9 percent, respectively. By comparison, household income for principal operators of residence farms is estimated to remain relatively unchanged. Many farm households rely on a combination of on-farm and off-farm income sources. Generally, residence farms rely most on off-farm income sources. ERS forecasts the median off-farm income for residence, intermediate, and commercial farm households to decline in 2020, with residence farms expected to have the largest percentage decline at 3.4 percent. This decline is due to estimated lost employment and wage income as a result of the coronavirus pandemic, which is partially offset by estimated Economic Impact Payments distributed to most U.S. households as part of the pandemic financial relief efforts. Median farm income for intermediate farm households is forecast to increase by 165 percent, from $662 in 2019 to $1,756 in 2020. By comparison, median farm income for commercial farm households is expected to increase by 39 percent, from $140,729 in 2019 to $194,982 in 2020. Median farm income for residence farms households is estimated to increase too, from –$810 in 2019 to –$160 in 2020. The increase in median farm income is due to pandemic financial relief payments from Federal programs, such as the Paycheck Protection Program (PPP) and the Coronavirus Food Assistance Programs (CFAP) 1 and 2. The increases in median farm incomes were partially offset by the decline in median off-farm income. Because households operating residence farms rely most on off-farm income sources and are estimated to receive smaller amounts of government programs, their median total household income is forecast to decline slightly overall. This chart uses data from ERS’s Agricultural Resource Management Survey webtool and the Farm Income and Wealth Statistics data product, released December 2020.
Wednesday, December 2, 2020
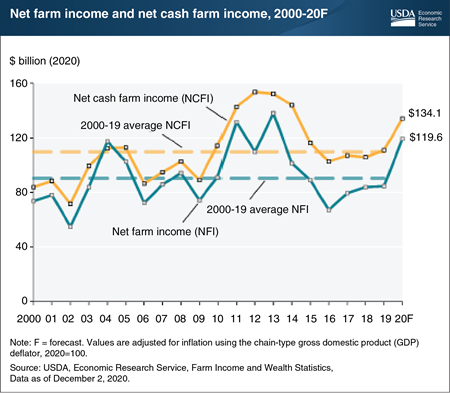
Inflation-adjusted U.S. net cash farm income (NCFI)—gross cash income minus cash expenses—is forecast to increase $23.4 billion (21.1 percent) to $134.1 billion in 2020. U.S. net farm income (NFI), a broader measure of farm sector profitability that incorporates noncash items including changes in inventories, economic depreciation, and gross imputed rental income, is forecast to increase $35.0 billion (41.3 percent) from 2019 to $119.6 billion in 2020. While cash receipts for farm commodities are forecast to fall $7.8 billion (2.1 percent), direct Government payments are expected to rise to $46.5 billion, more than twice the 2019 amount, a result of supplemental and ad hoc disaster assistance payments for COVID-19 relief in 2020. Total production expenses, which are subtracted out in the calculation of net income, are projected to fall $9.5 billion (2.7 percent) in 2020, including a drop of $5.6 billion in interest expenses. If forecasts are realized, NFI in 2020 would be at its highest level since 2013 and 32.0 percent above its inflation-adjusted average calculated over the 2000-19 period. NCFI would be at its highest level since 2014 and 22.5 percent above its 2000-19 average. Find additional information and analysis on the USDA, Economic Research Service Farm Sector Income and Finances topic page, reflecting data released December 2, 2020.
Monday, November 9, 2020
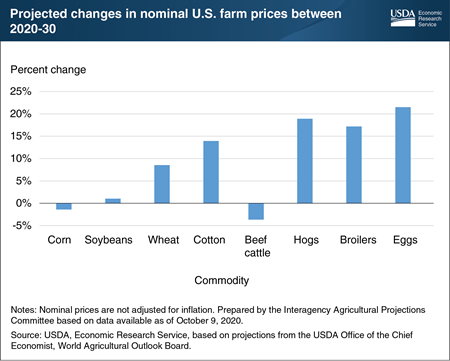
USDA projections for changes in nominal (not adjusted for inflation) U.S. farm prices between 2020 and 2030 indicate a mixed outlook shaped by the expected recovery in U.S. and global demand, continued export competition, and market conditions during 2020. For crops, the strongest gains are projected for wheat and cotton. Wheat prices are projected to rise as domestic and export demand begin to outpace domestic production, while higher cotton prices are driven by a projected recovery in export demand. Modest changes in prices for U.S. corn and soybeans from current levels reflect the relatively steady demand for these products during 2020, together with the moderating influences of productivity gains and continued export competition. Among livestock products, farm prices of hogs, broilers, and eggs are projected higher by 2030, as economic recovery restores growth in domestic and export demand. U.S. beef cattle prices are expected to rise during the early years of the 10-year projection period, before declining somewhat as the multi-year cattle cycle and a longer-term trend of sluggish demand growth turn prices downward. The projections are based on an assumed long-term macroeconomic outlook that includes a recovery in income growth—beginning in 2021—from the declines that have occurred in most economies during 2020. The outlook for the U.S. economy, and for many important U.S. agricultural markets and competitors, however, remains uncertain. This chart is based on projections prepared by the USDA Interagency Projections Committee using data available as of October 9, 2020, and released by the Office of the Chief Economist on November 6, 2020. Updates are shown in the Economic Research Service Agricultural Baseline Database.
Monday, November 2, 2020
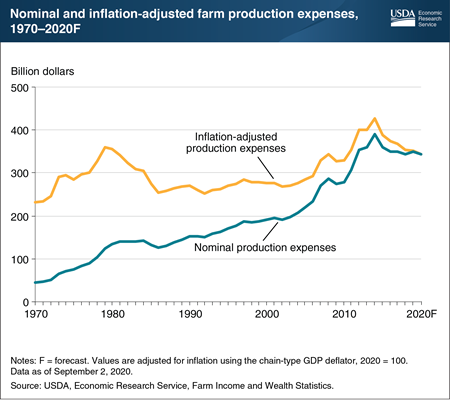
Farm sector production expenses (including expenses associated with operator dwellings) are forecast to decrease by $4.6 billion (1.3 percent) to $344.2 billion in 2020 in nominal terms, i.e. not adjusted for inflation. These expenses represent the costs of all inputs used to produce farm commodities and strongly affect farm profitability. Although overall production expenses are expected to decrease, changes in specific expenses vary. Specific expenses forecast to increase in 2020 account for approximately 69 percent of total expenses and are projected to collectively rise by $6.0 billion relative to 2019 before adjusting for inflation. These include the two largest expense categories—feed purchases (1.4 percent increase from 2019) and cash labor (3.1 percent). In contrast, expenses expected to decrease account for 31 percent of total expenses and are forecast to collectively decline by $10.6 billion from 2019 to 2020. Specifically, livestock and poultry purchases are anticipated to decrease by 7.5 percent, pesticides by 2.1 percent, and oil and fuel spending by 13.9 percent. In addition, interest expenses are forecast to be at their lowest level since 2014 (not adjusted for inflation), dropping by 27.1 percent ($5.6 billion) from 2019 as a result of historically low interest rates. After adjusting for inflation, total production expenses in 2020 are 19 percent below the record high of $427.1 billion in 2014, continuing a six-year streak of declining expenses. This chart appears in the ERS topic page for Farm Sector Income and Finances, updated September 2020.
Friday, September 11, 2020
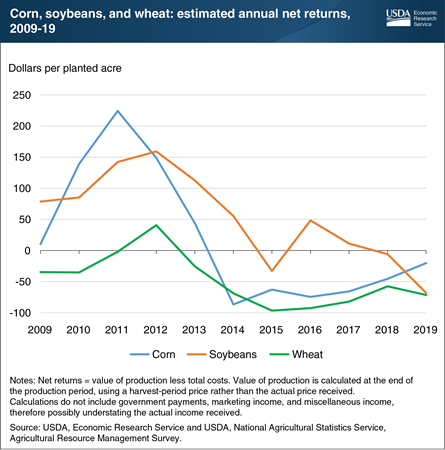
Producers of some of the U.S. major field crops have struggled to cover total costs of production over the past decade. The Economic Research Service’s (ERS) Commodity Costs and Returns product estimates this gap or surplus in the calculation of the value of production less total costs, referred to here as net returns. Total costs comprise operating costs, which include expenses such as fertilizer, seed, and chemicals, and allocated overhead (economic) costs, which include unpaid labor, depreciation, land costs, and other opportunity costs. Although revenue from selling crops can typically cover operating costs each year, net returns have often been negative. This suggests that, in some cases, allocated overhead costs are not covered. Corn’s net returns increased early in the decade, primarily due to a boom in the production of corn-based ethanol. Corn yields and acreage remained high after the boom, leaving supply high and leading, in part, to lower prices and returns over time. Net returns for soybeans shadowed those for corn during the ethanol boom, remaining higher than those for corn up until 2018. Wheat prices and returns also declined, due to strong international competition and several high-yield domestic crops. This chart is derived from data collected from the ERS Commodity Costs and Returns data product. Its data can also be viewed via ERS’s interactive data visualization product, U.S. Commodity Costs and Returns by Region and by Commodity.
Wednesday, September 2, 2020
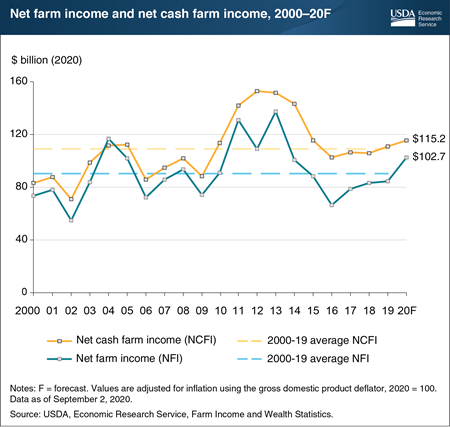
Inflation-adjusted U.S. net cash farm income (NCFI), defined as gross cash income less cash expenses, is forecast to increase $4.0 billion (3.6 percent) to $115.2 billion in 2020. U.S. net farm income (NFI)—a broader measure of farm sector profitability that incorporates noncash items including changes in inventories, economic depreciation, and gross imputed rental income—is forecast to increase $18.3 billion (21.7 percent) from 2019 to $102.7 billion in 2020. While cash receipts from farm commodities are forecast to decline $15.2 billion (4.1 percent), direct government farm payments are expected to increase $14.6 billion (64.4 percent) because of supplemental and ad hoc disaster assistance payments for COVID-19 relief in 2020. Additionally, total production expenses—that are subtracted out in the calculation of net income—are projected to fall $7.3 billion (2.1 percent) in 2020, contributing to the growth in income. If forecast changes are realized, NCFI would be 5.7 percent above its inflation-adjusted average calculated over the 2000-19 period, and NFI in 2020 would be 13.8 percent above its 2000-19 average. Find additional information and analysis on the USDA, Economic Research Service’s Farm Sector Income and Finances topic page, reflecting data released September 2, 2020.
Wednesday, August 5, 2020
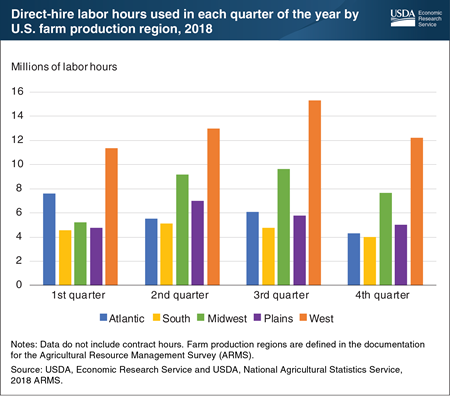
The ongoing COVID-19 pandemic has decreased labor availability in many sectors of the economy. In agriculture, labor inputs consist of unpaid farm operator labor (including spouse and family labor), direct-hire labor, and labor contracted through a third party. In 2018, 62 percent of total farm labor hours were unpaid, while the remaining 38 percent were paid. The majority (82 percent) of labor expenditures were to compensate hired employees, while 18 percent were spent on contracted labor. Paid labor hours are concentrated in certain time periods and regions, largely reflecting the importance and cyclicality of specialty crop production (which includes fruits, vegetables, and nursery crops). In the Atlantic region, paid labor hours peaked in the first quarter, whereas in the rest of the country, labor hours peaked in the second or third quarters. The Western region of the United States accounted for 35 percent of total employee labor hours, and the bulk of labor hours (37 percent) were recorded in the third quarter. If last year’s patterns hold, demand for farm-employed labor in the West could steadily increase and peak in the summer months. While the data in this chart predate the COVID-19 pandemic, agricultural workers have been deemed essential and information on the demand for these workers can provide insight into the potential impacts of the pandemic. This chart is based on data from the Economic Research Service data product, ARMS Farm Financial and Crop Production Practices, updated July 2020.
Tuesday, June 9, 2020
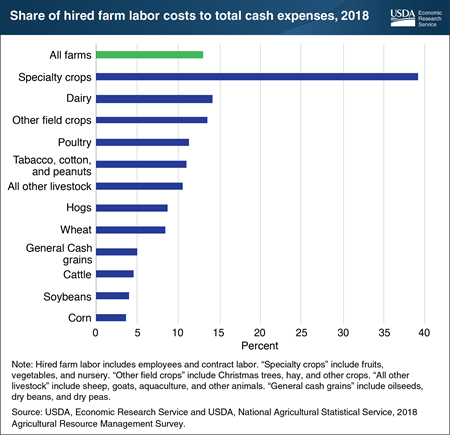
Some types of farms rely more on farm labor than others. According to data from USDA’s Agricultural Resources Management Survey, hired farm labor (including employees and contract labor) accounted for 13 percent, on average, of the total input costs used in agricultural production in 2018 (trailing only expenditures on fertilizer and chemicals). Specialty crop farms—which produce fruits, vegetables, and nursery crops—had the highest share of labor costs to total cash expenses at 39 percent. This made them the most vulnerable to labor shortages or wage shocks. The share of labor costs to total cash expenses for specialty crop farms was more than 3 times higher than the average for all farms. Dairy farms had the second highest share of labor costs at 14 percent, with large dairy farms mainly relying on hired labor. In contrast, corn and soybean farms rely mostly on unpaid operator and family labor, so paid labor accounted for less than 4 percent of total cash expenses in 2018. This chart updates data found in the Economic Research Service report, Farm Size and the Organization of U.S. Crop Farming, published in August 2013.
Monday, May 4, 2020
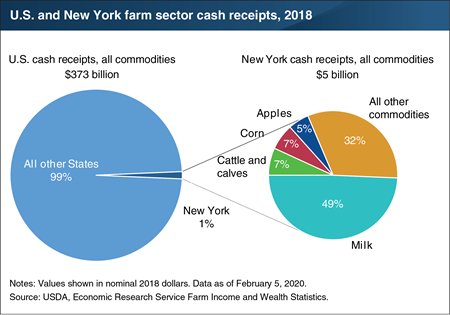
Each August, the Economic Research Service (ERS) produces and publishes estimates of the (farm sector) cash receipts—the cash income the farm sector receives from agricultural commodity sales—from the prior year. These data include State-level estimates, which can help offer background information about States subject to unexpected changes that may affect the agricultural sector, such as the current COVID-19 shelter-in-place restrictions in New York and other States. In 2018, U.S. cash receipts for all commodities totaled $373 billion. New York contributed about 1 percent ($5 billion) of that total, ranking 27th among all States. Receipts from milk accounted for the largest share of cash receipts in New York, at 49 percent ($2.5 billion). The State ranked third in milk cash receipts behind California and Wisconsin, accounting for 7 percent of milk cash receipts nationwide. New York also ranked third in apple cash receipts behind Washington and Michigan, accounting for 9 percent ($262 million) of apple cash receipts nationwide and 5 percent of New York’s total cash receipts. Receipts for corn and cattle/calves each accounted for 7 percent of the State’s total cash receipts. Although contributing a smaller amount to total cash receipts in the State, nationwide New York accounted for 18 percent ($26 million) of maple products receipts, 13 percent ($53 million) of cabbage receipts and 13 percent ($24 million) squash receipts. This chart uses State-level data from the ERS data product Farm Income and Wealth Statistics, updated February 2020.
Monday, April 27, 2020
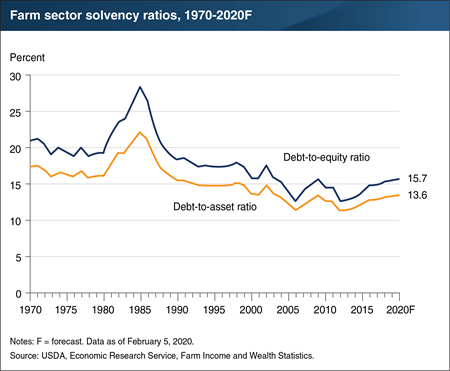
Solvency is a measure of the ability of a farm or ranch operation to satisfy its debt obligations when due. Popular measures of solvency include the debt-to-equity ratio, debt-to-asset ratio, and equity-to-asset ratio. Solvency ratios compare the amount of debt relative to equity invested in the farm sector. As a result, these ratios provide a measure of the farm sector’s ability to repay financial liabilities via the sale of assets. The ratios also measure the farm sector’s risk exposure and ability to overcome adverse financial events. The farm sector debt-to-equity and debt-to-asset ratios are expected to continue their slow increases from 2012. The Economic Research Service (ERS) forecasts a debt-to-equity ratio of 15.7 percent in 2020, and a debt-to-asset ratio of 13.6 percent. These higher ratios indicate that more of the farm sector’s assets are financed by credit or debt relative to owner capital (equity). This is the result of farm sector debt growing at a faster rate than farm sector assets. The impact of this year’s shelter-in-place restrictions due to COVID-19 are not reflected in this ERS data. This chart appears in the ERS topic page for Farm Sector Income and Finances.
Wednesday, February 5, 2020
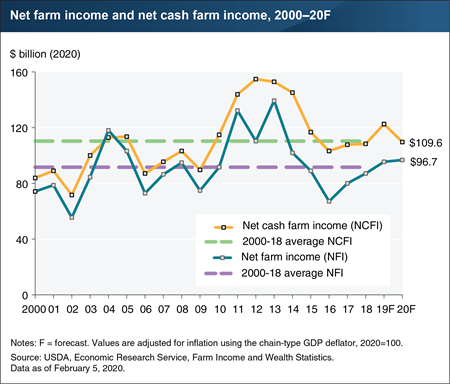
U.S. net cash farm income—gross cash income less cash expenses—when adjusted for inflation is forecast to decrease $13.1 billion (10.7 percent) to $109.6 billion in 2020. U.S. net farm income—a broader measure of farm sector profitability that incorporates noncash items including economic depreciation and gross imputed rental income—is forecast to increase $1.4 billion (1.4 percent) from 2019 to $96.7 billion in 2020. If forecast changes are realized, net cash farm income in 2020 would be 0.6 percent below its inflation-adjusted average calculated over the 2000-18 period, while net farm income would be 5.4 percent above its 2000-18 average. The trajectories of the two income measures diverge in 2020 largely because of how net sales from inventories are treated. Net cash farm income records income in the year the sale took place, while net farm income counts it in the year the production occurred. High net sales ($14.9 billion) from crop inventories forecast in 2019 are expected to boost net cash farm income significantly that year. Very low net sales from inventories ($0.5 billion) in 2020 are expected to contribute to a decrease in net cash farm income between the two years. In the net farm income series, net inventory changes are removed from cash receipts and track more closely with the value of annual agricultural production. Find additional information and analysis on the ERS Farm Sector Income and Finances topic page, reflecting data released February 5, 2020.
Thursday, December 19, 2019
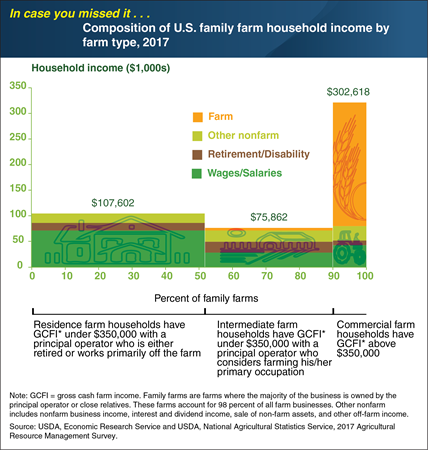
The composition of family farm household income varies by the type of farm. For example, households operating commercial family farms earned most of their income on the farm ($225,264 on average in 2017). Residence family farm households relied mostly on off-farm wages and salaries ($69,493 on average). Intermediate family farm households, meanwhile, had relatively high retirement and disability income ($19,222 on average), in part because these households had the oldest principal operators on average. Less than half of all farm households had positive incomes from their farm operations in 2017. Among commercial farm households, 86 percent had positive income from farming, compared to 51 percent of intermediate farm households and 35 percent of residence farm households. At the median, U.S. farm households earned $67,500 from non-farm sources, compared to a median loss of $800 from farming operations. This chart appears in the Amber Waves infographic “Farm Households Rely on Many Sources of Income,” published June 2019. This Chart of Note was originally published June 14, 2019.
Friday, December 13, 2019
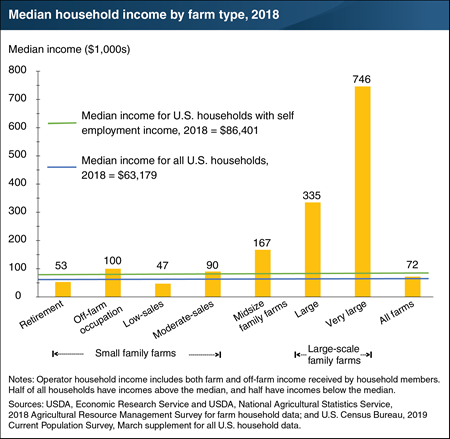
Farm households often earn higher incomes than other types of households. In 2018, 57 percent of U.S. farm households received incomes at or above the median for all U.S. households, which was $63,179 that year. ERS classifies farm households into 7 types based on their annual gross cash farm income (GCFI), and groups small farms by the primary occupation of the principal producer. Median household incomes for 5 out of 7 farm types exceeded both the median U.S. household and the median income for households with self-employment income. However, the median income for all family farm households is lower than the median among all U.S. households with self-employment income. Overall, only 3 percent of farm households had lower wealth than the median U.S. household. This chart appears in the December 2019 report, America’s Diverse Family Farms: 2019 Edition.
Wednesday, November 27, 2019
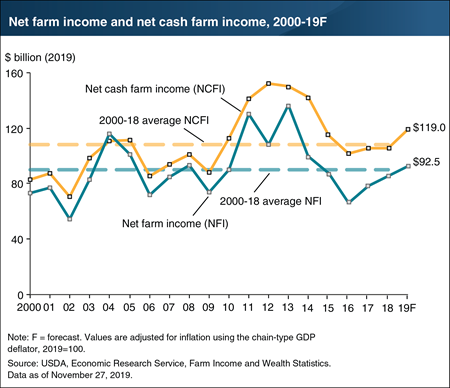
Inflation-adjusted U.S. net cash farm income (gross cash income less cash expenses) is forecast to increase $13.6 billion (12.9 percent) to $119.0 billion in 2019. U.S. net farm income (a broader measure of farm sector profitability that incorporates noncash items including changes in inventories, economic depreciation, and gross imputed rental income) is forecast to increase $7.0 billion (8.2 percent) from 2018 to $92.5 billion in 2019. The forecast increases are due to a combination of lower production expenses, which are subtracted out in the calculation of net income, as well as increases in government payments and farm-related income. These factors contributing to higher income are expected to more than offset the forecast decline in cash receipts from commodity sales. If forecast changes are realized, net farm income would stand at 2.8 percent above its inflation-adjusted average calculated over the 2000-18 period and net cash farm income would be 10.0 percent above its 2000-18 average. Find additional information and analysis on ERS’s Farm Sector Income and Finances topic page, reflecting data released November 27, 2019.
Thursday, October 31, 2019
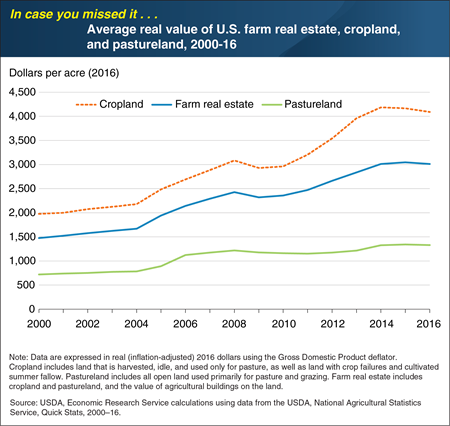
Farm real estate (including farmland and the structures on the land) accounts for over 80 percent of farm-sector assets and represents a significant investment for many farms. Beginning in the mid-2000s, higher farm incomes and lower interest rates contributed to rapid appreciation. Nationally, average per-acre farm real estate values more than doubled when adjusted for inflation, from $1,483 in 2000 to $3,010 in 2016. Two major uses of farmland are cropland and pastureland. From 2003 to 2014, U.S. cropland values doubled, appreciating faster than pastureland and reflecting a rise in grain and oilseed commodity prices. However, the value of cropland and farm real estate dipped slightly in 2008–09, reflecting the effect of the Great Recession and the downturn in the U.S. housing market. In contrast, average U.S. pastureland values remained relatively flat. This chart appears in the February 2018 ERS report, Farmland Values, Land Ownership, and Returns to Farmland, 2000–2016. This Chart of Note was originally published May 23, 2019.
Wednesday, October 23, 2019
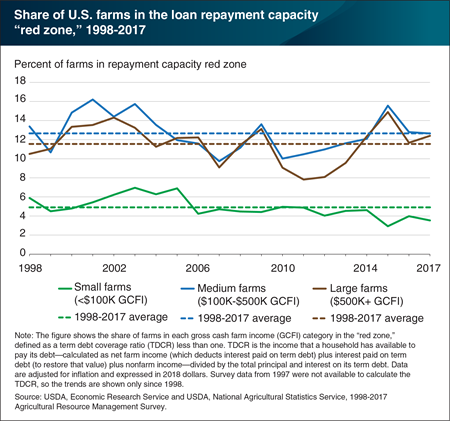
The income that a household has available to pay its debt, referred to as the term debt coverage ratio (TDCR), is often used to measure loan repayment capacity. A TDCR less than 1.0 indicates the farm household is in a repayment capacity “red zone” and does not have sufficient income to meet its loan payments. ERS researchers found that over the last 20 years, the shares of medium and large farms with a repayment capacity in the red zone have exceeded the share of small farms in that zone. On average, households that operate small farms earn most of their income off the farm and have relatively little farm debt. In the years following the 2012 peak in net cash farm income, the share of medium and large farms in the red zone increased. The increase was particularly steep for large farms—from 8.1 percent in 2012 to 12.4 percent in 2017. In contrast, small farms remained largely insulated from the downturn in the agricultural economy because they relied relatively more on off-farm income. This chart appears in the ERS report, Financial Conditions in the U.S. Agricultural Sector: Historical Comparisons, released October 2019. It also appears in the Amber Waves feature, “Larger Farms and Younger Farmers Are More Vulnerable to Financial Stress.”
Tuesday, October 8, 2019
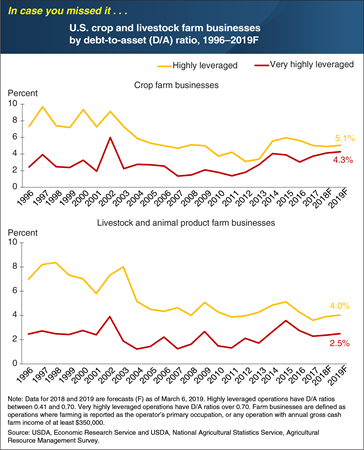
Farm businesses—operations where farming is reported as the operator’s primary occupation or that have at least $350,000 in annual sales—accounted for more than 94 percent of U.S. farm sector production in 2017. That year, farm businesses held 90 percent of all farm assets and 96 percent of farm debt. Debt-to-asset (D/A) ratios measure the amount of assets that are financed by debt, and can indicate a farm’s risk exposure and ability to overcome adverse financial events. The share of farm businesses that are highly leveraged (D/A ratio between 0.41 and 0.70) has fallen since 2015, but is forecast to increase slightly in 2018 and 2019. Farm businesses specializing in crops tend to have higher shares of both highly and very highly leveraged operations (D/A ratio over 0.70) than farm businesses specializing in livestock and animal products. In 2019, ERS forecasts 4.3 percent of crop farm businesses to be very highly leveraged, the highest share since 2002. Lending institutions consider D/A ratios (along with other measures reflecting the likelihood of default) when evaluating the credit worthiness of farms, so some of these highly and very highly leveraged farm businesses may have difficulty securing a loan. This chart updates data from the April 2014 ERS report, Debt Use by U.S. Farm Businesses, 1992–2011. This Chart of Note was originally published April 29, 2019.
Tuesday, September 17, 2019
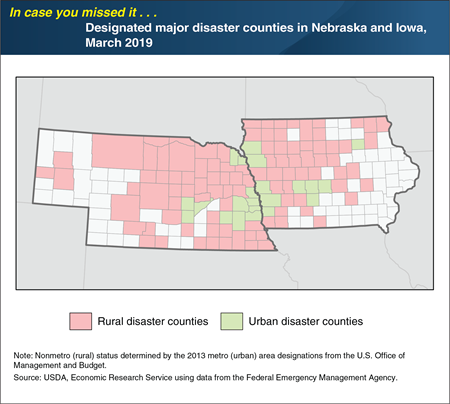
In March 2019, historic flooding led to a major disaster declaration covering 121 counties in Iowa and Nebraska. The disaster declaration covers nearly half of the population in Iowa and 93 percent of the population in Nebraska. Of the 3.3 million people living in one of the designated disaster counties in 2017, over 37 percent (1.2 million) lived in rural areas. In 2017, Iowa and Nebraska were the second- and fourth-ranked States, respectively, in agricultural cash receipts. Iowa also ranked second in total agricultural exports and was the top exporter of soybeans, pork, corn, and feed grains. Nebraska led the Nation in beef and veal exports, and ranked third among States in corn, processed grain products, and feed grain exports. Based on the 2017 Census of Agriculture, designated disaster counties produced 66 percent of the market value of agricultural products sold in Iowa and 75 percent of those sold in Nebraska. Together, the designated disaster counties accounted for 9.2 percent of the total U.S. market value of agricultural products sold in 2017. This chart uses data from the ERS State Facts Sheet data product, updated March 2019. This Chart of Note was originally published April 25, 2019.
Friday, August 30, 2019
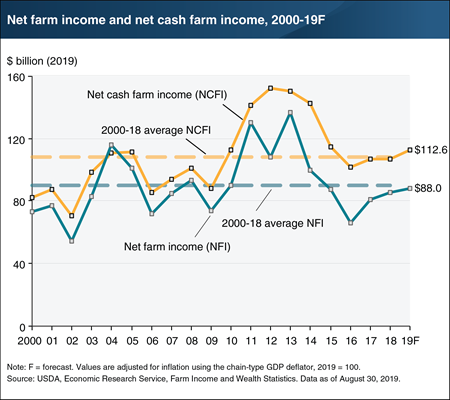
Inflation-adjusted U.S. net cash farm income is forecast to increase $5.8 billion (5.4 percent) to $112.6 billion in 2019, while U.S. net farm income (a broader measure of farm sector profitability that incorporates noncash items including changes in inventories, economic depreciation, and gross imputed rental income) is forecast to increase $2.5 billion (2.9 percent) from 2018 to $88.0 billion in 2019. The forecast increases are due to a combination of lower production expenses, which are subtracted out in the calculation of net income, as well as increases in government payments and farm-related income. These contributions are expected to more than offset the forecast decline in cash receipts. If forecast increases are realized, net farm income would be 2.3 percent below the 2000–18 average ($90.1 billion), but net cash farm income would be 4.0 percent above its 2000–18 average ($108.3 billion). Find additional information and analysis on ERS’s Farm Sector Income and Finances topic page, reflecting data released August 30, 2019.


