ERS Charts of Note
Subscribe to get highlights from our current and past research, Monday through Friday, or see our privacy policy.
Get the latest charts via email, or on our mobile app for  and
and 
Wednesday, November 26, 2014
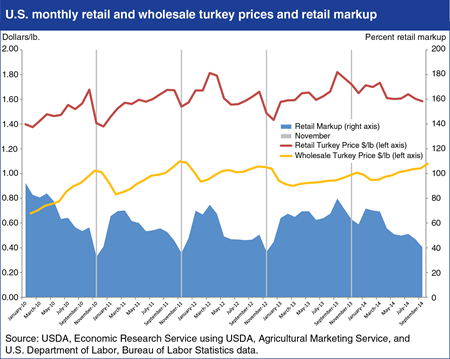
Wholesale and retail prices of whole turkeys tend to react differently to the surge in demand that occurs during the Thanksgiving season. Wholesale prices for whole turkeys typically reach their annual highs as demand increases during the Thanksgiving season, and USDA weekly price data indicate that wholesale prices are presently at a yearly high of just under $1.20/lb. Estimates for a 1.2-percent decline in 2014 turkey production and relatively low stocks of whole birds in cold storage again indicate upward pressure on wholesale prices this holiday season. However, wholesale and retail prices of turkey tend to converge during the Thanksgiving season, when retail turkey prices are commonly near annual lows. The percentage markup between wholesale and retail prices tends to shrink to an annual low point during November. The average wholesale-to-retail markup between January 2010 and September 2014 was 60 percent, while the average November markup over the same period was 42 percent. Find additional information and analysis in Livestock, Dairy, and Poultry Outlook: November 2014 and Turkey Sector: Background & Statistics.
Tuesday, September 16, 2014
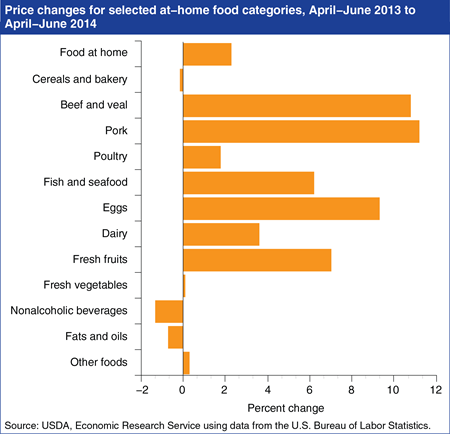
Retail food-at-home prices in the second quarter of 2014 were 2.3 percent higher than a year ago, as most at-home food categories increased in price. Retail beef and veal prices were up 10.8 percent as the supply of beef is strained by historically low herd sizes. Over the same time period, pork prices increased 11.2 percent, partially the result of the Porcine Epidemic Diarrhea virus, which has reduced litter sizes and increased piglet mortality. Egg prices are also up, in part due to increasing exports and a strong domestic demand for eggs and egg products. The increases in beef and veal, pork, and egg prices are the largest year-over-year increases since the fourth quarter of 2011. This chart appears in the Food Prices and Spending section of ERS’s Ag and Food Statistics: Charting the Essentials data product, updated September 10, 2014. More information on ERS’s food price forecasts can also be found in ERS’s Food Price Outlook data product.
Thursday, August 14, 2014
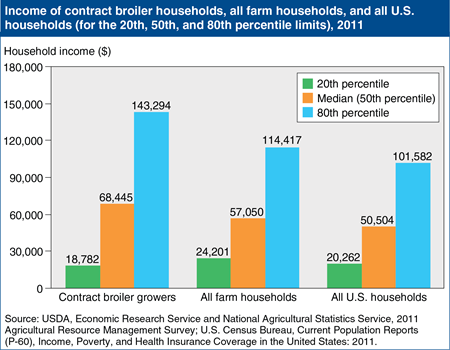
For farmers, household income combines the income that the household receives from off-farm activities with the income that the household receives from the farm business, net of expenses and payments to other stakeholders in the business. Households that raise broilers have higher median incomes than other farm households, and other U.S. households. In 2011, the median income among all U.S. households was $50,504, while the median income among farm households was $57,050. The median for contract broiler growers was higher, at $68,455. However, median income doesn’t tell the whole story; the range of household incomes earned by broiler growers is also wider than other groups, even though contract growers are a much more demographically homogeneous than both the U.S. population and the overall farm population. The wider range reflects, in part, the financial risks associated with contract broiler production. Grower costs can vary widely, and flat annual broiler production in recent years has increased the risk that growers will get fewer chicks placed, or that their contracts won’t be renewed. This chart is found in the August 2014 Amber Waves feature, “Financial Risks and Incomes in Contract Broiler Production.”
Tuesday, July 15, 2014
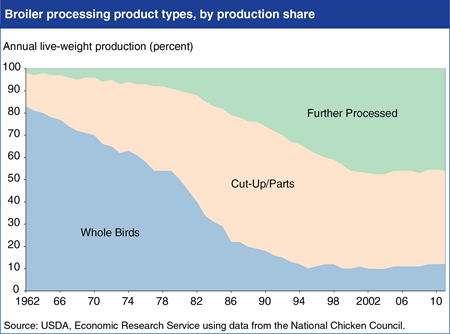
In the early 1960s, over 80 percent of broiler production was marketed as whole birds, and only 2 percent as further processed products. By 2011, only 12 percent of production was marketed as whole birds, as production shifted to cut-up parts (42 percent of production) and to further processed products such as boneless chicken, breaded nuggets and tenders, and chicken sausages (46 percent of production). The shift to cut-up and processed products spurred growth in demand for chicken, which in turn elicited production increases. Different products come from birds of different sizes, and changes in demand composition have shifted production toward larger birds for processed products. Smaller broilers are usually marketed bone-in (whole or cut into parts) to the fast-food and foodservice sectors, while intermediate sizes are normally marketed to retail groceries in tray-pack or bagged forms. The largest birds can be sold whole as roasters but are also marketed deboned and processed into parts and value-added products. Growing and processing birds of such widely varying sizes requires tight coordination between the hatchery, grow-out, slaughter, and processing stages. This chart is found in the ERS report, Technology, Organization, and Financial Performance in U.S. Broiler Production, EIB-126, June 2014.
Tuesday, July 1, 2014
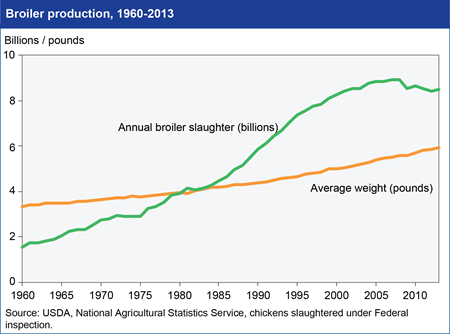
Between 1960 and 1995, annual broiler slaughter in the United States grew from 1.5 to 7.4 billion birds—4.6 percent per year, on average. With birds also getting larger—from an average of 3.35 pounds to 4.66—total live-weight production grew at an average rate of 5.6 percent per year. While average weights continued to grow steadily after 1995, growth in annual slaughter slowed sharply and then fell in 2009 and again in 2012. Total live-weight production reached 49.8 billion pounds in 2008, but did not exceed that figure until 2013. In all, live-weight production grew by just 1.3 percent per year between 2003 and 2013, one-fourth of the 1960-1995 growth rate. High production growth in earlier decades—and slowing growth later—reflected movements in demand for chicken meat. The cessation of broiler industry growth, due to slowing growth in population, per capita consumption of chicken, and exports, places new financial pressures on broiler producers and new stresses on industry organization. This chart is found in Technology, Organization, and Financial Performance in U.S. Broiler Production, EIB-126, June 2014.
Tuesday, May 27, 2014
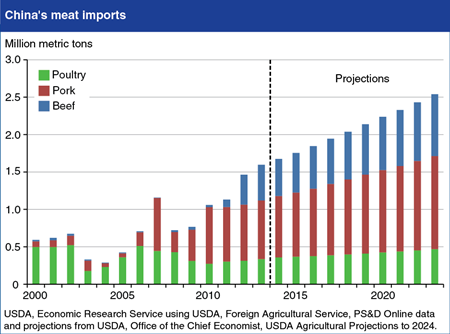
While USDA projects robust increases in China’s meat production and imports of feed grains, China’s meat imports are also projected to rise. Pork imports are projected to show the most growth, rising from about 750,000 tons in 2013 to 1.2 million tons by 2023. The United States, Canada, and European Union are the main suppliers of pork to China. China’s meat consumption is expected to expand at a pace similar to the trend of the past decade. Pork will continue to play a central role in China’s meat economy (China accounts for half of world production and consumption), however, poultry is gaining in popularity, largely because it is cheaper than pork. Restaurants, fast food chains, and cafeterias play a key role in diversifying meat consumption, since many feature specific kinds of meat or chicken. Beef and mutton are important parts of popular ethnic cuisines becoming popular among the broader population. Although China is expected to continue producing most of its own meat, China’s livestock sector is under pressure from rising costs, disease, environmental regulations, and resource constraints, which could lead to China’s meat imports rising even further if production cannot sustain its current pace of growth. Find this chart and more analysis in the April Amber Waves feature article "China in the Next Decade: Rising Meat Demand and Growing Imports of Feed."
Thursday, April 17, 2014
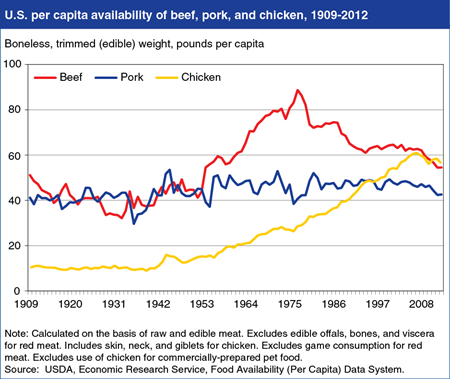
According to ERS's 2012 food availability data, the per capita supply of chicken available to eat in the United States continues to outpace that of beef. In 2012, 56.6 pounds of chicken per person on a boneless, edible basis were available for Americans to eat, compared to 54.5 pounds of beef. Although down from its peak of 60.9 pounds per person in 2006, chicken availability has been higher than that of beef for the past three years. Chicken began its upward climb in the 1940s, overtaking pork in 1996 as the second-most-consumed meat and overtaking beef for the No. 1 spot in 2010. Pork availability, which fluctuated between 49.9 and 46.6 pounds per person over the 1981 to 2009 period, dropped to 42.6 pounds per person in 2012. This chart is from the Summary Findings in ERS’s data product, the Food Availability (Per Capita) Data System.
Thursday, April 10, 2014
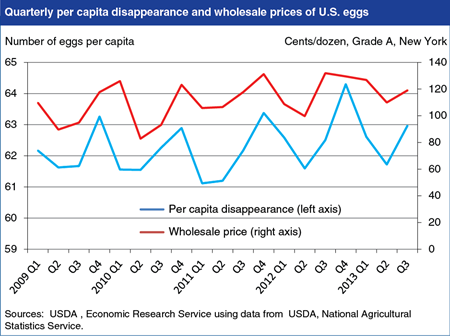
U.S. egg disappearance (production adjusted for trade and stock changes) and prices tend to be seasonally low during the first and second quarters of the calendar year, indicating minimal impacts on egg demand and prices due to the Easter holiday. Instead, egg disappearance and prices tend to be noticeably higher during the winter holiday season in the fourth quarter of the year. Household use of eggs for baking and other purposes is normally highest in the fourth quarter, while commercial use is highest in the third quarter. Roughly 31 percent of annual table egg use is termed as “broken,” meaning that they are used in commercial baking and food processing. On an annual basis, U.S. egg consumption fell in 2009 and 2010 as producers reduced output in response to the increases in grain and energy prices that occurred in 2008, but production and consumption have been on a long term upswing since 2010. As of January 2014, on a year-over-year basis, production increased in 28 of the previous 29 months. Find the data for this chart in Livestock and Meat Domestic Data, with additional analysis in Livestock, Dairy, and Poultry Outlook: March 2014.
Friday, April 4, 2014
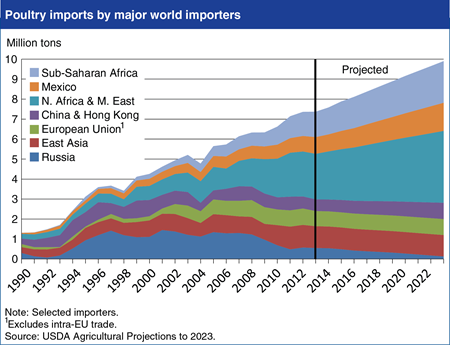
Poultry meat imports by major importers are projected to increase by 2.5 million tons (34 percent) between 2013 and 2023, led by rising import demand in North Africa and the Middle East (NAME), Mexico, and Sub-Saharan Africa (SSA). Similar factors are expected to drive import growth in each region. Rising incomes and the low cost of poultry meat relative to other meats are projected to favor growth in poultry meat consumption among the low- and middle-income consumers in each region. At the same time, limited local supplies of feed grains and feed protein in all three regions are expected to continue to limit the expansion of indigenous poultry meat production. The NAME region currently accounts for 47 percent of imports by the major poultry importers, and is projected to account for nearly 80 percent of the increase in their poultry meat imports between 2014 and 2023. In contrast, little import growth is projected for Russia, where policies continue to deter imports in favor of domestic producers, and for China, where domestic production is projected to keep pace with demand. Find this chart and additional analysis in USDA Agricultural Projections to 2023.
Thursday, December 12, 2013
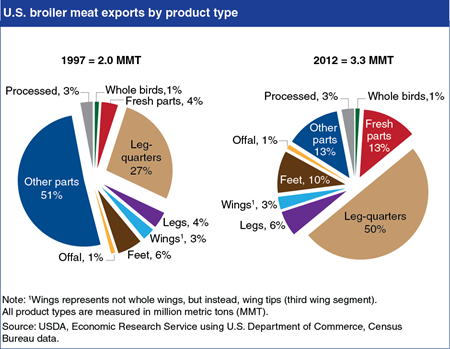
Exports of poultry meat, including broilers (young chicken), now account for about 20 percent of U.S. production. Growth in U.S. exports has been led by a combination of expanding U.S. production, complementary differences in consumer preferences for broiler products between U.S. and foreign consumers, and more open trade with Mexico and Canada. The cross-country differences in consumer preferences are reflected in the change in the composition of U.S. broiler exports between 1997 and 2012. In the United States, chicken breast meat is in high demand, while in many foreign markets other portions of the chicken, particularly leg-quarters and feet, are in relatively high demand due to reasons of taste or relatively low cost. Another growing segment of the broiler export market has been fresh parts, shipped primarily to Canada and Mexico. While most broiler exports are in frozen form, the proximity and openness of these markets has enabled trade in fresh parts. This chart can be found in Assessing the Growth of U.S. Broiler and Poultry Meat Exports.
Wednesday, November 27, 2013
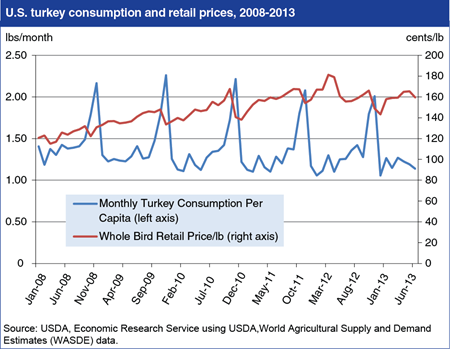
U.S. turkey consumption follows a strong seasonal pattern characterized by peaks in per capita consumption around the Thanksgiving holiday. Wholesale and retail prices tend to peak in the months preceding Thanksgiving followed by drops in price during November and December. On an annual basis U.S. per capita turkey consumption has slowly declined during the last 5 years, while domestic production has been flat. In 2013, U.S. turkey prices have been down slightly compared to recent years and lower prices are forecast into 2014 due to declining feed costs. Even with lower prices, the gradual downward trend in per capita turkey consumption is expected to continue in the near term. For more information on the U.S. turkey market, see Livestock, Dairy, and Poultry Outlook: November 2013.
Tuesday, November 19, 2013
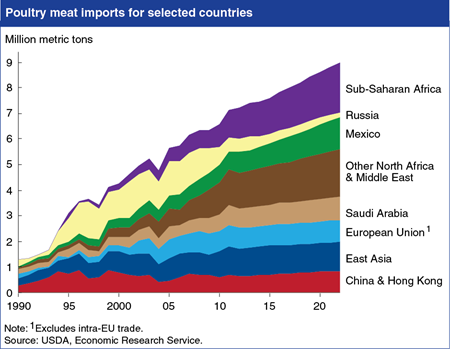
The United States is the world’s second largest poultry meat exporter behind Brazil, with U.S. exports valued at $4.2 billion and accounting for 20 percent of U.S. broiler meat production in 2012. According to USDA’s long-term projections, world import demand for poultry meat is expected to grow 1.56 million tons over the next 10 years. Brazil’s poultry exports—aided by relatively low production costs—are expected to grow 27 percent by 2022, compared with 11 percent projected growth in U.S. exports. Strong growth in poultry imports is projected for much of the world, except for Russia and the European Union. Continued growth is projected in the Africa and the Middle East region—including Sub-Saharan Africa, Saudi Arabia, and Other North Africa and Middle East—which now accounts for more than 40 percent of poultry imports by major importers. In this and other developing regions, rising consumer incomes, population growth, urbanization, and the typically low cost of poultry meat relative to other meats are key drivers of expanding poultry demand. This chart can be found in Assessing Growth in U.S. Broiler and Poultry Meat Exports, LDPM-231-01, released November 8, 2013.
Tuesday, February 19, 2013
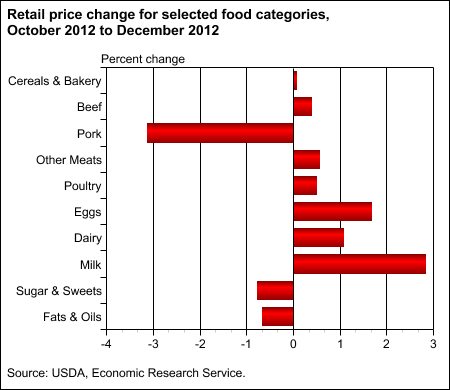
In the final three months of 2012, higher field corn prices resulting from the Midwest drought began to show up on supermarket shelves. From October to December, while the all-items CPI fell 0.8 percent and overall food-at-home prices increased only 0.2 percent, prices rose for most foods that rely heavily on corn-based animal feed—beef, pork, poultry, other meats, eggs, and dairy products. Milk prices rose nearly 3 percent while egg prices increased 1.7 percent. Prices for beef, poultry, and other meats all rose by about 0.5 percent. The only animal-based category defying this trend is pork, where rising inventories and falling exports have caused retail prices to drop from historically high levels in early 2012. ERS forecasts prices for all meat and animal-based products to increase steadily through the first half of 2013. More information on food price changes and forecasts can be found in the Food Price Outlook data product, updated January 2013.
Wednesday, January 30, 2013
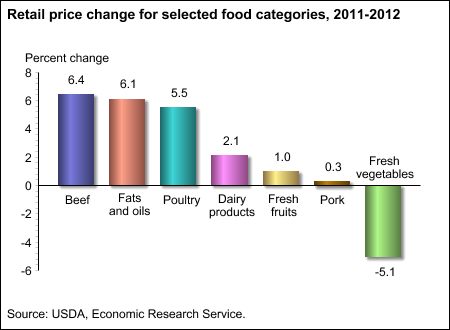
Overall food-at-home prices rose 2.6 percent in 2012, but this masked a great deal of variation across food categories. For the second consecutive year, beef and fats and oils showed the biggest percentage increases. Beef prices increased due to record low cattle inventories, while surging soybean prices pushed up prices for fats and oils. Poultry prices also increased substantially in 2012, due to a shift in demand away from high-priced beef and pork coupled with higher costs for broiler feed resulting from the Midwest drought. Pork prices, which saw major inflation in 2011, were flat in 2012 as wholesale prices fell due to rising hog inventories and falling exports. Vegetable prices fell 5.1 percent in 2012 as the unusually warm weather led to bumper crops for lettuce, tomatoes, and other vegetables, in sharp contrast to the poor harvests and high vegetable prices of 2011. More information on food price changes and forecasts can be found in the Food Price Outlook data product, updated January 24, 2013.
Wednesday, November 21, 2012
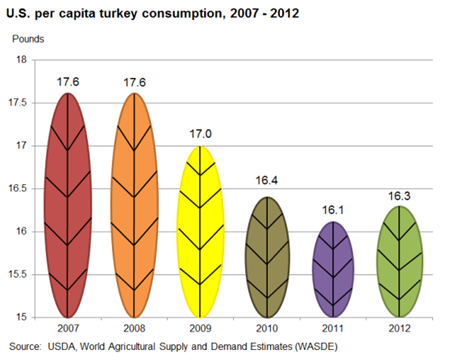
Per capita consumption of turkey in the United States has declined since 2007-2009, reflecting the impacts of the sluggish domestic economy on demand, and of higher feed and energy costs on domestic production and prices. U.S. turkey production dropped 9 percent between 2008 and 2010, but has recovered gradually during 2011 and 2012. Wholesale turkey prices rose 12.8 percent in 2011, but a more modest 3.7 percent increase is forecast for 2012. With higher production and a more moderate price increase in the forecast for 2012, per capita turkey consumption is expected to rise to 16.3 pounds, up slightly from 16.1 pounds in 2011. For more information on the U.S. turkey sector, visit the Poultry & Eggs topic page on the ERS website.
Wednesday, November 14, 2012
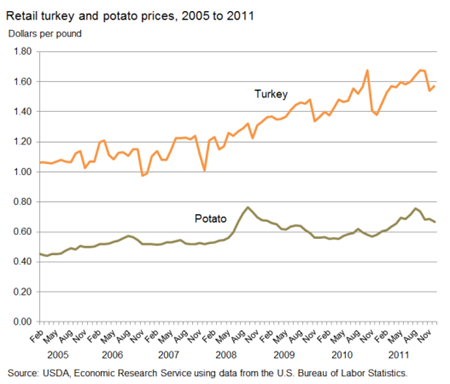
Prices for turkey, a Thanksgiving staple, have increased more than prices for most other grocery store foods in recent years. From 2005 to 2011, average retail turkey prices increased by 47 percent, while food-at-home prices rose by 13 percent. Higher feed costs and energy prices led producers to reduce turkey inventories, driving up retail turkey prices. However, average turkey prices fall every year near Thanksgiving, and most years, retail turkey prices are at annual lows in November or December. Prices of other Thanksgiving foods have not followed similar trends. Potato prices, for example, have increased more in line with food-at-home prices and do not show a strong seasonal pattern. More information on food price changes and forecasts can be found in ERS's Food Price Outlook data product, updated October 25, 2012. For more information on the U.S. turkey sector, visit the Poultry & Eggs topic page on the ERS website.
Thursday, February 2, 2012
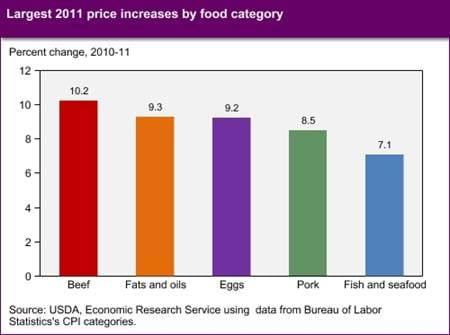
Grocery store food prices were up 4.8 percent in 2011, as food inflation picked up again for the first time since 2008. 2011's higher food-at-home price inflation reflected higher energy and commodity prices, combined with a weaker U.S. dollar that boosted international demand for U.S. foods. Specific food categories posted especially large increases: beef up 10.2 percent, fats and oils up 9.3 percent, and eggs up 9.2 percent. Beef prices were up in 2011 due to higher input costs, low inventories, and strong international demand. Drought conditions throughout the South contributed to higher 2011 egg prices, while the jump in prices for fats and oils was due in large part to surging soybean prices. More information on ERS's analysis and forecasts of food price inflation can be found in the Food Prices, Expenditures and Costs topic on the ERS website.
Wednesday, November 23, 2011
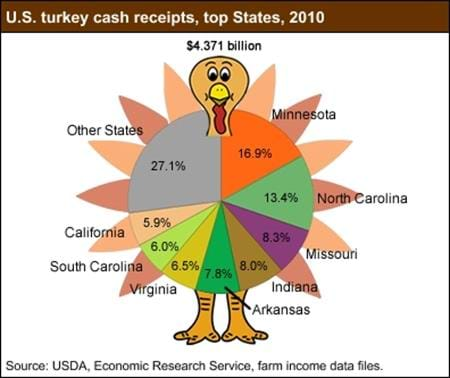
The U.S. turkey industry produces over one-quarter of a billion birds annually, with the live weight of each bird averaging over 25 pounds. Production of turkeys is somewhat more scattered geographically than broiler production. In terms of cash receipts, the top five turkey-producing States in 2010 were Minnesota, North Carolina, Missouri, Indiana, and Arkansas. The United States is by far the world's largest turkey producer, followed by the European Union. Even though exports are a major component of U.S. turkey use, the United States consumes more turkey per capita than any other country. This chart is based on ERS cash receipts data and information found in the Poultry & Eggs topic.
Thursday, June 2, 2011
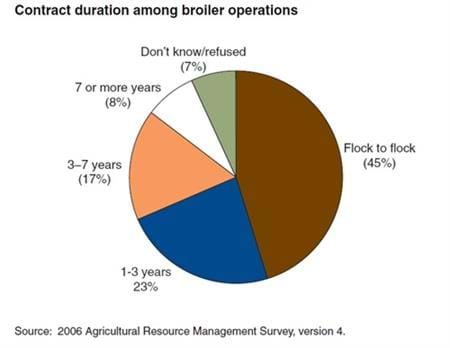
Broiler production is a long-term commitment-houses are expensive, built to last for many years, and have few alternative uses. Because of that, producers tend to have long-term relationships with those who purchase their product (referred to as 'integrators' when broilers are raised under contract). On average, producers reported holding contracts for 13 years with their current integrator in 2006. However, the actual contracts often specify very short durations. Forty-five percent of producers reported that their contracts were flock-to-flock, explicitly covering only the birds currently in their houses (5-10 weeks). Only eight percent of production contracts specified a term of at least 7 years, while the longest ran 15 years. Long durations tend to be offered to newer and larger operations. Among recent entrants, those with long-term contracts averaged half again as much production as those with shorter contracts. This chart appeared in The Economic Organization of U.S. Broiler Production, EIB-38, June 2008.


