ERS Charts of Note
Subscribe to get highlights from our current and past research, Monday through Friday, or see our privacy policy.
Get the latest charts via email, or on our mobile app for  and
and 
Wednesday, January 21, 2015
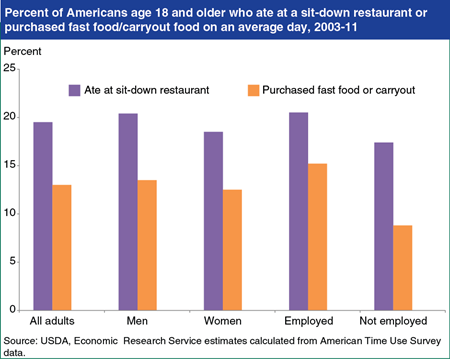
Time use diaries reveal that on an average day during 2003-11, 19.5 percent of Americans age 18 and older ate at a sit-down restaurant and 13 percent purchased fast food or carryout food. Men were more likely than women to eat at a sit-down restaurant (20.4 versus 18.5 percent) and purchase fast food (13.5 versus 12.5 percent). The largest difference in eating out patterns was between employed and not employed adults in their purchases of fast food—15.2 percent of employed adults purchased fast food versus 8.8 percent of adults that were not employed (those actively looking for work and those who are retired, in school, or not looking for work). Income plays a role, but time constraints may be more of a factor for those working. On an average day, employed persons spent less time eating and drinking beverages, sleeping, and watching television, and they spent more time traveling from place to place due to their work schedules, suggesting that they may be more time pressured than others and use fast foods as a time-saving option. This chart appears in the ERS report, The Role of Time in Fast-Food Purchasing Behavior in the United States.
Wednesday, January 14, 2015
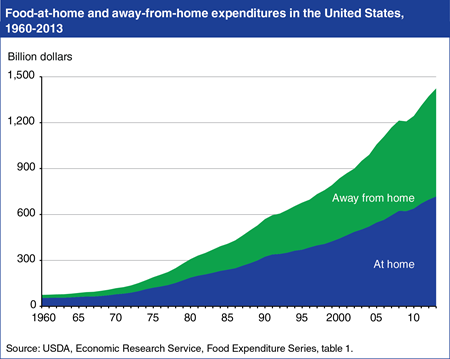
In 2013, spending at grocery stores and other retailers accounted for 50.4 percent of the $1.4 trillion spent on food and beverages by U.S. consumers, businesses, and government entities. The remaining 49.6 percent took place at restaurants, school cafeterias, food concession stands at movie theaters and ball parks, and other away-from-home eating places. In 1960, the away-from-home market had a 26.3-percent share of total food expenditures, and its share has grown through the decades except in some recession years. Most recently, food-away-from-home’s share of total food spending fell from 49.1 percent in 2007 and did not rebound to its pre-recession share until 2012. Two-earner households and busier lifestyles have led consumers to spend less time cooking and seek the convenience of food prepared away from home. This chart appears in the ERS data product, Ag and Food Statistics: Charting the Essentials. More information on U.S. food sales and expenditures can be found in ERS’s Food Expenditures data product.
Wednesday, December 31, 2014
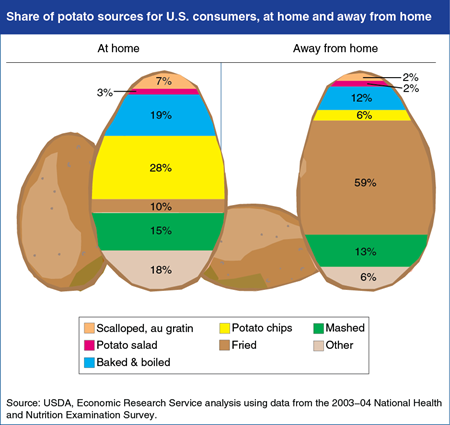
When advised to “eat your vegetables,” Americans may also need to be reminded “and watch how you prepare them.” ERS researchers recently looked at the types of vegetables and vegetable-containing foods eaten by Americans and found that instead of eating vegetables in their simple, unadorned state, Americans often eat vegetables in ways that add calories and sodium and reduce dietary fiber. For potatoes prepared at home, potato chips were the most commonly eaten form, accounting for 28 percent of potato consumption. In restaurants, fast food places, and other away from home eating places, fried potatoes accounted for 59 percent of potato consumption. Food intake surveys show other potato dishes, such as mashed and scalloped potatoes, are often prepared with added fats and sodium. Baked and boiled potatoes accounted for 19 percent of at-home potato consumption and 12 percent away from home, and the skin was usually not eaten, reducing dietary fiber content. This chart appears in “Healthy Vegetables Undermined by the Company They Keep” in the May 2014 issue of ERS’s Amber Waves magazine. Originally published Monday August 11, 2014.
_450px.png?v=2166.6)
Wednesday, December 24, 2014
During the Great Recession of 2007-09, many Americans experienced large changes in employment and income—changes that affected their food spending and intake. Using intake data from National Health and Nutrition Examination Surveys, ERS researchers found that working-age Americans cut back on the number of meals and snacks eaten away from home between 2005-06 and 2009-10. Working age adults’ total daily calories from food away from home declined as well. After accounting for age and other demographic characteristics, the number of away-from-home meals and snacks consumed by working age adults declined by about 12 percent and their away-from-home calories fell from 833 to 706 calories per day. Accounting for income did not affect the estimated declines, suggesting that the recession effect was not due to lower incomes, but instead to increased time available for shopping and preparing food at home. The statistics in this chart are from the ERS report, Changes in Eating Patterns and Diet Quality Among Working-Age Adults, 2005-2010, released January 16, 2014.
Thursday, December 11, 2014
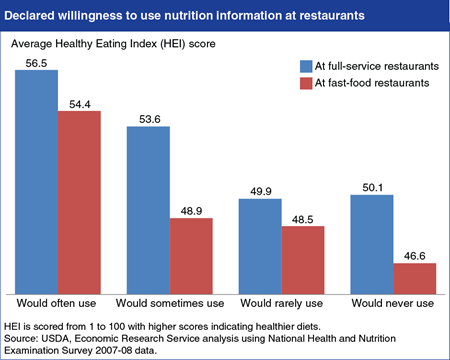
Menu-labeling regulations recently released by the U.S. Food and Drug Administration will require chain restaurants and other retail food chains that sell restaurant-type foods to post the calorie content of standard menu items. This will allow diners to make more informed decisions, if they notice and use the information. A recent ERS study, Menu Labeling Imparts New Information About the Calorie Content of Restaurant Foods, concluded that while many Americans may already be making crude choices between low- and high-calorie menu items, the new regulations will allow them to refine their choices. In another ERS study, researchers found that adults who already practice healthy dietary habits were more likely to use calorie information when eating out. Strongly correlated with a person’s declared willingness to use nutrition information was his or her Healthy Eating Index (HEI) score, which assesses an individual’s conformance to Federal dietary guidance. People who said that they would use nutrition information "often" in both fast-food and full-service settings have the highest average HEI scores, both above the national average of 53.1, followed by those who said they would use it "sometimes." The statistics in this chart are from the ERS report, Consumers’ Use of Nutrition Information When Eating Out.
Monday, December 1, 2014
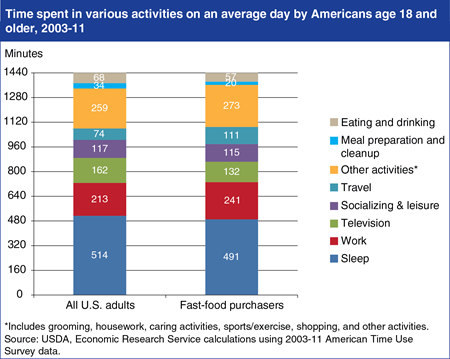
ERS analyses of data from the U.S. Bureau of Labor Statistics’ American Time Use Survey find that Americans age 18 and older who purchased fast food on a given day spent more time working and traveling and less time watching television and sleeping than the average for all adults. Over 2003-11, fast-food purchasers spent 28 more minutes per day working and 23 fewer minutes sleeping than the total adult average. Other research has found that less sleep is associated with poorer food choices. Those who purchased fast food on an average day spent 57 minutes eating and drinking compared with the 68-minute average for all consumers. Fast-food purchasers were also more likely than others to report that they spent no time eating or drinking as the primary (main) activity, as opposed to eating as a secondary activity done while doing something else. Instead, fast-food purchasers were more likely to engage in “secondary eating” while at work or while driving a vehicle. The statistics for this chart are from the ERS report, The Role of Time in Fast-Food Purchasing Behavior in the United States, released on November 20, 2014.
Tuesday, October 7, 2014
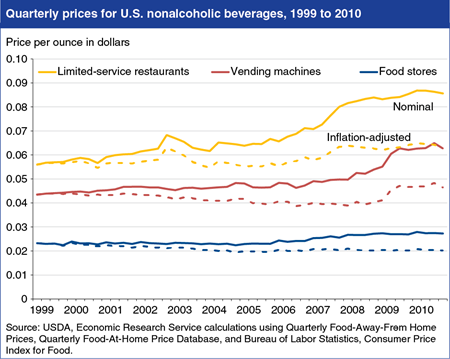
ERS’s Quarterly Food-Away-From-Home Prices (QFAFHP) data product provides quarterly average prices for products at away-from-home eating places (full- and limited-service restaurants, vending machines, and schools) across geographic areas and over time, and can be combined with the Quarterly Food-At-Home Price Database to make comparisons between at-home and away-from-home markets. Using these data, ERS researchers observed that beverages away from home are generally more expensive than at-home versions. In the last quarter of 2010, nonalcoholic beverages purchased at limited-service restaurants cost $1.37 for a 16-ounce serving, while beverages purchased at vending machines cost $1.00 for 16 ounces. Beverages purchased in food stores cost even less—$0.44 for 16 ounces. From 1999 to 2010, inflation-adjusted beverage prices at limited-service restaurants and vending machines grew only 1 percent per year on average, while they declined 1 percent at food stores. This chart appears in “New Data on U.S. Food-Away-From-Home Prices Show Geographic and Time Variation” in ERS’s September 2014 Amber Waves magazine.
Wednesday, September 24, 2014
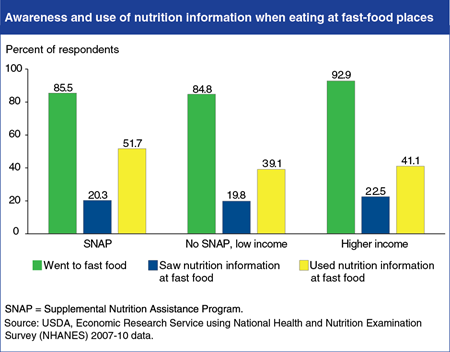
Questions in the 2007-08 and 2009-10 National Health and Nutrition Examination Survey (NHANES) allow researchers to examine demographic and health-related characteristics of consumers who use nutrition information when eating away from home. Using these data, ERS researchers found differences across population subgroups. Participants in USDA’s Supplemental Nutrition Assistance Program (SNAP) and low-income nonparticipants are less likely to go to fast-food places than are higher-income people. About 85 percent of SNAP participants and low-income nonparticipants said they ate at fast-food places during the previous 12 months, compared with 93 percent of higher-income people. All three groups are about equally likely to notice nutrition information on fast-food menus. However, upon seeing the information, SNAP participants are more likely to use it (52 percent) than low-income nonparticipants (39 percent) and higher-income people (41 percent). This chart appears in “Calorie Labeling on Restaurant Menus—Who Is Likely to Use It?” in the September 2014 issue of ERS’s Amber Waves magazine.
Thursday, August 28, 2014
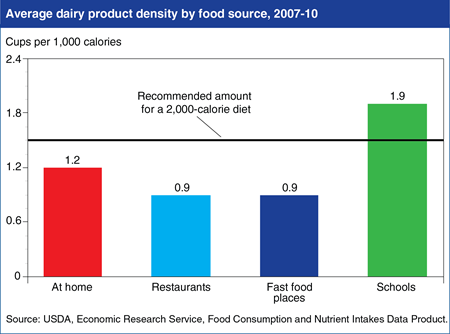
“Back to school” means back to school-provided lunches and breakfasts for many students. Intake data from the 2007-10 National Health and Nutrition Examination Survey (NHANES) reveal that school foods provide the highest dairy product density among all food sources in children’s diets. For each 1,000 calories consumed by children age 2-19, school foods offer an average of 1.9 cups of dairy products, compared to 0.9 cups for foods from restaurants and fast food places. School foods are the only food source that meets the recommended amount of dairy products. Foods consumed by children at home contain 1.2 cups of dairy products for each 1,000 calories, higher than the 0.9 cups in food consumed by adults at home. The statistics for this chart are from ERS’s Food Consumption and Nutrient Intakes data product.
_450px.png?v=2166.6)
Monday, August 11, 2014
When advised to “eat your vegetables,” Americans may also need to be reminded “and watch how you prepare them.” ERS researchers recently looked at the types of vegetables and vegetable-containing foods eaten by Americans and found that instead of eating vegetables in their simple, unadorned state, Americans often eat vegetables in ways that add calories and sodium and reduce dietary fiber. For potatoes prepared at home, potato chips were the most commonly eaten form, accounting for 28 percent of potato consumption. In restaurants, fast food places, and other away from home eating places, fried potatoes accounted for 59 percent of potato consumption. Food intake surveys show other potato dishes, such as mashed and scalloped potatoes, are often prepared with added fats and sodium. Baked and boiled potatoes accounted for 19 percent of at-home potato consumption and 12 percent away from home, and the skin was usually not eaten, reducing dietary fiber content. This chart appears in “Healthy Vegetables Undermined by the Company They Keep” in the May 2014 issue of ERS’s Amber Waves magazine.
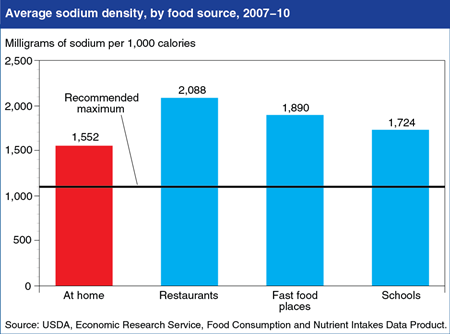
Foods prepared at home are less sodium dense than those from restaurants, but still above guidelines
Monday, July 21, 2014
Reducing sodium intake is a key recommendation in the 2010 Dietary Guidelines for Americans. Intake data from the 2007-10 National Health and Nutrition Examination Survey (NHANES) reveal that Americans age 2 and older consumed an average of 1,649 milligrams (mg) of sodium for each 1,000 calories eaten, compared to the recommended maximum of 1,100 mg per 1,000 calories. Foods prepared by restaurants, fast-food places, schools, and other away-from-home sources contain more sodium than foods prepared at home—1,879 mg per 1,000 calories versus 1,552 mg per 1,000 calories. Foods consumed at school cafeterias were found to be less sodium dense than foods eaten at restaurants and fast-food places, but higher than at-home foods. The statistics in this chart are from ERS’s Food Consumption and Nutrient Intakes data product, updated on June 27, 2014.
Wednesday, July 16, 2014
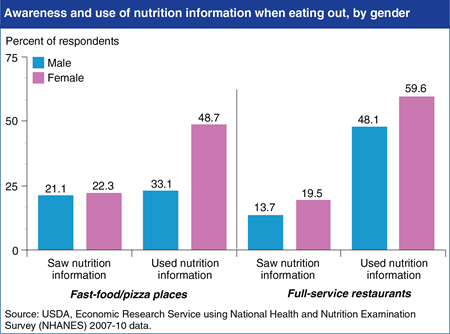
The 2010 Affordable Care Act includes a provision that will require restaurant chains with 20 or more locations to provide consumers with calorie information on menus and other nutrition information on demand. Understanding who uses current nutrition information provided voluntarily by eating places is useful for anticipating the Act’s impact. Using data from the 2007-08 and 2009-10 National Health and Nutrition Examination Survey, ERS researchers found that roughly 90 percent of respondents visited a fast-food or pizza place in the last year and about 88 percent patronized a full-service restaurant. Less than a quarter of those respondents reported seeing nutrition information. In general, women were more likely to see the nutrition information than men, and also more likely to use it in making their eating out selections. For example, in fast-food and pizza places, 48.7 percent of women who saw nutrition information used it, while only 33.1 percent of men did. In full-service restaurants, 59.6 percent of women who saw nutrition information used it, compared to 48.1 percent of men. This chart is based on statistics found in the ERS report, Consumers’ Use of Nutrition Information When Eating Out, released on June 27, 2014.
Monday, June 30, 2014
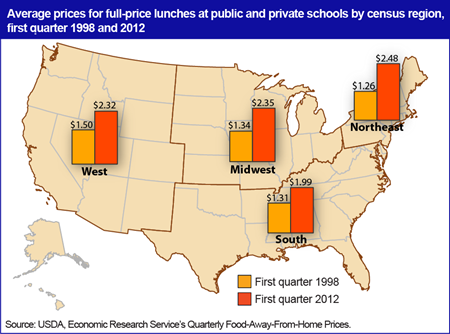
ERS’s new data product—Quarterly Food-Away-From-Home Prices (QFAFHP)—provides quarterly average prices for meals and products at four types of away-from-home eating places (full-service restaurants, limited-service restaurants, vending machines, and schools) to help support research on demand for food away from home over time and across geographic areas. School lunch prices are the prices paid by students for a full-price lunch averaged across public and private schools educating kindergarteners through 12th graders. In the first quarter of 2012, an average U.S. school lunch cost $2.19, up 60 percent from $1.37 in the first of quarter 1998, but prices and increases over time varied by region. In first quarter 1998, school lunches were most expensive in the West at $1.50 per lunch. By first quarter 2012, school lunches were most expensive in the Northeast at $2.48 per lunch. The Northeast experienced the highest growth over this period (97 percent), while the South experienced the lowest (52 percent). These increases outpaced regional inflation for overall food away from home as measured by the Consumer Price Index, which showed increases ranging from 47 to 49 percent from 1998 to 2012. More information on ERS’s QFAFHP data product can be found in Methodology for the Quarterly Food-Away-From-Home Prices Data, released on May 21, 2014.
Wednesday, June 4, 2014
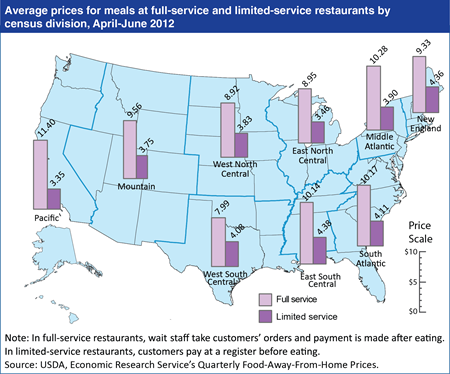
With close to one-third of Americans’ calories being eaten away from home, understanding how prices drive demand for food away from home over time and across geographic areas is a critical area of research. ERS’s new data product, Quarterly Food-Away-From-Home Prices (QFAFHP), can help support this research. The data product contains quarterly average prices for meals and products at 4 types of eating places (full-service restaurants, limited-service restaurants, vending machines, and schools) from the first quarter of 1998 to the second quarter of 2012, at the national, census region, and census division levels. In the second quarter of 2012, meals cost $9.95 on average in U.S. full-service restaurants, and $3.76 in limited-service restaurants. Full-service meals cost 43 percent more in the most expensive census division for full-service meals (Pacific) than in the least expensive division (West South Central). The Pacific had the lowest priced limited-service meals at $3.35, while the East South Central division had the highest at $4.38, a difference of 31 percent. More information on ERS’s QFAFHP data product can be found in Methodology for the Quarterly Food-Away-From-Home Prices Data, released on May 21, 2014.
Thursday, May 15, 2014
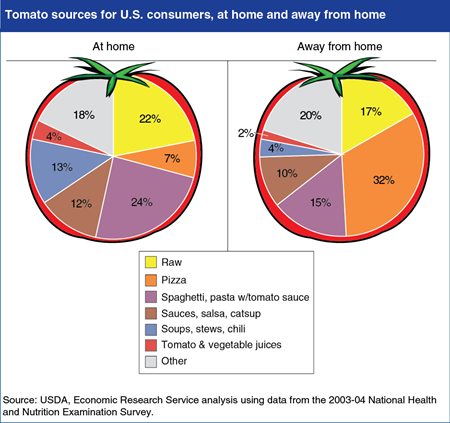
ERS researchers recently analyzed Americans’ vegetable consumption from all sources: plain raw or cooked vegetables; juices; sauces; and vegetables from mixed dishes like soups, stews, pasta dishes, and others. Tomatoes accounted for about a quarter of the average 1.5 cups of vegetables Americans ate per day. Most tomato is consumed as an ingredient in mixed foods, such as pastas and pizza. These mixed foods are much higher in sodium and calories than raw tomatoes. Researchers found that among foods prepared at home, raw tomatoes accounted for 22 percent of tomato consumption, while 24 percent came from tomato sauces for spaghetti and similar pastas. Among foods eaten away from home, pizza provided the largest share of tomato consumed (32 percent), followed by raw tomatoes (17 percent), and spaghetti and similar pastas with tomato sauce (15 percent). This chart appears in "Healthy Vegetables Undermined by the Company They Keep" in the May 2014 issue of ERS’s Amber Waves magazine.
Monday, April 14, 2014
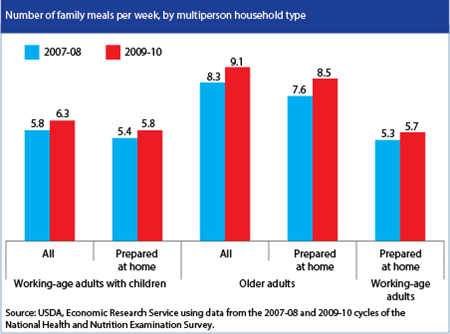
Following the 2007-09 recession, the U.S. labor force declined from 154.3 million individuals in 2008 to 153.6 million in 2011. With less time dedicated to paid work, households could opt to spend more time preparing food and eating together as a family. Previous ERS research has shown that food prepared at home tends to be of higher nutritional quality than food prepared outside the home. Using National Health and Nutrition Examination Survey data, ERS researchers found that in households of working-age adults and children younger than 17, the number of family meals (meals eaten with a majority of household members) increased from 5.8 per week in 2007-08 to 6.3 per week in 2009-10, and the number of those family meals prepared at home increased from 5.4 to 5.8 per week. Adults age 60 and older also ate more family meals and more family meals prepared at home. Among all working age adults in multiperson households (including those without children), the number of family meals prepared at home increased from 5.3 to 5.7 per week. The statistics in this chart are from “Less Eating Out, Improved Diets, and More Family Meals in the Wake of the Great Recession” in ERS’s March 2014 Amber Waves magazine.
Tuesday, February 18, 2014
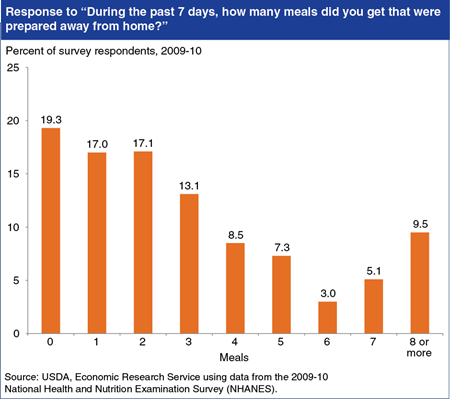
The Flexible Consumer Behavior Survey is a subset of questions in the National Health and Nutrition Examination Survey (NHANES) that collects information on the food habits, attitudes, and dietary behaviors of U.S. consumers. Some questions ask about food prepared away from home, which is of interest to nutritionists and public health professionals partly because the choices many of us make when eating out are often less healthy than our food choices at home. When asked, “During the past 7 days, how many meals did you get that were prepared away from home in places such as restaurants, fast food places, food stands, grocery stores, or from vending machines?” 9.5 percent of respondents reported 8 or more meals, down from 12.5 percent of respondents in 2007-08. The most common response was 0 meals away from home (19.3 percent of respondents). This chart appears on ERS’s recently updated webpage about the Flexible Consumer Behavior Survey.
Thursday, January 23, 2014
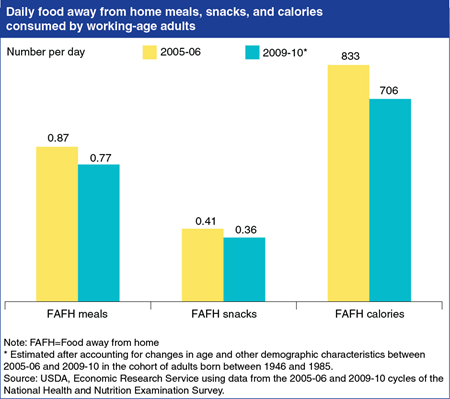
During the Great Recession of 2007-09, many Americans experienced large changes in employment and income—changes that affected their food spending and intake. Using intake data from National Health and Nutrition Examination Surveys, ERS researchers found that working-age Americans cut back on the number of meals and snacks eaten away from home between 2005-06 and 2009-10. Working age adults’ total daily calories from food away from home declined as well. After accounting for age and other demographic characteristics, the number of away-from-home meals and snacks consumed by working age adults declined by about 12 percent and their away-from-home calories fell from 833 to 706 calories per day. Accounting for income did not affect the estimated declines, suggesting that the recession effect was not due to lower incomes, but instead to increased time available for shopping and preparing food at home. The statistics in this chart are from the ERS report, Changes in Eating Patterns and Diet Quality Among Working-Age Adults, 2005-2010, released January 16, 2014.
Friday, March 22, 2013
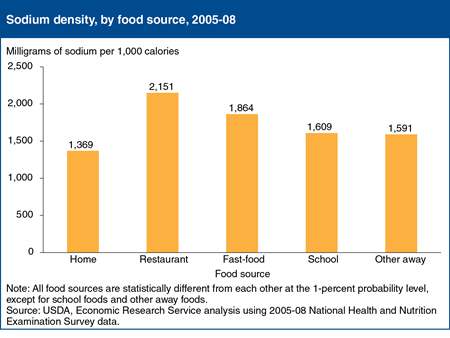
Intake data from the 2005-08 National Health and Nutrition Examination Survey (NHANES) reveal that Americans age 2 and older consumed an average of 3,085 milligrams (mg) of sodium per day, higher than the current Federal recommendation of less than 2,300 mg per day. Home foods—those obtained at supermarkets, convenience stores, and other retail outlets—provided 68 percent of Americans’ daily calories and 64 percent of sodium intake. Foods purchased from restaurants with wait staff were the most sodium dense at 2,151 mg of sodium per 1,000 calories, followed by fast-food fare at 1,864 mg per 1,000 calories. Home foods had a lower sodium density than away from home foods. The data for this chart came from “Americans’ Food Choices at Home and Away: How Do They Compare With Recommendations?” in the February 2013 issue of ERS’s Amber Waves magazine.
Friday, February 1, 2013
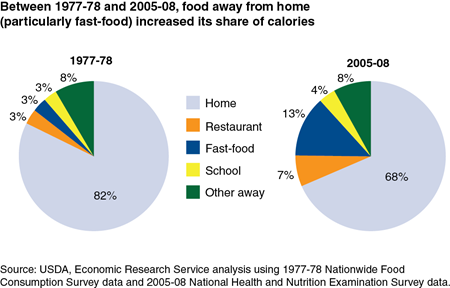
Intake data from the 2005-08 National Health and Nutrition Examination Survey (NHANES) reveal that Americans age 2 and older consumed an average of 2,002 calories per day, with 68 percent of those calories coming from at-home foods obtained at supermarkets, convenience stores, and other retail outlets. Thirty years ago, at-home foods accounted for 82 percent of U.S. caloric intake. Between 1977 and 2008, the share of calories from foods purchased at restaurants with wait staff doubled from 3.3 to 6.7 percent and fast-food places’ share grew from 3.1 to 13.2 percent. School’s share of total caloric intake rose from 3.0 to 3.7 percent. This chart appears in the ERS report, Nutritional Quality of Food Prepared at Home and Away From Home, 1977-2008, EIB-105, December 2012. See also the blog post in USDA’s Science Tuesday series.


