ERS Charts of Note
Subscribe to get highlights from our current and past research, Monday through Friday, or see our privacy policy.
Get the latest charts via email, or on our mobile app for  and
and 
Friday, February 26, 2016
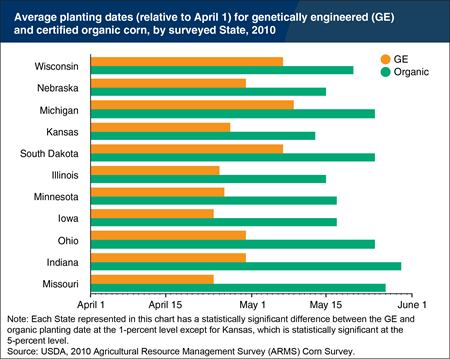
U.S. farmers used genetically engineered (GE) seed varieties that contain traits to tolerate herbicides used for weed control and/or to resist other pests on over 90 percent of corn acreage in 2015. To receive the price premiums associated with organic and other non-GE crops, these producers must minimize the unintended presence of GE materials in their crops. Organic and other non-GE farmers use various practices—including the use of buffer strips to minimize pesticide/pollen drift and/or delaying crop planting until after any nearby GE crops are planted—to prevent their crops from commingling with GE crops. While some field crops are mostly self-pollinating, most corn pollination results from pollen dispersal by wind and gravity. In USDA’s most recent (2010) corn survey of conventional and organic producers in top corn producing States, delayed planting was reported on two-thirds of planted organic corn acreage. While this strategy helps protect against commingling of GE and non-GE crop pollen, growers may realize lower yields from planting at a suboptimal time. This chart is found in the ERS report, Economic Issues in the Coexistence of Organic, Genetically Engineered (GE), and Non-GE Crops, February 2016.
Thursday, January 21, 2016
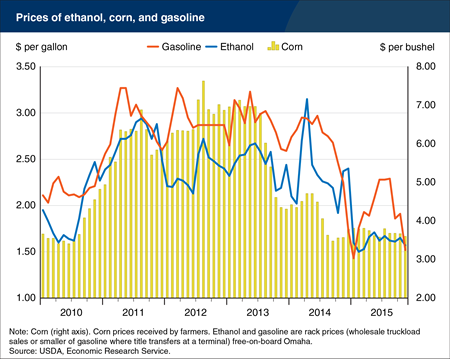
Errata: On January 26, 2016, this chart was reposted to correct the data labels for ethanol and gasoline, which were switched in the original chart.Each gallon of automobile gasoline typically contains about 10-percent ethanol, reflecting a mandate under the Renewable Fuels Standard that specifies the volume of ethanol that must be blended into the Nation’s gasoline supply. The steep decline in crude oil prices over the past 18 months has pushed the price of many conventional fuels down by more than 50 percent, including gasoline, which has fallen to price levels not seen since 2007. The price of ethanol has also fallen, driven primarily by the more than 50-percent decline in the price of corn—the primary ethanol feedstock—since summer 2013. Although ethanol is not derived from crude oil, its price is still influenced by the price of gasoline (as well as the price of corn) since ethanol and gasoline can substitute as an energy source, and as an oxygenate or octane booster, ethanol competes against petroleum-based alternatives. The price of ethanol is usually below the price of gasoline because of ethanol’s lower energy content, but the most recent data show wholesale gasoline prices falling slightly below the price of ethanol. This pattern, if it continues, suggests further downward pressure on ethanol prices. This chart is from the USDA/ERS U.S. Bioenergy Statistics data set.
Friday, December 18, 2015
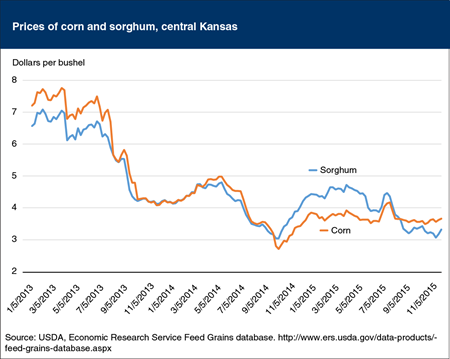
Sorghum is a common feed grain that can substitute for corn in livestock feed rations and in the production of ethanol. Corn tends to be preferred over sorghum as a feed ingredient, so sorghum typically sells at a discount compared to corn in global markets. Throughout much of the 2014 marketing year (September-August) this situation reversed, and due in large part to strong demand from China, sorghum began selling at a premium over corn, at times exceeding 20 percent. As a result, sorghum use for ethanol production declined while acreage for the 2015 harvest increased to result in a record-large U.S. crop. This, combined with recent changes in China’s import policy that could reduce U.S. sorghum’s export prospects for the 2015 crop, has greatly increased the availability of sorghum in domestic markets for feeding and ethanol production. Because of the greater availability of sorghum, the price fell back below the price of corn and is now more in line with historic relationships. Given these lower prices, sorghum use for ethanol production is expected to expand more than fivefold this year, and U.S. shipments to Mexico, which were hampered by the high prices for the 2014 crop, are expected to at least partially resume during the current marketing year, which began in September 2015. This chart is based on the October 2015 Feed Outlook and the ERS Feed Grains database.
Thursday, November 5, 2015
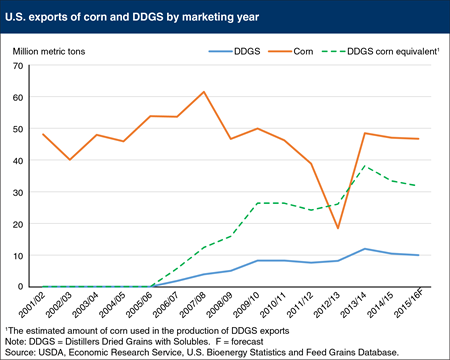
U.S. exports of distillers dried grains with solubles (DDGS)—a common byproduct of corn ethanol production—have grown from nearly zero in 2005 to as high as 12 million metric tons in the 2013/14 marketing year (September/August), with 10 million metric tons forecast for export in the 2015 marketing year. This increase in exports reflects the expansion in ethanol production that occurred over this same period, rising from just under 4 billion gallons in 2005 to more than 14 billion gallons in 2014. While U.S. corn exports still exceed the volume of DDGS exported, these markets are linked because each ton of corn processed into ethanol produces just under a third of a ton of DDGS. Ethanol production accounted for 38 percent of U.S. corn use in 2014/15, while exports were less than 14 percent, but DDGS exports represent another way that U.S. corn production enters global markets. This chart is from the ERS data products, U.S. Bioenergy Statistics and the Feed Grains Database.
Thursday, October 22, 2015
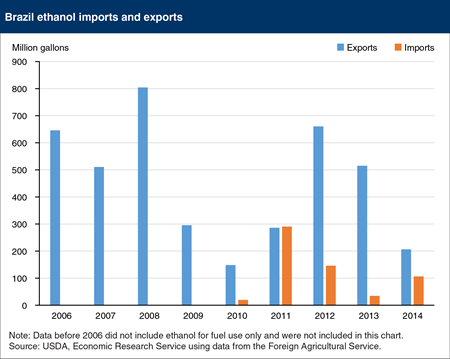
Brazil had historically been the world’s largest net exporter of ethanol, but rising sugar prices (sugar is Brazil’s primary ethanol feedstock) and growing demand for domestic ethanol consumption led to lower ethanol exports, particularly in 2009 and 2010. In 2010 the Brazilian Government lifted a tariff on ethanol imports through the end of 2015, leading to the country’s first imports of ethanol. Imports grew rapidly in 2011 and resulted in Brazil being a net ethanol importer—by a small margin—for the only time in its history. Ethanol exports recovered in 2012 but have declined each year since, while imports remain an important source of supply. Since 2010, the United States—now the world’s largest ethanol exporter—has been the largest supplier of ethanol to Brazil, followed distantly by the EU. This chart is based on the ERS report, Biofuel Use in International Markets: the Importance of Trade.
Friday, September 25, 2015
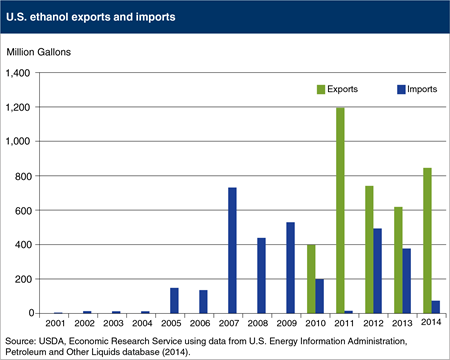
Between 2001 and 2014, global biofuel production and use grew rapidly, driven by a combination of rising gasoline prices, falling prices of biofuel inputs, and policies mandating use of renewable fuels. These same factors also led to an expansion of global trade in biofuels. The United States is the world’s largest producer and consumer of ethanol, and prior to 2010 relied partly on imports to meet domestic demand. But beginning in 2010, the United States emerged as a net exporter of ethanol, reflecting the “blend wall” that limits the ethanol content of gasoline used in most conventional vehicles to 10-percent ethanol, while demand for biofuels from other countries, particularly the EU and Brazil, continued to grow. The United States has remained a net exporter of ethanol each year since 2010, and since 2011 has been the world’s largest exporter of ethanol. In 2014, oil prices declined by more than half, pressuring U.S. ethanol consumption; however, the market remained strong due to U.S. government policies mandating ethanol use, the use of ethanol as an octane enhancer, and a large export market. This chart is from Biofuel Use in International Markets: The Importance of Trade, EIB-144, September 2015.
Thursday, July 30, 2015
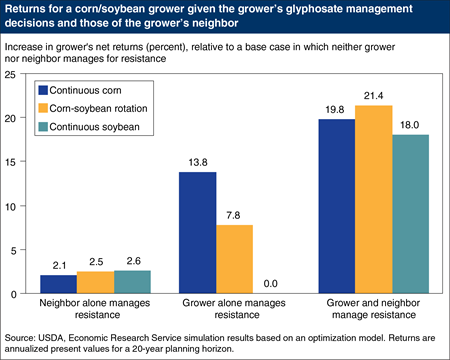
Glyphosate, also known by the trade name Roundup, is the most widely used herbicide in the United States. Widespread and exclusive use of glyphosate, without other weed control strategies, can induce resistance to the herbicide by controlling susceptible weeds while allowing more resistant weeds to survive, propagate, and spread. Resistant weed seeds can disperse across fields—carried by animals, equipment, people, wind, and water. Consequently, controlling weed resistance depends on the joint actions of farmers and their neighbors. ERS analyses evaluated the long-term financial returns to growers who adopt weed control practices that aim to slow resistance to glyphosate, and compared those returns when neighboring farmers also manage to slow resistance. Projected net returns (annualized over 20 years) for growers who manage resistance generally exceed returns for growers who ignore resistance; they are even higher when neighbors also manage resistance. Projected net returns for growers with neighbors who also manage resistance range 18-20 percent higher than those of growers/neighbors who ignore resistance. This chart visualizes data found in the Amber Waves feature, “Managing Glyphosate Resistance May Sustain Its Efficacy and Increase Long-Term Returns to Corn and Soybean Production,” May 2015.
Wednesday, July 1, 2015
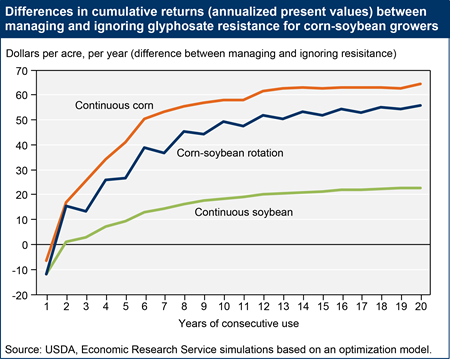
Glyphosate—known by many trade names, including Roundup—has been the most widely used herbicide in the United States since 2001. Crop producers can spray entire fields planted with genetically engineered, glyphosate-tolerant (GT) seed varieties, killing the weeds but not the crops. However, widespread use of glyphosate in isolation can select for glyphosate resistance by controlling susceptible weeds while allowing more resistant weeds to survive, which can then propagate and spread. ERS analyses show that weed control strategies (over 20 years) that manage glyphosate resistance differ from those that ignore glyphosate resistance by using glyphosate during fewer years, by often combining glyphosate with one or more alternative herbicides, and by not applying glyphosate during consecutive growing seasons. Initiating resistance management reduces returns compared to ignoring resistance in the first year, but increases them in subsequent years, as the value of crop yield gains outweighs increases in weed management cost. After two consecutive years of resistance management, the cumulative impact of growers’ returns from continuous corn cultivation, corn-soybean rotation, or continuous soybean cultivation exceeds that received when resistance is ignored. This chart is found in the Amber Waves feature, “Managing Glyphosate Resistance May Sustain Its Efficacy and Increase Long-Term Returns to Corn and Soybean Production,” May 2015.
Monday, May 11, 2015
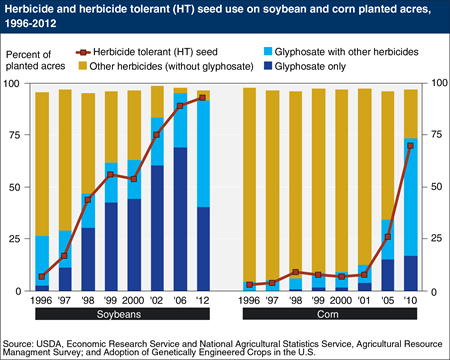
Recent data from the Agricultural Resource Management Survey (ARMS) suggest that glyphosate resistant weeds are more prevalent in soybean than in corn production. Glyphosate, known by many trade names (including Roundup), has been the most widely used pesticide in the United States since 2001. It effectively controls many weed species and generally costs less than the herbicides it replaced. Overall, glyphosate was used on a higher proportion of soybean than corn acres, and it was used alone (not in combination with other herbicides) on a substantially higher proportion of soybean acres. Using glyphosate alone contributes to resistance. Many soybean fields are managed with glyphosate alone, because the next best alternative herbicides are more expensive, less effective, and/or can cause significant injury to soybean plants. This chart is found in the Amber Waves feature, “Managing Glyphosate Resistance May Sustain Its Efficacy and Increase Long-Term Returns to Corn and Soybean Production,” May 2015.
Friday, February 13, 2015
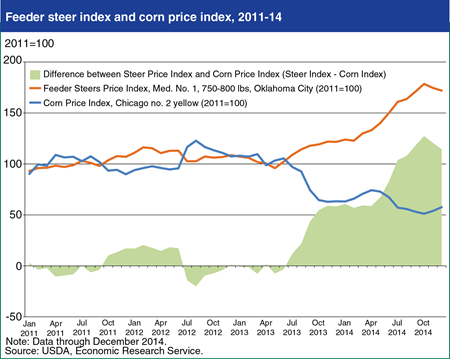
Strong feeder cattle prices and declining feed costs are supporting high returns for cow-calf producers. The price of 750-800 lb. feeder steers at the Oklahoma National Stockyards exceeded $220 per hundredweight at the end of 2014, up $65 since January and over $100 since May 2013. At the same time, the price of corn (a major component of cattle feed) fell from above $7.00 per bushel in mid-2013 to under $4.00 per bushel by December 2014, reflecting a record 2014 crop projected at 14.4 billion bushels. Despite weaker demand, beef prices are at record high levels due to tight supplies and historically low cattle inventories. Expanding the cattle herd is a long-term process due to the time it takes cattle to mature, and requires holding some heifers off market for breeding purposes. Recently released data from USDA’s Cattle report suggests that inventories are beginning to grow, and cattle prices have begun to retreat. With corn prices forecast by USDA to average around $3.50 per bushel for the 2014/15 marketing year, returns to cow-calf operators should remain favorable into 2015. This chart is based on data from ERS’s Livestock & Meat Domestic Data and Feed Grains Database.
Monday, February 9, 2015
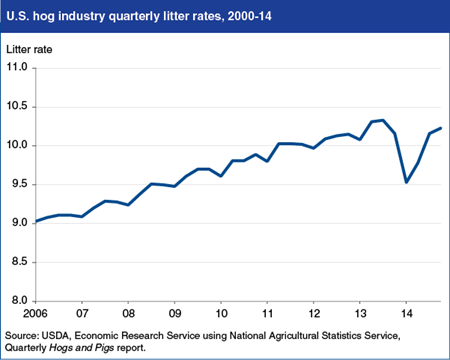
The litter rate (pigs per litter) is an efficiency indicator of the U.S. hog industry. Litter rates have been steadily increasing over time due to improvements in genetics, diet, and animal care and management. The emergence of Porcine Epidemic Diarrhea virus (PEDv) in the U.S. swine herd in the spring of 2013 caused a sharp—but temporary—drop in litter rates. PEDv afflicts young piglets in particular, and caused millions of newborn pigs to die as the disease spread to herds in 33 States. The virus flourishes in cold, damp climates, so its effect on litter rates was strong in the fall and winter months of late 2013 and early 2014. The pigs-per-litter rate began to decline in the fourth quarter of 2013, and then dropped sharply in the first quarter of 2014. Litter rates rebounded in the spring of 2014, responding to the warmer, dryer climates and to aggressive actions by producers, including increased biosecurity measures and vaccination. These measures contributed to lower disease incidence and limited losses of newborn pigs from PEDv; they are also expected to limit the incidence of the disease this winter and will help to minimize the impact of future outbreaks. This chart is based on information in the January 2015 Livestock, Dairy and Poultry Outlook.
Friday, January 9, 2015
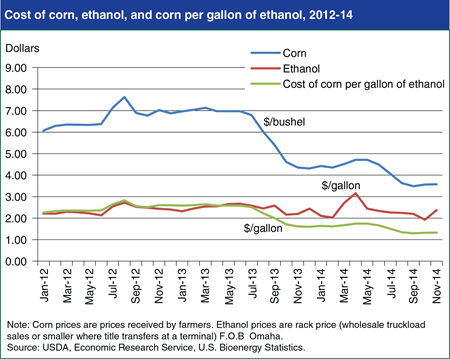
Reflecting growing supplies, corn prices have been trending lower since reaching a record high season average farm price of $6.89 per bushel for the 2012/13 marketing year (September/August). Monthly average corn prices fell sharply between July 2013 and January 2014, and then declined further through 2014, reflecting a record 2014 corn crop, projected at 14.4 billion bushels. Corn prices in 2014/15 are projected at $3.50 per bushel, down 50 percent since the summer of 2013. However, throughout this period ethanol prices have remained relatively steady, averaging $2.41 per gallon. Corn is the leading feedstock for ethanol production in the United States, and ethanol represents about 40 percent of total corn use. With the price of corn declining and ethanol prices steady, ethanol producer margins have strengthened over the past 18 months. Higher margins would typically encourage greater production, but with domestic use limited to the 10 percent ethanol blend already used in most gasoline, the market can only expand through increased gasoline use or higher exports. This chart is based on data found in the U.S. Bioenergy Statistics database.
_450px.png?v=4142.7)
Friday, January 2, 2015
China’s demand for imported grains, much of it from the United States, has surged recently, with imports of cereal grains rising to 16 million tons in 2012 and 18 million in 2013. Imports in 2013 included 3 million tons of corn and 4 million tons of DDGS (distillers dried grains with solubles; a co-product of U.S. corn ethanol production used for feed) from the United States. In 2013, the United States supplied 70 percent of China’s wheat imports and, for the first time, China became a major market for U.S. sorghum. China’s demand for feed grains appears to have reached a turning point, as a tightening labor supply and rising feed costs force structural change in China’s livestock sector. Labor scarcity, animal disease pressures, and rising living standards are prompting rural households to abandon “backyard” livestock production and shift more production to specialized farm enterprises that rely more heavily on commercial feed. Because of this, China has switched from being a corn exporter to importing 3-5 million tons annually since 2009. Rising feed demand has also pushed up costs and motivated feed mills and livestock producers to explore new feed ingredients like DDGS and sorghum. Find this chart and additional analysis in "China in the Next Decade: Rising Meat Demand and Growing Imports of Feed" in the April Amber Waves. Originally published Thursday May 22, 2014.
_450px.png?v=4142.7)
Tuesday, December 23, 2014
China’s demand for imported grains, much of it from the United States, has surged recently, with imports of cereal grains rising to 16 million tons in 2012 and 18 million in 2013. Imports in 2013 included 3 million tons of corn and 4 million tons of DDGS (distillers dried grains with solubles; a co-product of U.S. corn ethanol production used for feed) from the United States. In 2013, the United States supplied 70 percent of China’s wheat imports and, for the first time, China became a major market for U.S. sorghum. China’s demand for feed grains appears to have reached a turning point, as a tightening labor supply and rising feed costs force structural change in China’s livestock sector. Labor scarcity, animal disease pressures, and rising living standards are prompting rural households to abandon “backyard” livestock production and shift more production to specialized farm enterprises that rely more heavily on commercial feed. Because of this, China has switched from being a corn exporter to importing 3-5 million tons annually since 2009. Rising feed demand has also pushed up costs and motivated feed mills and livestock producers to explore new feed ingredients like DDGS and sorghum. Find this chart and additional analysis in "China in the Next Decade: Rising Meat Demand and Growing Imports of Feed" in the April Amber Waves.
Tuesday, October 21, 2014
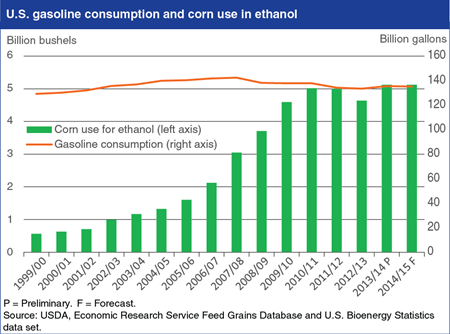
The rapid growth in use of U.S. corn to produce ethanol that occurred during the 2000s has slowed sharply since 2010, and now tracks with U.S. gasoline consumption. Lower U.S. gasoline use since 2007, combined with market constraints to increased blending of biofuel, now limits the demand for corn-based ethanol. Nearly all retail gasoline sold in the United States is a 10-percent ethanol blend (E10). Although ethanol demand now plays a more limited role in driving growth in U.S. corn demand, it continues to account for a large share of total U.S. corn use, averaging 39 percent since 2010. This chart is based on data found in ERS's Feed Grains Database and U.S. Bioenergy Statistics. For more analysis, see Feed Outlook: October 2014.
Friday, October 17, 2014
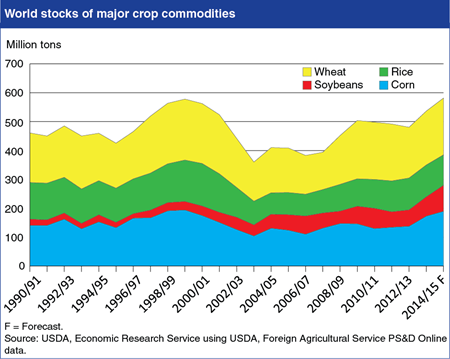
Global stocks of major crop commodities are forecast to expand in the 2014/15 marketing year, with total stocks of wheat, rice, corn, and soybeans completing recovery from the relatively low levels that preceded the 2008 spike in world crop prices. Record U.S. crops of corn and soybeans, along with good harvest by some other major producing countries, are forecast to push both U.S. and global stocks of these commodities to record levels. World wheat stocks are forecast to rise based on the outlook for record or near-record harvests by major foreign producers, including China, the EU, India, and the Former Soviet Union. While world rice stocks are forecast below peak levels of the early 2000s, good harvests and ample stocks are expected across the major producing regions in Asia. The supply outlook is expected to lead to lower commodity prices, with the average U.S. farm prices of corn (-24 percent), soybeans (-23 percent), wheat (-14 percent), and rice (-10 percent) all forecast down in their respective 2014/15 marketing years compared with 2013/14. Find additional analysis in the current editions of Feed Grain Outlook, Oil Crops Outlook, Wheat Outlook, and Rice Outlook.
Thursday, September 18, 2014
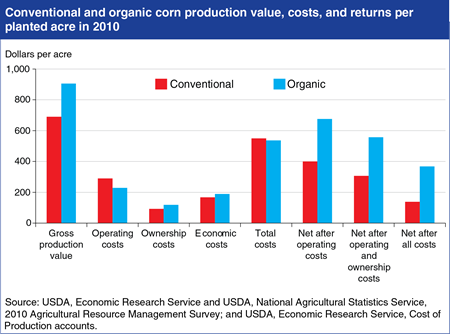
In 2010, U.S. producers saw average returns of $307 per acre for conventional corn, compared with $557 per acre for organic corn, primarily because higher organic corn prices more than offset lower organic corn yields. Total operating and ownership costs per acre (seed, fertilizer, chemicals, custom operations, fuel, repairs, interest, hired labor, capital recovery of machinery and equipment, taxes, and insurance) were not significantly different between organic and conventional corn, although many of the individual cost components differed. Three major components of operating costs—seed, fertilizer, and chemicals—are lower for organic corn than for conventional corn, while some components of ownership costs—the capital recovery of machinery and equipment, and taxes and insurance—are higher for organic corn. Although the acres planted to organic corn nearly tripled between 2001 and 2010, organic corn accounted for less than 1 percent of total 2010 corn acres. Find this chart and additional analysis in Characteristics and Production Costs of U.S. Corn Farms, Including Organic, 2010.
Tuesday, August 12, 2014
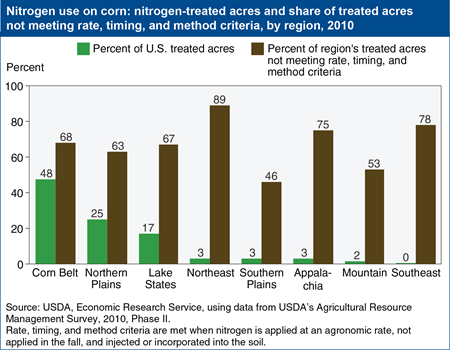
Corn is the most widely planted crop in the U.S. and the largest user of nitrogen fertilizer. By using this fertilizer, farmers can produce high crop yields profitably; however nitrogen is also a source of environmental degradation when it leaves the field through runoff or leaching or as a gas. When the best nitrogen management practices aren’t applied, the risk that excess nitrogen can move from cornfields to water resources or the atmosphere is increased. Nitrogen management practices that minimize environmental losses of nitrogen include applying only the amount of nitrogen needed for crop growth (agronomic rate), not applying nitrogen in the fall for a crop planted in the spring, and injecting or incorporating fertilizer into the soil rather than leaving it on top of the soil. In 2010, about 66 percent of all U.S. corn acres did not meet all three criteria. Nitrogen from the Corn Belt, Northern Plains, and Lake States (regions that together account for nearly 90 percent of U.S. corn acres) contribute to both the hypoxic (low oxygen) zone in the Gulf of Mexico and to algae blooms in the Great Lakes. This chart is based on data found in the ERS report, Nitrogen Management on U.S. Corn Acres, 2001-10, EB-20, November 2012.
Friday, August 1, 2014
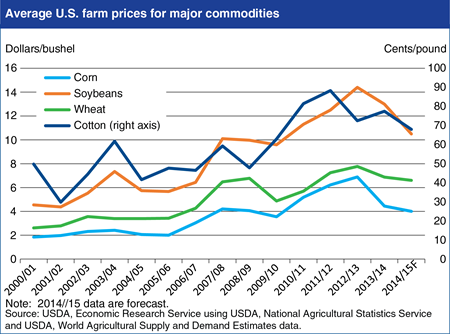
Current USDA forecasts show declines in U.S. average farm prices for major U.S. field crops—corn, soybeans, wheat, and cotton—of 4 to 19 percent in 2014/15. For corn, soybeans, and wheat, this would be the second consecutive year of declining prices. Soybean prices are forecast to decline the most in 2014/15, based on an expected record U.S. crop, combined with ample supplies from Brazil and Argentina. U.S. corn prices are forecast to fall 10 percent in 2014/15, after a 35-percent decline in 2013/14, also based on a large U.S. corn crop forecast and competition from other exporters like Brazil, Argentina, and Ukraine. U.S. wheat prices are forecast to decline about 4 percent in 2014/15, despite the forecast for smaller U.S. supplies, due to adequate supplies from both traditional and Black Sea wheat exporters. Although smaller cotton crops are forecast for China and India—the top two global producers—a larger U.S. crop is expected to lead to a fifth consecutive year of rising global cotton stocks and a 12-percent drop in U.S. prices in 2014/15. Find additional analysis in the current ERS outlook newsletters: Feed Outlook: July 2014, Oil Crops Outlook: July 2014, Wheat Outlook: July 2014, and Cotton and Wool Outlook: July 2014.
Thursday, July 17, 2014
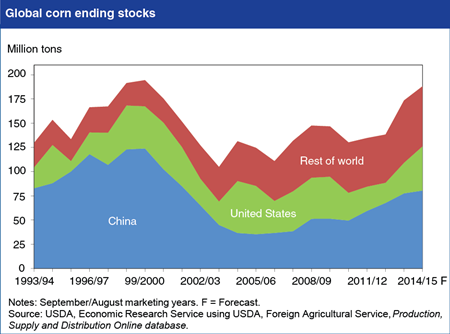
Global corn stocks are forecast to rise to the highest level in 15 years by the end of 2014/15 (September/August), leading to downward pressure on U.S. and global corn prices. Stocks fell to relatively low levels during 2003/04-2006/07, prior to the 2008 spike in world commodity prices, but are now forecast to reach 188.1 million tons in 2014/15, just 3 percent below the recent high of 194.4 million tons in 1999/2000. Since 2008/09, world corn production has exceeded total consumption in 5 out of 7 years. In addition to the United States and China—the two largest global producers and consumers of corn—production and stocks have been generally rising in Brazil, Russia, and Ukraine—countries that are also playing an expanding role as corn exporters. With a second consecutive above trend U.S. corn harvest forecast for 2014/15, the United States is expected to account for most of the 8-percent increase in global corn stocks forecast in 2014/15. With growing inventories, the U.S. season average farm price of corn is expected to decline to $4.00 per bushel, down 10 percent from $4.45 per bushel in 2013/14, and 42 percent from $6.89 per bushel in the U.S. drought year of 2012/13. Find this chart in the Feed Grain Chart Gallery and additional analysis in Feed Outlook: July 2014.


