ERS Charts of Note
Subscribe to get highlights from our current and past research, Monday through Friday, or see our privacy policy.
Get the latest charts via email, or on our mobile app for  and
and 
Thursday, March 17, 2016
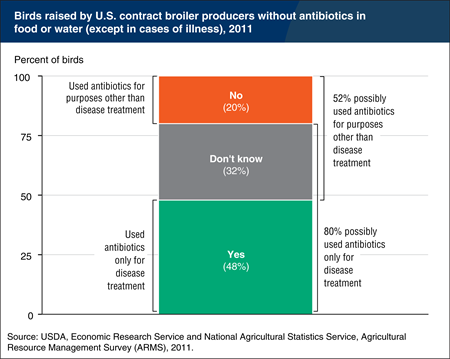
Livestock farmers use antibiotics to treat, control, and prevent disease, and also for production purposes, such as increasing growth and feed efficiency. A new U.S. Food and Drug Administration initiative seeks to eliminate the use of medically important antibiotics for production purposes. In the 2011 Agricultural Resource Management Survey (ARMS) on broilers (the most recent year available), producers were asked whether they raised their broilers without antibiotics in their feed or water unless the birds were sick, which implies not using antibiotics for growth promotion or disease prevention. In 2011, growers reported that about half of birds (48 percent) were only given antibiotics for disease treatment. This response also accounts for 48 percent of operations and 48 percent of production (by live weight). Approximately a third (32 percent) of operators stated that they did not know if they provided antibiotics via feed or water for purposes other than disease treatment; this means the proportion of reporting operations that only supplied antibiotics for disease-treatment purposes could be as high as 80 percent. Contracted growers (accounting for 96 percent of broiler production) may not know if antibiotics are in the feed provided by the company for whom they raise broilers. These statistics suggest that in 2011, between 20 and 52 percent of birds were given antibiotics for reasons other than disease treatment. This chart is found in the Amber Waves feature, “Restrictions on Antibiotic Use for Production Purposes in U.S. Livestock Industries Likely To Have Small Effects on Prices and Quantities,” November 2015.
Tuesday, March 1, 2016
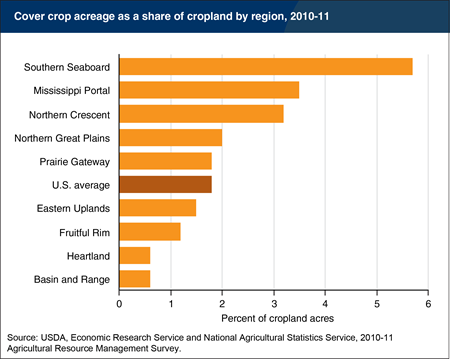
Cover crops are thought to play a role in improving soil health by keeping the soil “covered” when an economic crop is not growing. Cover crops reduce soil erosion, trap nitrogen and other nutrients, increase biomass, reduce weeds, loosen soil to reduce compaction, and improve water infiltration to store more rainfall. The 2010-11 Agricultural Resource Management Survey was the first USDA survey to ask respondents to report cover crop use (findings from the 2012 Agricultural Census—the most recent available—are similar). Approximately 4 percent of farmers adopted cover crops on some portion of their fields, accounting for 1.7 percent of total U.S. cropland (6.8 million acres) in 2010-11. Cover crop adoption was highest in the Southern Seaboard (5.7 percent) and lowest in the Heartland and Basin and Range (0.6 percent each). This distribution is likely due to the fact that cover crops are easiest to establish in warmer areas with longer growing seasons. Limited cover crop use overall, however, suggests that the benefits of cover crop adoption are being realized on few acres. This chart is from the ERS report, Conservation-Practice Adoption Rates Vary Widely by Crop and Region, December 2015.
Wednesday, February 17, 2016
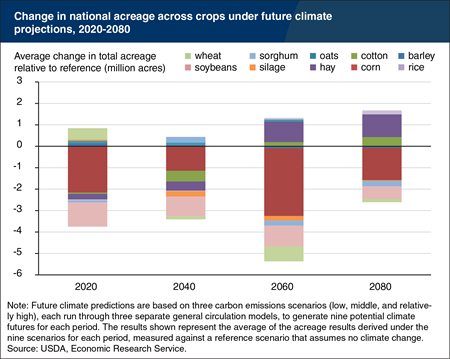
ERS research projects that climate change will result in a decline in national fieldcrop acreage over analysis years 2020, 2040, 2060, and 2080, when measured relative to a scenario that assumes continuation of reference climate conditions (precipitation and temperature patterns averaged over 2001-08). Acreage trends are explored for nine climate change scenarios, and substantial variability exists across climate change scenarios and crop sectors. When averaged over all climate scenarios, U.S. acreage in rice, hay, and cotton is projected to expand, while acreage in corn, soybeans, sorghum, wheat, and silage declines. Acreage response varies across crops as a function of the sensitivity of crop yields to changes in precipitation, temperature, and atmospheric carbon dioxide; the resulting changes in relative crop profitability; the coincidence of climatic shifts with geographic patterns of crop production; and variables related to the extent of crop reliance on irrigation. This chart is from the ERS report Climate Change, Water Scarcity, and Adaptation in the U.S. Fieldcrop Sector, November 2015.
Tuesday, February 2, 2016
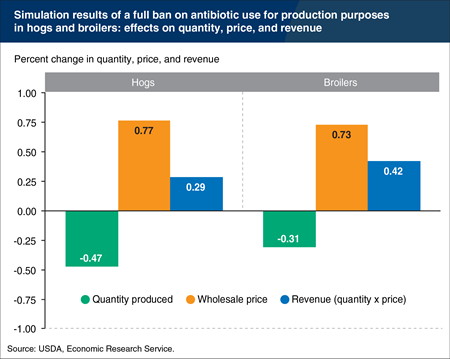
Livestock farmers use antibiotics to treat, control, and prevent disease, and also for production purposes, such as increasing growth and feed efficiency. A new U.S. Food and Drug Administration initiative seeks to eliminate the use of medically important antibiotics for production purposes. ERS research shows that only a portion of hog and broiler producers use antibiotics for production purposes, and the productivity increases from such uses are 1-3 percent. Modelling the effect of production-specific antibiotic restrictions suggests that such a policy would have a modest effect on wholesale prices and quantities produced of chicken and pork—less than a 1-percent increase in wholesale prices and a net decline in production of less than 0.5 percent. Because prices increase more than quantities decrease, gross revenues (price times quantity) would increase slightly. This chart is based on the table found in the Amber Waves feature, “Restrictions on Antibiotic Use for Production Purposes in U.S. Livestock Industries Likely To Have Small Effects on Prices and Quantities,” November 2015.
Monday, February 1, 2016
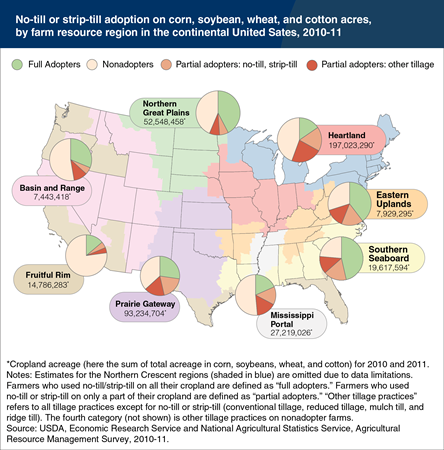
No-till and strip-till are two of many tillage methods farmers use to plant crops. In a no-till system, farmers plant directly into the undisturbed residue of the previous crop without tillage, except for nutrient injection; in a strip-till system, only a narrow strip is tilled where row crops are planted. These tillage practices contribute to improving soil health, and reduce net greenhouse gas emissions. During 2010-11, about 23 percent of land in corn, cotton, soybeans, and wheat was on a farm where no-till/strip-till was used on every acre (full adopters). Another 33 percent of acreage in these crops was located on farms where a mix of no-till, strip-till, and other tillage practices were used on only some acres (partial adopters). In the Prairie Gateway, Northern Great Plains, and Heartland regions—which account for 72 percent of corn, soybean, wheat, and cotton acreage—more than half of these crop acres were on farms that used no-till/strip-till to some extent. Partial adopters have the equipment and expertise, at least for some crops, to use no-till/strip-till; these farmers may be well positioned to expand these practices to a larger share of cropland acreage. This chart is from the ERS report, Conservation-Practice Adoption Rates Vary Widely by Crop and Region, December 2015.
Tuesday, January 19, 2016
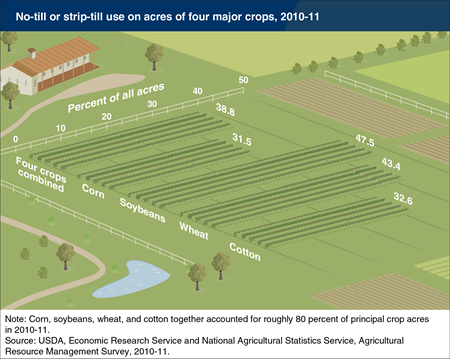
No-till and strip-till are two of several tillage methods farmers use to plant crops. These practices disturb the soil less than other methods, reducing soil erosion, helping maintain soil carbon, and can contribute to improved soil health. In a no-till system, farmers plant directly into the undisturbed residue of the previous crop without tillage, except for nutrient injection; in a strip-till system, only a narrow strip is tilled where row-crops are planted. Overall, 39 percent of the combined corn, soybean, wheat, and cotton acres (the four most widely grown crops in the U.S.) were in no-till/strip-till in 2010-11 (89 million acres per year), with adoption rates higher for some crops. Farmers may be more likely to use no-till/strip-till on crops that are thought to be well suited for the practices (e.g., soybeans) and more likely to use conventional tillage or other conservation tillage methods for crops where no-till/strip-till management is perceived as more risky (e.g., corn). Some farmers may also vary tillage based on field characteristics or weather. Tillage practices are often part of conservation plans that must be in use on highly erodible land to meet eligibility requirements (conservation compliance) for most Federal agricultural programs, including commodity programs and (after 2014) crop-insurance premium subsidies. This chart is from the ERS report, Conservation-Practice Adoption Rates Vary Widely by Crop and Region, December 2015.
Monday, November 30, 2015
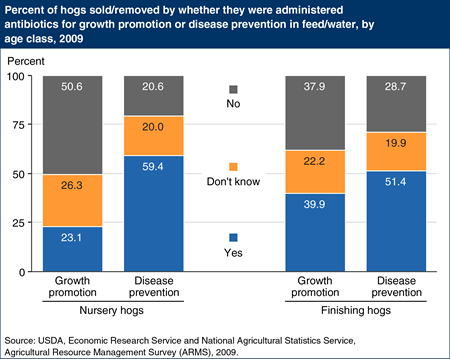
Hog producers use Hog producers use antibiotic drugs to treat/control animal diseases, but they also feed them to their hogs to prevent disease and to promote faster growth through improved absorption of feed. There is growing concern that widespread use of antibiotics in humans and animals may encourage microbial resistance and make the drugs less effective for maintaining their health, and the U.S. Food and Drug Administration (FDA) is moving to end the growth-promotion uses of medically important antibiotics in animal agriculture. Antibiotic use varies across the hog sector, according to a USDA survey of hog producers, and the FDA’s action will affect some but not all producers. Over half of pigs in the nursery stage do not receive antibiotics for growth promotion, and that figure could be as high as 75 percent, because 26 percent of hogs were raised by growers that stated they did not know if antibiotics are in the feed. Some contract growers don’t know if antibiotics are in the feed provided by the company for whom they raise hogs. Antibiotics are more likely to be used for growth promotion in finishing hogs (those being fed to market weight), but even here at least 40 percent of hogs did not receive the drugs for growth promotion. This chart is found in the ERS report, Economics of Antibiotic Use in U.S. Livestock Production, ERR-200, November 24, 2015. antibiotic drugs to treat/control animal diseases, but they also feed them to their hogs to prevent disease and to promote faster growth through improved absorption of feed. There is growing concern that widespread use of antibiotics in humans and animals may encourage microbial resistance and make the drugs less effective for maintaining their health, and the U.S. Food and Drug Administration (FDA) is moving to end the growth-promotion uses of medically important antibiotics in animal agriculture. Antibiotic use varies across the hog sector, according to a USDA survey of hog producers, and the FDA?s action will affect some but not all producers. Over half of pigs in the nursery stage do not receive antibiotics for growth promotion, and that figure could be as high as 75 percent, because 26 percent of hogs were raised by growers that stated they did not know if antibiotics are in the feed. Some contract growers don?t know if antibiotics are in the feed provided by the company for whom they raise hogs. Antibiotics are more likely to be used for growth promotion in finishing hogs (those being fed to market weight), but even here at least 40 percent of hogs did not receive the drugs for growth promotion. This chart is found in the ERS report, Economics of Antibiotic Use in U.S. Livestock Production, ERR-200, November 24, 2015.
Friday, November 27, 2015
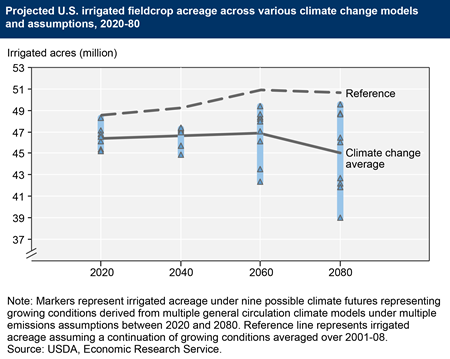
Climate models predict U.S. agriculture will face significant changes in local patterns of precipitation and temperature over the next century. These climate changes will affect crop yields, crop-water demand, water-supply availability, farmer livelihoods, and consumer welfare. Irrigation is an important strategy for adapting to shifting production conditions under climate change. Using projections of temperature and precipitation under nine climate change scenarios for 2020, 2040, 2060, and 2080, ERS analysis finds that on average, irrigated fieldcrop acreage would decline relative to a reference scenario that assumes continuation of climate conditions (precipitation and temperature patterns averaged over 2001-08). Before midcentury, the decline in irrigated acreage is largely driven by regional constraints on surface-water availability for irrigation. Beyond midcentury, the decline reflects a combination of increasing surface-water shortages and declining relative profitability of irrigated production. This chart is from the ERS report, Climate Change, Water Scarcity, and Adaptation in the U.S. Fieldcrop Sector, ERR-201, November 2015.
Friday, October 16, 2015
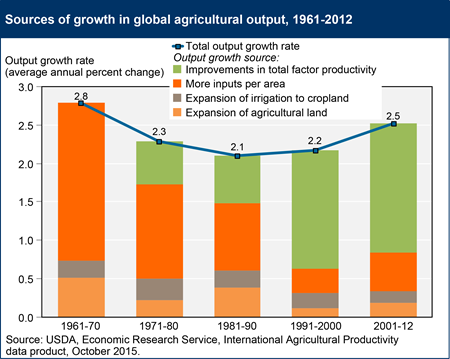
The average annual rate of global agricultural output growth slowed in the 1970s and 1980s, then accelerated in the 1990s and 2000s. In the latest period estimated (2001-12), global output of total crop and livestock commodities was expanding at an average rate of 2.5 percent per year. In the decades prior to 1990, most output growth came about from intensification of input use (i.e., using more labor, capital, and material inputs per acre of agricultural land). Bringing new land into agriculture production and extending irrigation to existing agricultural land were also important sources of growth. This changed over the last two decades, as input growth slowed. In 2001-12, improvements in productivity—getting more output from existing resources—accounted for about two-thirds of the total growth in agricultural output worldwide, reflecting the use of new technology and changes in management practices by agricultural producers around the world. This chart is based on the ERS data product, International Agricultural Productivity, updated October 2015.
Thursday, September 3, 2015
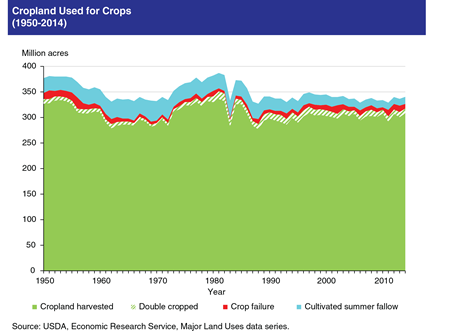
The ERS Major Land Uses (MLU) series estimates land in various uses, including the acres devoted to crop production in a given year. These acres, collectively referred to as “cropland used for crops,” include acres of cropland harvested, acres on which crops failed, and cultivated summer fallow. In 2014 (the most recent estimate), the total area of cropland used for crops was 340 million acres, up 4 million acres from the 2013 estimate but in line with the 30-year average. In 2014, cropland harvested increased by 2 percent (6 million acres) over the previous year. The 317 million acres of cropland harvested represents the highest harvested acreage since 1997, when cropland harvested was 321 million acres. The area double cropped—land from which two or more crops were harvested—declined by 1 million acres, a 10 percent decline from the 2013 double-cropped area of 10 million acres. Acres on which crops failed declined by 25 percent over the past year to 9 million acres, the lowest level since 2010. Cultivated summer fallow, which primarily occurs as part of wheat rotations in the semiarid West, has remained relatively stable over the last 10 years, although its use has been declining since the late 1960s. Larger historical fluctuations seen in cropland used for crops are largely attributable to Federal cropland acreage reduction programs. This chart is based on ERS’s Major Land Uses, Summary table 3: Cropland used for crops, updated August 31, 2015 to include 2014 estimates.
Thursday, July 30, 2015
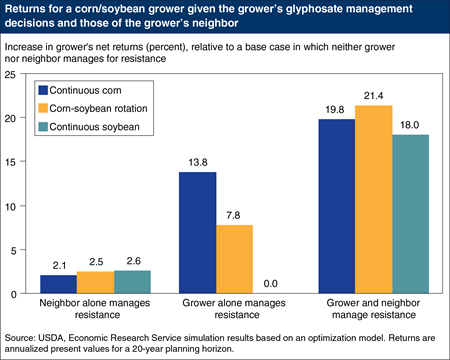
Glyphosate, also known by the trade name Roundup, is the most widely used herbicide in the United States. Widespread and exclusive use of glyphosate, without other weed control strategies, can induce resistance to the herbicide by controlling susceptible weeds while allowing more resistant weeds to survive, propagate, and spread. Resistant weed seeds can disperse across fields—carried by animals, equipment, people, wind, and water. Consequently, controlling weed resistance depends on the joint actions of farmers and their neighbors. ERS analyses evaluated the long-term financial returns to growers who adopt weed control practices that aim to slow resistance to glyphosate, and compared those returns when neighboring farmers also manage to slow resistance. Projected net returns (annualized over 20 years) for growers who manage resistance generally exceed returns for growers who ignore resistance; they are even higher when neighbors also manage resistance. Projected net returns for growers with neighbors who also manage resistance range 18-20 percent higher than those of growers/neighbors who ignore resistance. This chart visualizes data found in the Amber Waves feature, “Managing Glyphosate Resistance May Sustain Its Efficacy and Increase Long-Term Returns to Corn and Soybean Production,” May 2015.
Tuesday, July 28, 2015
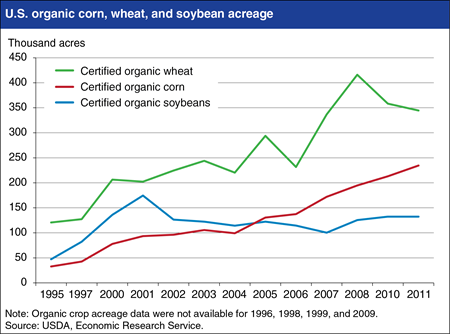
U.S. crop acres under USDA certified organic systems have grown since the National Organic Program was implemented in 2002. Organic crop acres increased from about 1.3 million in 2002 to almost 3.1 million in 2011, and part of this growth was in major field crops: corn, soybeans, and wheat. Among these 3 crops, certified organic production of corn increased the most, from about 96,000 acres in 2002 to 234,000 acres in 2011. Certified organic soybean acreage peaked at 175,000 acres in 2001, before falling to 100,000 acres in 2007 and rebounding to 132,000 acres in 2011. Wheat has the largest number of organic acres, starting at 225,000 acres in 2002 and peaking at more than 400,000 acres in 2008, before falling to 345,000 acres in 2011. Much of the increased organic corn production has been to support a rapidly growing organic dairy sector. Higher prices for conventional corn, soybeans, and wheat since 2008 and somewhat slower demand growth for organic products due to the economic recession, along with increasing imports of these crops, may have limited the growth in organic field crop acreage in recent years. This chart is from the ERS report, The Profit Potential of Certified Organic Field Crop Production, July 2015
Wednesday, July 8, 2015
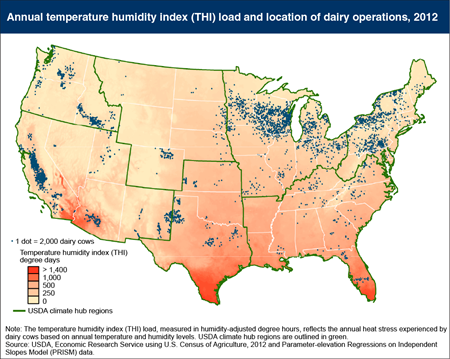
Above a temperature threshold, an animal may experience heat stress resulting in changes in its respiration, blood chemistry, hormones, metabolism, and feed intake. Dairy cattle are particularly sensitive to heat stress; high temperatures lower milk output and reduce the percentages of fat, solids, lactose, and protein in milk. In the United States, dairy production is largely concentrated in climates that expose animals to less heat stress. The Temperature Humidity Index (THI) load provides a measure of the amount of heat stress an animal is under. The annual THI load is similar to “cooling degree days,” a concept often used to convey the amount of energy needed to cool a building in the summer. The map shows concentrations of dairy cows in regions with relatively low levels of heat stress: California’s Central Valley, Idaho, Wisconsin, New York, and Pennsylvania. Relatively few dairies are located in the very warm Gulf Coast region (which includes southern Texas, Louisiana, Mississippi, Alabama, and Florida). This map is drawn from Climate Change, Heat Stress, and Dairy Production, ERR-175, September 2014.
Monday, May 18, 2015
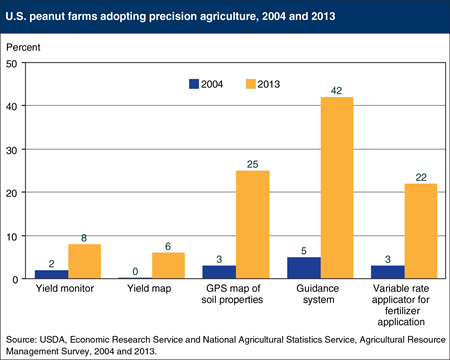
Precision agriculture is a set of practices used to manage fields by assessing variations in nutrient needs, soil qualities, and pest pressures. In 2013-14, USDA conducted the latest Agricultural Resource Management Survey (ARMS) of U.S. peanut growers, interviewing farmers about production practices, resource use, and finances. Some technologies have been rapidly adopted; in particular, 42 percent of peanut farms used auto-steer or guidance systems in 2013, up from 5 percent in 2006. These systems can reduce stress for operators and limit the over-application of inputs on field edges. Yield monitors and yield maps, with essentially no usage in 2006, were used on 8 and 6 percent of farms, respectively, in 2013. With these technologies, monitors can identify within-field yield variations so farmers can adjust inputs and practices accordingly. The use of variable rate application, which has increased from 3 to 22 percent of farms, allows for the adjustment of fertilizer application over a field so that fertilizer can be applied where and when it is needed, thus reducing costs and being more environmentally friendly. This chart is found in the joint ERS/National Agricultural Statistics Service (NASS) report, 2013 ARMS—Peanut Industry Highlights, based on ARMS Farm Financial and Crop Production Practices data.
Wednesday, March 25, 2015
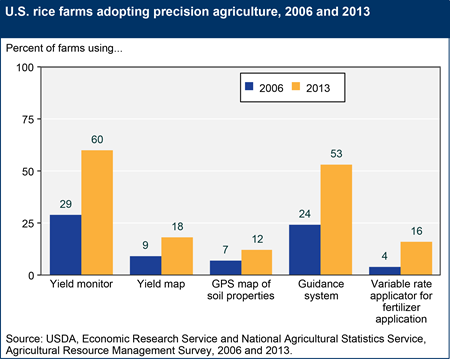
Precision agriculture refers to a set of practices used to manage fields by measuring variations in nutrient needs, soil qualities, and pest pressures. In 2013, USDA conducted the latest Agricultural Resource Management Survey (ARMS) of the U.S. rice industry, interviewing farmers about production practices, resource use, and finances in the 10 largest rice-producing States. Some technologies have been rapidly adopted; in particular, yield monitoring increased in use to 60 percent of farms between 2006 and 2013. Monitors can identify variations in yields within a field, allowing farmers to adjust inputs and practices accordingly. Auto-steer or guidance systems are now used on over half of all rice farms; these reduce stress on operators, and reduce errors in input application overlaps and seeding cut-off at the end rows. The cost savings from using these two technologies can also be accompanied by increases in yields. This chart is found in the joint ERS/National Agricultural Statistics Service (NASS) report, 2013 ARMS—Rice Industry Highlights, based on ARMS Farm Financial and Crop Production Practices data.
_450px.png?v=2281.8)
Wednesday, March 11, 2015
By using new technologies, farmers can produce more food using fewer economic resources at lower costs. One measure of technological change is total factor productivity (TFP). Increased TFP means that fewer economic resources (land, labor, capital and materials) are needed to produce a given amount of economic output. However, TFP does not account for the environmental impacts of agricultural production; resources that are free to the farm sector (such as water quality, greenhouse gas emissions, biodiversity) are not typically included in TFP. As a result, TFP indexes may over- or under-estimate the actual resource savings from technological change. Growth in global agricultural TFP began to accelerate in the 1980s, led by large developing countries like China and Brazil. This growth helped keep food prices down even as global demand surged. This chart uses data available in International Agricultural Productivity on the ERS website, updated October 2014.
Thursday, February 12, 2015
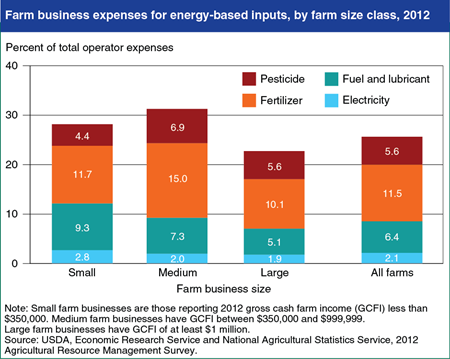
The agricultural sector uses energy both directly (in the form of fuel and electricity) and indirectly (through use of energy-intensive inputs, such as fertilizers and pesticides). Data from the Agricultural Resource Management Survey show that on average, the share of operator expenses for indirect energy (about 17.1 percent) exceeds the share of expenses for direct energy (about 8.5 percent) among U.S. farm businesses, across all farm sizes. Small farm businesses have the highest share of direct energy expenditures (about 12 percent of all small farm production expenses), while medium-sized farm businesses have the highest share of indirect energy expenditures (about 22 percent of expenses). Large farm businesses have the lowest share of energy-based expenses, since large farms typically have higher expenses for labor than smaller farms, reducing energy’s share of total expenses. This chart is found in the September 2014 Amber Waves data feature, “Agricultural Energy Use and the Proposed Clean Power Plan.”
Monday, January 26, 2015
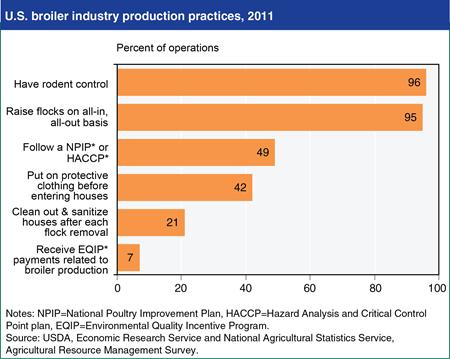
USDA’s National Agricultural Statistics Service and Economic Research Service recently conducted the Agricultural Resource Management Survey (ARMS) of the U.S. broiler chicken industry. Results indicate that several sanitation and biosecurity practices were widespread on broiler operations in the United States in 2011. Almost all operations used practices to control rodent and wild bird access to facilities, and almost all rotated flocks on an all-in, all-out basis, aimed at limiting the spread of pathogens and disease among animals. Nearly half of broiler operations reported that they follow the National Poultry Improvement Plan (NPIP) or a Hazard Analysis and Critical Control Point (HACCP) Plan, which are designed to improve animal health, food safety, and food quality. One-fifth of operations fully cleaned out and sanitized their houses after each flock removal. USDA may provide support for incineration and composting facilities, as well as litter management practices, through payments made under the Environmental Quality Incentive Program (EQIP). ARMS results find that seven percent of contract growers received EQIP payments related to broiler production in 2011. This chart is found in the ERS/NASS report, 2011 ARMS - Broiler Industry Highlights.
Monday, January 12, 2015
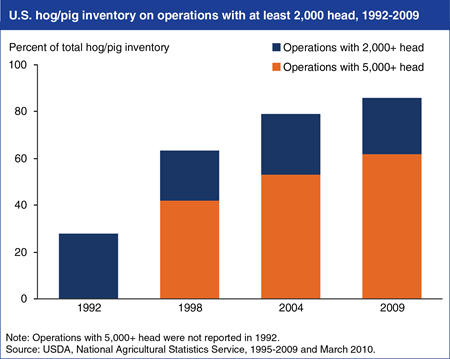
While the number of all farms in the United States remained fairly constant, the number of hog farms fell by about 70 percent between 1992 and 2009, from over 240,000 to about 71,000. Despite fewer hog farms, the Nation’s hog inventory was stable during the period, averaging about 60 million head, with cyclical fluctuations between 56 and 68 million head. Thus, hog production consolidated as fewer, larger farms accounted for an increased share of total output. From 1992 to 2009, the share of the U.S. hog and pig inventory on farms with 2,000 head or more increased from less than 30 percent to 86 percent. In 2009, farms with 5,000 head or more accounted for 61 percent of all hogs and pigs. This chart is found in the ERS report, U.S. Hog Production From 1992 to 2009: Technology, Restructuring, and Productivity Growth, ERR-158, October 2013.
Tuesday, December 16, 2014
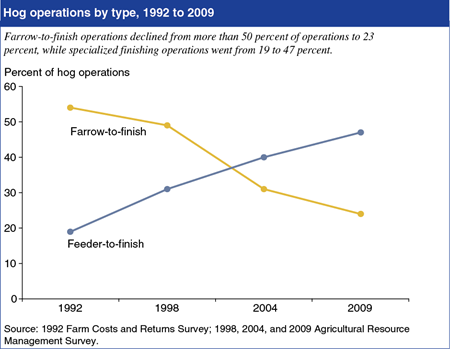
The traditional approach of farrow-to-finish hog production in the U.S.—where breeding and gestation, farrowing, nursery, and finishing to market weight are performed on one operation—is being replaced by operations that specialize in a single production phase. In 1992, more than 50 percent of U.S. hog operations used the farrow-to-finish approach. By 2009, less than 25 percent were farrow-to-finish producers. In contrast, hog operations specializing in raising feeder pigs weighing 30-80 pounds to market weights of 225-300 pounds (feeder-to-finish) accounted for less than 20 percent of hog producers in 1992, but nearly 50 percent in 2009. Specialized operations produced more than 70 percent of U.S. finished hog output in 2009, and were more likely to be producing hogs under contract than were farrow-to-finish farms. This chart is found in the ERS report, U.S. Hog Production From 1992 to 2009: Technology, Restructuring, and Productivity Growth, ERR-158, October 2013.


