ERS Charts of Note
Subscribe to get highlights from our current and past research, Monday through Friday, or see our privacy policy.
Get the latest charts via email, or on our mobile app for  and
and 
_450px.png?v=6858.1)
Monday, October 31, 2022
Spring wheat, a major class of U.S. wheat, annually accounts for about 25 percent of all wheat produced in the United States and is grown primarily in the U.S. Northern Plains States, mostly in North Dakota and Minnesota. Overly wet field conditions in spring 2022 delayed planting in both North Dakota and Minnesota resulting in 26 and 35 percent, respectively, of spring wheat acres being planted after June 5—USDA, Risk Management Agency’s (RMA) final planting date of all counties in those two States. That acreage was reported to USDA, Farm Service Agency as being prevented from on-time planting. If a farmer has not planted by the final planting date, most crop insurance policies offer compensation to offset expenses associated with preparing to plant, called a prevented planting payment. Alternatively, when commodity prices are high, some producers may choose to plant late because of field conditions and receive the market price for their harvest crop rather than take a prevented planting payment. RMA projected pre-season prices for spring wheat in North Dakota and Minnesota at $9.19 per bushel, the highest price in the last decade (2012–21), which may have contributed to acreage being planted later. This chart is drawn from the special article, "Factors Influencing Prevented Planting for Spring Wheat" in Economic Research Service’s Wheat Outlook, September 2022.
Thursday, October 27, 2022
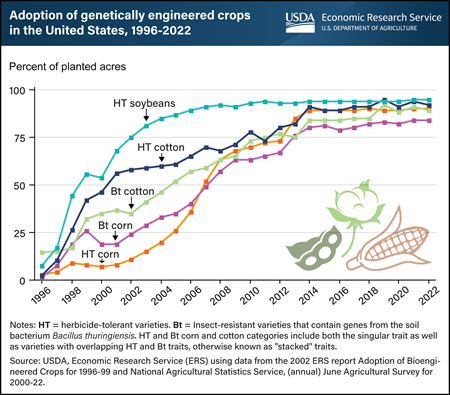
Genetically engineered (GE) seeds were commercially introduced in the U.S. for major field crops in 1996, with adoption rates increasing rapidly in the years that followed. By 2008, more than 50 percent of corn, cotton, and soybean acres were planted with genetically engineered seeds. The total planted acreage with GE seeds has only increased since then, and now more than 90 percent of U.S. corn, upland cotton, and soybeans are produced using GE varieties. GE crops are broadly classified as herbicide-tolerant (HT) only, insect-resistant (Bt) only, or stacked varieties that combine both HT and Bt traits in a single seed. In the chart, both HT and Bt lines include stacked varieties which are a combination of both type of traits. Although other GE traits have been developed, such as virus and fungus resistance, drought resistance, and enhanced protein, oil, or vitamin content, HT and Bt traits are the most commonly used in U.S. crop production. While HT seeds are also widely used in alfalfa, canola, and sugar beet production, most GE acres are planted to three major field crops: corn, cotton, and soybeans. This chart appears in the ERS Topic Page Recent Trends in GE Adoption, published in 2022.
Wednesday, October 26, 2022
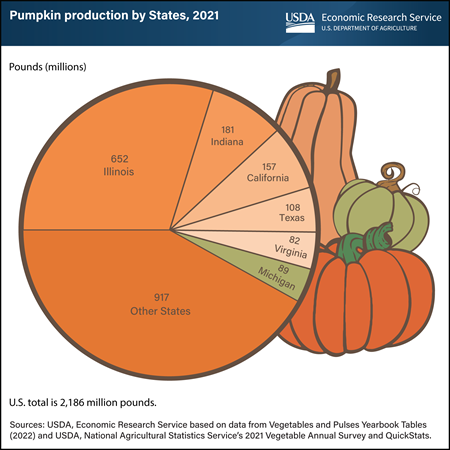
Pumpkins are on full display across the United States as part of many fall traditions, such as picking pumpkins at local farms, carving jack-o’-lanterns for Halloween, or baking pumpkin desserts for Thanksgiving. The production of pumpkins, from classic orange Howdens to new varieties like Cinderella, is widely dispersed throughout the United States, with all States producing some pumpkins. However, about 40 percent of pumpkin acres are harvested in only six States. By acreage and weight, Illinois is consistently the Nation’s largest pumpkin producer. In 2021, Illinois produced 652 million pounds, more than a quarter of total U.S. pumpkin production and more than the next five States combined. Unlike all other States, most of Illinois’ pumpkins are used for pie filling and processed for other food uses. Pumpkins from the other States are primarily intended for decorative, or carving, use. In 2021, Indiana produced 181 million pounds of pumpkins, California grew 157 million pounds, Texas grew 108 million pounds, Michigan grew 89 million pounds, and Virginia grew 82 million pounds. Retail prices for pumpkins typically fluctuate week to week leading up to Halloween. In the third week of October 2022, the average retail price for jack-o’-lantern style pumpkins was $5.07 per pumpkin, up 2 percent compared to the same week in 2021. This chart is drawn from Economic Research Service’s Trending Topics page, Pumpkins: Background & Statistics.
Thursday, October 20, 2022
Errata: On Oct. 25, 2022, a clarification was made for Florida's ranking in citrus production.
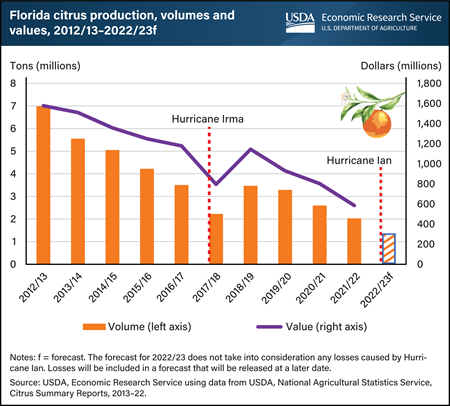
On September 28, 2022, Hurricane Ian made landfall as a category 4 hurricane on the southwest coast of Florida, the United States’ top producer of oranges. The hurricane crossed the peninsula, bringing severe winds and rainfall to some of the State’s foremost citrus-producing counties. Many of these same counties were affected by Hurricane Irma 5 years earlier. When Irma hit in September 2017, the State’s citrus production was already on a downward trajectory from diseases and other factors reducing acreage and yields. Florida’s citrus production fell by 1.3 million tons from the hurricane-free 2016/17 season, with the total value of production dropping 39 percent. On October 12, 2022, USDA’s National Agricultural Statistics Service released a citrus production estimate of about 1.4 million tons for the 2022/23 crop year. This forecast is 32 percent below total production from the previous season and does not take into consideration losses from Ian. While 2017 and 2022 hurricane events are distinct from one another, the effects of Irma can be used as a proxy to estimate the potential impact on value until the impact on the State’s total citrus production can be fully assessed. This chart is based on USDA, Economic Research Service (ERS) Fruit and Tree Nuts Outlook Report, released September 2022, and ERS’ Fruit and Tree Nuts Yearbook Tables, released October 2021, and has been updated with recent data.
_450px.png?v=6858.1)
Monday, October 17, 2022
U.S. production of durum—the primary class of wheat used to produce pasta—is expected to increase in the 2022/23 marketing year after last year’s drought reduced production to its lowest in 60 years. Production in 2022/23 is forecast at 64 million bushels, up 70 percent from the previous marketing year (2021/22), but below the average of the previous five years (2016/17–2020/21). Durum used for food in the 2022/23 marketing year is estimated at 80 million bushels, close to the historical average and slightly above 2021/22. Food use of durum was elevated in marketing years 2019/20 and 2020/21, fueled by surging consumer demand during the Coronavirus (COVID-19) pandemic, when shoppers stocked up on pasta while in quarantine. While the surge in demand has since subsided, consumer prices for wheat-based products including pasta are up substantially in 2022. This year’s larger durum crop, along with larger Canadian production, has eased some supply pressure; however, high commodity prices in general and elevated input, labor, and energy costs have each contributed to higher prices for the manufactured products of wheat, including pasta. The United States imports and exports durum every year, with imports typically larger. Net imports rise in years when production is lower. This chart is drawn from the USDA, Economic Research Service Wheat Outlook, October 2022.
Thursday, October 13, 2022
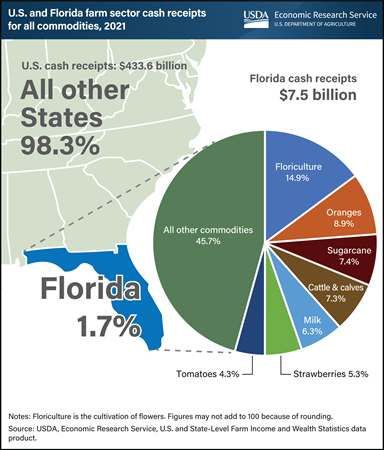
USDA, Economic Research Service (ERS) annually estimates the previous year’s farm sector cash receipts—the cash income received from agricultural commodity sales. This data includes State-level estimates, which offer background information about States subject to unexpected events that affect the agricultural sector, such as Hurricane Ian, which swept across Florida and surrounding States in late September 2022. In 2021, commodities produced in Florida contributed about $7.5 billion (1.7 percent) of the $434 billion in total U.S. cash receipts. Floriculture, the cultivation of flowers, accounted for the largest share of Florida’s cash receipts. Valued at $1.1 billion (14.9 percent of the State’s total), floriculture receipts for Florida were higher than for any other State in 2021. The next largest commodities in Florida in terms of cash receipts were oranges ($670 million), sugarcane ($553 million), cattle and calves ($546 million), milk ($470 million), strawberries ($399 million) and tomatoes ($324 million). Certain Florida crops accounted for large percentages of U.S. cash receipts in 2021, such as sugarcane with 51 percent and oranges with 42 percent, while bell peppers and grapefruit accounted for roughly a third of U.S. production. In addition to floriculture, Florida led the nation in cash receipts for sugarcane, cabbage, cucumbers, watermelon, sweet corn, and snap beans. This chart uses data from the ERS U.S. and State-Level Farm Income and Wealth Statistics data product, updated in September 2022.
_450px.png?v=6858.1)
Wednesday, September 28, 2022
From sweet and juicy to tart and crisp, apples grown in the United States vary with a wide range of characteristics. Prices received by apple producers reflect consumer preferences for these varied attributes, as well as production-related factors, including volume harvested, cultivation methods, and storability. In the State of Washington, where two-thirds of all U.S. apples are grown, price and production data for more than 20 different apple varieties are collected and published by the Washington State Tree Fruit Association. The iconic Red Delicious apple led production among varieties in Washington in the 2018/19 marketing year. This variety alone accounted for more than 29 million 40-pound boxes, or 25 percent of Washington State’s apple production for both domestic and international use. Red Delicious apples are usually harvested with a single pass through the orchard and are the easiest and least expensive variety for growers to harvest. In 2018/19, the price of a 40-pound box was $17.65, among the lowest of all varieties surveyed. Over the last two decades, varieties including Gala, Fuji, Granny Smith, and Honeycrisp have gained popularity among consumers. Honeycrisp apples are prized for their firm flesh and balance of both sweet and tart flavors—making them a popular snacking apple. Growing consumer demand has helped to elevate Honeycrisp production to more than 12 million 40-pound boxes in 2018/19 and supports both a retail- and farm-price premium. In 2018/19 Honeycrisp was Washington’s highest priced apple at $53.39 for a 40-pound box. Farm prices for Honeycrisp apples are higher, in part, because of elevated labor costs associated with harvest. Because this cultivar does not uniformly ripen, up to five passes through the orchard are required to harvest a crop of Honeycrisp apples. This chart is drawn from the USDA, Economic Research Service’s “Supplement to Adjusting to Higher Labor Costs in Selected U.S. Fresh Fruit and Vegetable Industries: Case Studies,” August 2022.
Monday, September 26, 2022
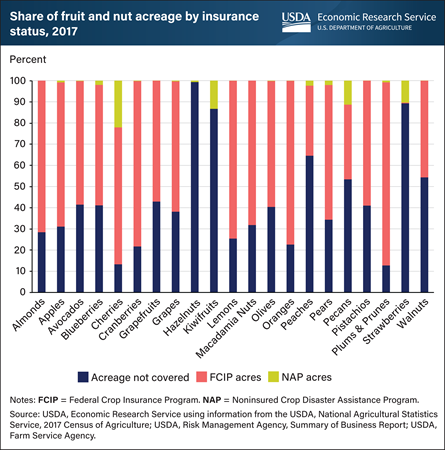
There are two permanent Federal options for specialty crop farmers to protect themselves against losses from natural disasters, but usage varies widely across fruit and nut crops. The USDA Risk Management Agency offers Federal Crop Insurance Program (FCIP) products to cover specialty crops in counties with enough data available to offer an actuarially sound insurance product. For crops grown in counties without enough data to provide FCIP products, coverage is available through the USDA Farm Service Agency Noninsured Crop Disaster Assistance Program (NAP). Using cherries as an example, FCIP is available for cherry growers who operate in counties with a high number of cherry acres. Because of this, farmers used FCIP to cover about 65 percent of all cherry acres. Cherry growers outside of those counties used NAP policies to cover about 20 percent of all cherry acres, leaving only 15 percent of acres not covered by any risk management program. For some crops, however, Federal agricultural risk management programs covered only a small portion of acres. Kiwifruits and strawberries had less than 15 percent of acres covered by either FCIP or NAP, while hazelnuts had less than 1 percent. This chart appears in the Economic Research Service bulletin Specialty Crop Participation in Federal Risk Management Programs, published in September 2022.
Monday, October 4, 2021
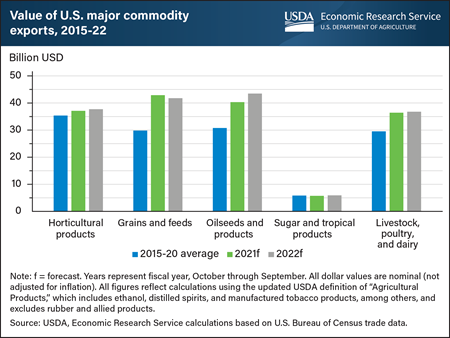
USDA, Economic Research Service (ERS) projects the total value of U.S. agricultural exports to reach an all-time high in fiscal year (FY) 2022 (October–September). Higher shipments of major categories of commodities including grains and feeds, oilseeds and products, and livestock, poultry, and dairy products are primarily driving the increase in value. Total U.S. agricultural export values are projected to reach $177.5 billion in FY 2022, up from their previous high of $173.5 billion in FY 2021. Grains and feeds export values are projected up from their 5-year average, reflecting higher international demand for corn, wheat, and feeds. Oilseeds and products are projected to reach a record $43.5 billion in FY 2022. International demand for soybeans coupled with higher prices is projected to drive export values to a record high for FY 2021 before increasing further in FY 2022. Soybean meal exports also are projected to reach record value. Livestock, poultry, and dairy exports, which have averaged $29.5 billion from 2015 to 2020, are forecast to rise to $36.8 billion in FY 2022. This projected increase is led by a rise in export value for all product groups except pork, with especially strong exports in beef and dairy. Higher prices and higher traded volumes for many commodities along with the reconciliation of trade disputes all contribute to the growth in export value. This chart is drawn from data in ERS’s Outlook for U.S. Agricultural Trade, August 26, 2021, and reflects USDA’s new definition of “Agricultural Products,” which includes ethanol, distilled spirits, and manufactured tobacco products and excludes rubber and allied products.
Wednesday, August 18, 2021
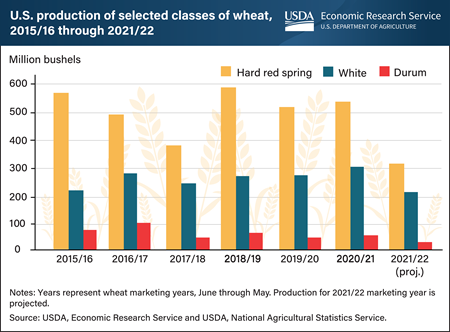
Widespread drought across the northern and western regions of the United States has dampened prospects for projected production and exports in the 2021/22 marketing year of three classes of U.S. wheat: hard red spring, white, and durum. Cultivation of hard red spring wheat, typically the second largest class of U.S. wheat, is concentrated in the Northern Plains, where about 99 percent of production is being grown in an area experiencing drought. Harvest of this class is projected to fall 42 percent from the previous year to the lowest level in more than 30 years, while exports are expected to contract to the lowest volume in more than a decade. U.S. durum production, which is also concentrated in the Northern Plains, is also projected to fall substantially in the 2021/22 marketing year to the lowest level in 60 years. With the United States generally a net importer of durum, larger imports from Canada are expected. Drought has also affected the Pacific Northwest region, where the majority of U.S. white wheat is produced, resulting in a 29 percent year-to-year decline in production of that class. With white wheat production at the lowest level on record dating back to the 1974/1975 marketing year, exports—mainly destined for markets in Asia—are projected down 41 percent from the prior marketing year. This chart is drawn from the USDA, Economic Research Service Wheat Outlook, published in August 2021.
Wednesday, February 10, 2021
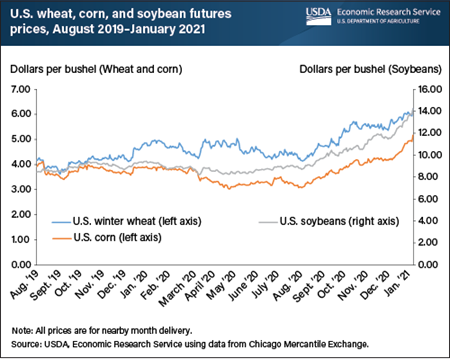
Futures prices—the price of a contract to deliver a commodity at a certain time in the future—for wheat, corn, and soybeans have been trending upward since August 2020. This 6-month trend of rising prices accelerated in the first weeks of 2021, demonstrating stronger price gains in anticipation of USDA’s revised production forecasts for major U.S. grains in the World Agricultural Supply and Demand Estimates (WASDE) for January 2021. Hard red winter wheat futures prices for the nearby month (e.g., prices associated with an active futures contract with the shortest time to maturity/delivery) rose 72 cents per bushel (13 percent) during the 30-day period just ahead of the January 12, 2021 release of the WASDE. During the same 30-day period, corn and soybean contracts for nearby month delivery rose 98 cents and $2.69 per bushel, respectively (approximately 23 percent each), and the season average farm price of soybeans reached their highest level since the marketing year of 2013-14. The realization of tightening supplies coupled with robust demand from export markets, most notably China, have stimulated steady price increases for the big three U.S. row crops—wheat, corn, and soybeans. Additionally, dry conditions in key areas of corn and soybean production in South America have reduced regional production prospects and the outlook for global supplies, providing further support to associated U.S. commodity prices. This chart is drawn from the USDA, Economic Research Service’s January 2021 Wheat Outlook, Oil Crops Outlook, and Feed Grains Outlook reports.
Friday, September 11, 2020
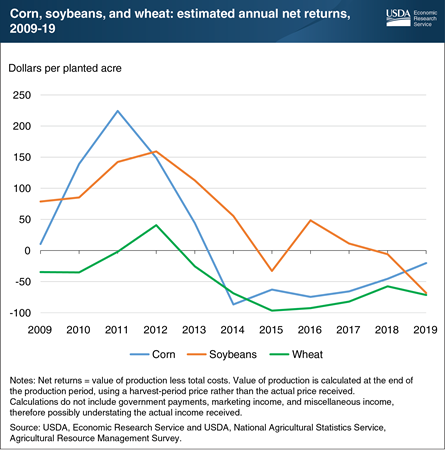
Producers of some of the U.S. major field crops have struggled to cover total costs of production over the past decade. The Economic Research Service’s (ERS) Commodity Costs and Returns product estimates this gap or surplus in the calculation of the value of production less total costs, referred to here as net returns. Total costs comprise operating costs, which include expenses such as fertilizer, seed, and chemicals, and allocated overhead (economic) costs, which include unpaid labor, depreciation, land costs, and other opportunity costs. Although revenue from selling crops can typically cover operating costs each year, net returns have often been negative. This suggests that, in some cases, allocated overhead costs are not covered. Corn’s net returns increased early in the decade, primarily due to a boom in the production of corn-based ethanol. Corn yields and acreage remained high after the boom, leaving supply high and leading, in part, to lower prices and returns over time. Net returns for soybeans shadowed those for corn during the ethanol boom, remaining higher than those for corn up until 2018. Wheat prices and returns also declined, due to strong international competition and several high-yield domestic crops. This chart is derived from data collected from the ERS Commodity Costs and Returns data product. Its data can also be viewed via ERS’s interactive data visualization product, U.S. Commodity Costs and Returns by Region and by Commodity.
Monday, July 20, 2020
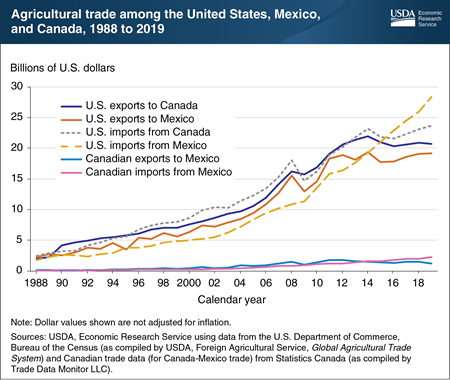
The United States-Mexico-Canada Agreement (USMCA) is a new economic and trade agreement that modifies the terms of the North American Free Trade Agreement (NAFTA), adding provisions for continued growth in agricultural trade among the three member countries. Agriculture has a large and growing stake in interregional trade in the free-trade area created by NAFTA. The total value of intraregional agricultural trade (exports and imports) among all three NAFTA countries reached about $95.3 billion in 2019, compared with $16.6 billion in 1993 (the year before NAFTA’s implementation). Even after taking the effects of inflation into account, this expansion corresponds to an increase in intraregional agricultural trade of 252 percent. Under the ratified new agreement, which took effect on July 1, 2020, all agricultural products that had zero tariffs under NAFTA will continue to have zero tariffs under USMCA. The USMCA adds provisions on biotechnology; geographical indicators; and sanitary and phytosanitary measures, which are measures to protect humans, animals, and plants from diseases, pests, or contaminants. It also provides broader market opportunities for U.S. exports to Canada of dairy, poultry, and egg products. These new provisions, coupled with the continuation of intraregional free trade in almost all agricultural products, provides the foundation for further agricultural trade growth among the United States, Mexico, and Canada. This chart appears in the Economic Research Service’s Amber Waves article, “United States-Mexico-Canada Agreement (USMCA) Approaches the Starting Block, Offers Growth Opportunities for Agriculture.”
Friday, May 15, 2020
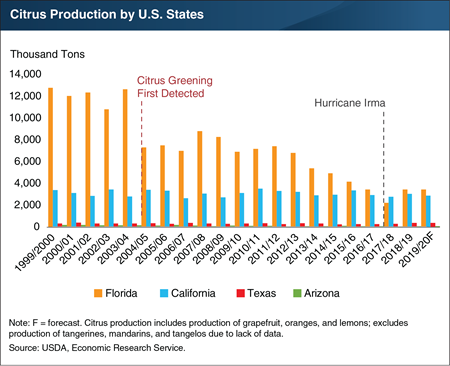
A disease affecting citrus trees hit Florida’s groves especially hard in the past decade and a half. But despite the disease’s ravages, Florida citrus production levels for the 2019/20 season are forecast to be about steady with last year (2018/19). The United States is a major global citrus producer with the 2018/19 crop valued at $3.35 billion. The citrus industry is vulnerable to numerous threats, including Huanglongbing (HLB), which has attacked the industry since 2005. HLB, also known as citrus greening disease, impedes citrus trees’ ability to process nutrients, disrupts the maturation of fruit, and shortens tree life. Although now present in every commercial citrus-producing State, including California, Arizona, and Texas, HLB has spread most rapidly through Florida, the nation’s top producer of oranges and grapefruit; it is now estimated to have infected all groves in the State. Since HLB arrived in Florida, the State went from producing nearly 80 percent of the nation’s non-tangerine citrus fruit to less than 42 percent. Disregarding a temporary drop in production in 2017/18 caused by Hurricane Irma, production levels have been relatively stable for the last four years. This steady trend in production may suggest Florida growers are succeeding at retarding further spread of the disease and minimizing its effect on infected trees. This chart is based on the Economic Research Service (ERS) Fruit and Tree Nuts Outlook Report, released March 2020, and ERS Fruit and Tree Nuts Yearbook Tables, released October 2019.
Monday, May 4, 2020
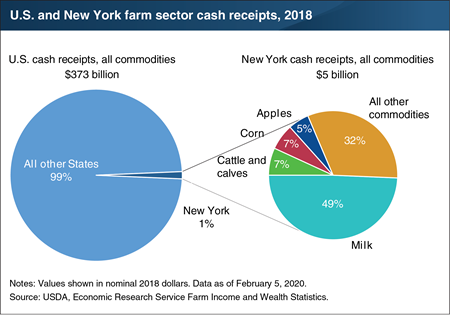
Each August, the Economic Research Service (ERS) produces and publishes estimates of the (farm sector) cash receipts—the cash income the farm sector receives from agricultural commodity sales—from the prior year. These data include State-level estimates, which can help offer background information about States subject to unexpected changes that may affect the agricultural sector, such as the current COVID-19 shelter-in-place restrictions in New York and other States. In 2018, U.S. cash receipts for all commodities totaled $373 billion. New York contributed about 1 percent ($5 billion) of that total, ranking 27th among all States. Receipts from milk accounted for the largest share of cash receipts in New York, at 49 percent ($2.5 billion). The State ranked third in milk cash receipts behind California and Wisconsin, accounting for 7 percent of milk cash receipts nationwide. New York also ranked third in apple cash receipts behind Washington and Michigan, accounting for 9 percent ($262 million) of apple cash receipts nationwide and 5 percent of New York’s total cash receipts. Receipts for corn and cattle/calves each accounted for 7 percent of the State’s total cash receipts. Although contributing a smaller amount to total cash receipts in the State, nationwide New York accounted for 18 percent ($26 million) of maple products receipts, 13 percent ($53 million) of cabbage receipts and 13 percent ($24 million) squash receipts. This chart uses State-level data from the ERS data product Farm Income and Wealth Statistics, updated February 2020.
Wednesday, March 4, 2020
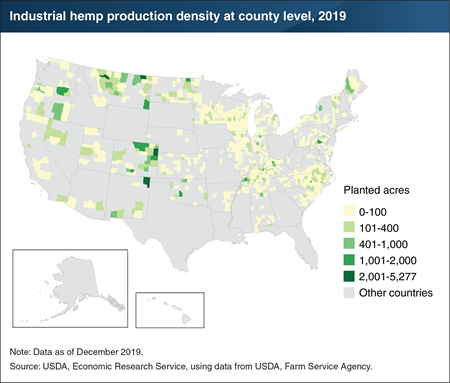
After a hiatus of almost 45 years, the Agricultural Act of 2014, Public Law 113-79 (the 2014 Farm Bill) reintroduced industrial hemp production in the United States through State pilot programs. Industrial hemp is a strain of Cannabis sativa that is low in active tetrahydrocannabinol (THC), the psychoactive ingredient in marijuana. It is grown specifically for a variety of industrial products. Production of industrial hemp beyond the pilot programs was legalized in the Agricultural Improvement Act of 2018, Public Law 115-334 (the 2018 Farm Bill). By mid-2019, 47 States had passed legislation to allow some form of hemp production and planted acreage reported to the USDA Farm Service Agency increased from zero in 2013 to 32,464 in 2018 to 146,065 in 2019. Hemp competes for acreage against crops with established markets and decades of agronomic research and industry experience. Through 2019, the largest hemp acreage is found in States that are not leading producers of conventional field crops such as corn, soybeans, wheat, or cotton. This chart is based on information in the Economic Research Service report, Economic Viability of Industrial Hemp in the United States: A Review of State Pilot Programs.
Friday, February 21, 2020
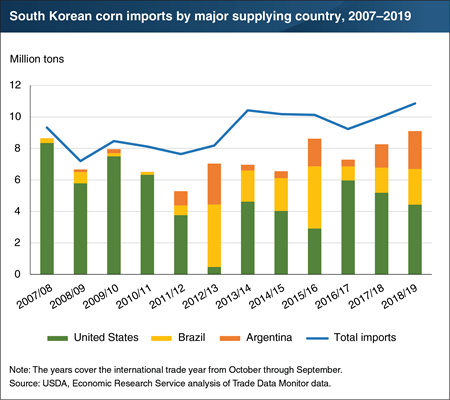
Since 2010, the United States has been losing its dominant position as a corn import supplier to South Korea. Although Mexico is the largest foreign market for U.S. corn, before 2011 South Korea was a large and stable purchaser. However, the U.S. share in South Korea’s corn imports has dropped from 84 percent during the years of 2007-2011 to 46 percent during 2015-2019. In 2012, drought in the United States contributed to the loss in its corn export share vis-à-vis South Korea (and the entire world market) in that year. Yet, the main reason for the decline in U.S. corn export share with South Korea since 2012 has been that the amount of corn supplied by export competitors—in particular, Brazil and Argentina—has risen as large crops in those countries increased their price competitiveness (with some annual fluctuation). South Korea is a very price-sensitive grain importer, and Brazil and Argentina have been supplying corn at attractively low prices. The U.S. loss of corn import share in South Korea is part of a general trend of declining U.S. corn export share in the world, despite higher global corn trade and slightly growing U.S. corn production. This chart was previously published in the ERS Feed Outlook report released in January 2020.
Friday, October 18, 2019
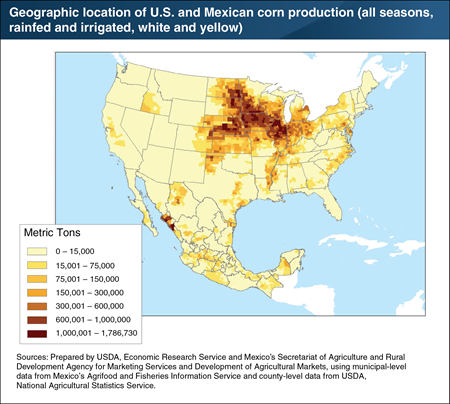
As the leading crop produced by both Mexico and the United States, corn is grown in many parts of each country, but cultivation is concentrated in areas best suited to corn production. In the United States, corn is cultivated primarily in the country’s Midwestern States, stretching from Nebraska to Ohio, a region dubbed the “Corn Belt.” Nearly 80 percent of U.S. corn area is rainfed, with irrigated production occupying much of corn-growing areas in Nebraska, Colorado, Kansas, and Texas. The largest quantities of production occur in Iowa, Illinois, Nebraska, and Minnesota, States that also lead in yields. U.S. corn production is almost exclusively of the yellow corn variety, with the majority used for purposes other than human consumption (e.g. feed, ethanol). In contrast, Mexico produces mainly white corn, and a greater share of Mexican corn than U.S. corn is used for food. Although white corn is grown in all of Mexico’s 32 States, 10 States account for 84 percent of production, and two States (Sinaloa and Jalisco) account for over one-third. This chart appears in the ERS report, The Growing Corn Economies of Mexico and the United States, released in July 2019.
Tuesday, May 21, 2019
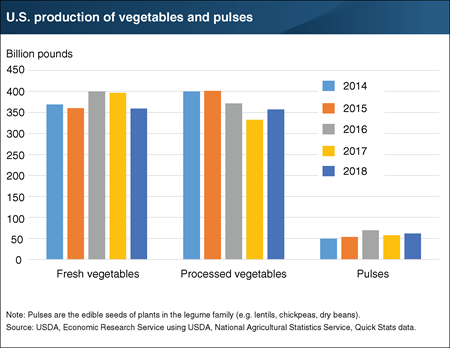
Consumer demand for fresh vegetables remains high, but domestic fresh vegetable production fell 10 percent from 2017 to 2018, marking the largest year-to-year decline of the last 20 years (1999–2018). Furthermore, for the same 20-year period, 2018 domestic fresh vegetable production reached its lowest level at 359 billion pounds, largely the result of diminishing harvested area. The production decline from 2017 to 2018 coincided with a drop in both area harvested and yields of most fresh-market vegetables—partially driven by above average heat during the growing season. In contrast, production of processed vegetables grew by over 7 percent in from 2017 to 2018. The increase was almost entirely due to a 17-percent increase in tomato production, which made up 75 percent of processed vegetable volume in the United States. Divergent trends in the latest year’s production of fresh and processed vegetables can be partially explained by differing states and crop mixes, and each represent a return to approximately 4-year ago levels. Although pulse production is much smaller on a volume basis, production growth relative to 2017 was equally strong. Driven mainly by increases in chickpea production, production of pulses (e.g., chickpeas, lentils, and dry beans) grew by nearly 7 percent from 2017 to 2018. This chart appears in the ERS Vegetables and Pulses Outlook newsletter, released in May 2019.
Monday, November 5, 2018
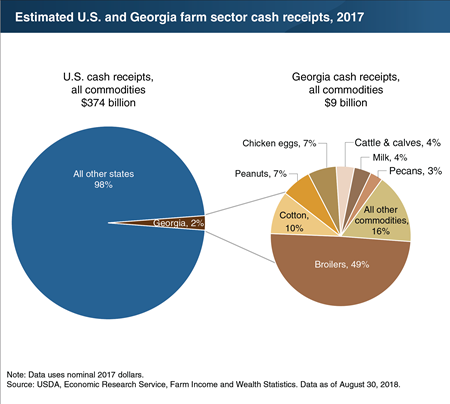
Each August, ERS estimates the previous year’s farm sector cash receipts—the cash income received from agricultural commodity sales. Historical State-level estimates provide baseline information that can be useful in gauging the financial impact of unexpected events that affect the agricultural sector, such as the recent hurricane that struck Georgia and surrounding States. In 2017, cash receipts for all U.S. farm commodities totaled $374 billion. Georgia contributed about 2 percent ($9 billion) of that total, ranking 15th among all States. Broilers (chickens that are raised for meat) accounted for the largest share of cash receipts in Georgia at $4.4 billion (49 percent of Georgia’s cash receipts)—followed by cotton at $878 million (10 percent of Georgia’s receipts. Georgia led the Nation in cash receipts from broilers and ranked second in cotton cash receipts, behind Texas. Georgia also led the country in cash receipts from peanuts and pecans—accounting for 47 percent and 38 percent, respectively, of the U.S. totals for those commodities—although they amounted to a smaller share of the State’s total cash receipts. This chart uses data from the ERS U.S. and State-Level Farm Income and Wealth Statistics data product, updated August 2018.


