ERS Charts of Note
Subscribe to get highlights from our current and past research, Monday through Friday, or see our privacy policy.
Get the latest charts via email, or on our mobile app for  and
and 
Wednesday, September 13, 2017
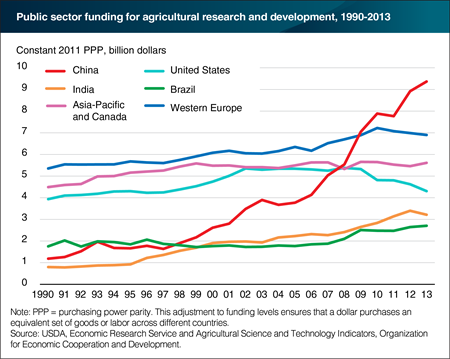
U.S. public sector funding for agricultural R&D is falling, both in absolute terms and relative to major countries and regions. Between 1990 and 2013, the U.S. share of spending among nations with major public agricultural R&D investments fell from about 23 to 13 percent. This decline was driven by a combination of falling U.S. spending (lately mirrored in Western Europe) and rapidly rising spending in developing countries such as India and, especially, China. Chinese government spending on agricultural R&D rose nearly eightfold in real (inflation-adjusted) terms between 1990 and 2013, surpassing U.S. spending in 2008 and more than doubling it in 2013. In simple dollar terms, the decline in U.S. public sector funding has been more than offset by a rise in U.S. private research spending, but the two are not substitutes, as each tends to specialize in different kinds of R&D. This chart appears in the November 2016 Amber Waves feature, "U.S. Agricultural R&D in an Era of Falling Public Funding."
Thursday, May 11, 2017
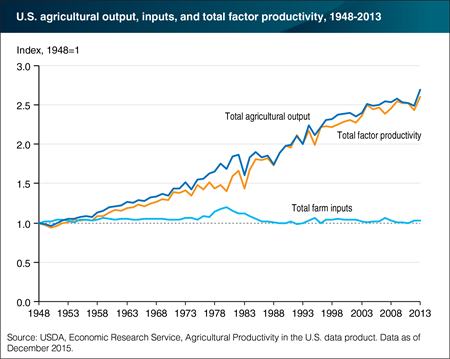
From 1948 to 2013, U.S. farm sector output grew by 170 percent with about the same level of farm input use over the period. This output growth resulted mainly from gains in productivity, as measured by total factor productivity (TFP)—the difference between the growth of aggregate output and growth of aggregate inputs (such as land and labor). Between 1948 and 2013, total output grew at an average annual rate of 1.52 percent, agricultural TFP at 1.47 percent, and input use at only 0.05 percent. Long-term agricultural productivity is fueled by innovations in animal/crop genetics, chemicals, equipment, and farm organization that result from public and private research and development. This chart appears in the ERS publication Selected charts from Ag and Food Statistics: Charting the Essentials, 2017, released April 28, 2017.
Wednesday, October 12, 2016
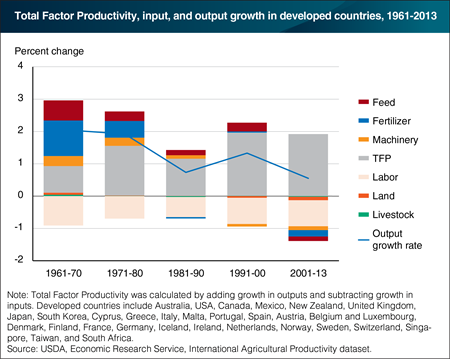
Boosting agricultural productivity—producing more output from fewer inputs—is key to meeting expanding global food needs. Total Factor Productivity (TPF) offers a complete measure of agricultural performance, accounting for all of the land, labor, capital, and material resources used in the production process. Since the 1960s, agricultural TFP in developed countries has compensated for declining input use as output growth slowed. In more years, between 2001 and 2013, input growth in these countries declined across all factors of production for the first time. ERS estimates TFP growth using data from the Food and Agriculture Organization of the United Nations. This chart uses data from the ERS International Agricultural Productivity dataset.
Wednesday, September 14, 2016
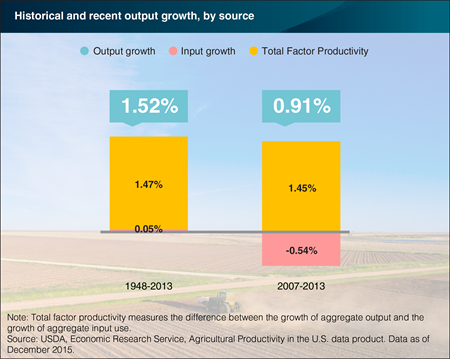
U.S. agricultural output more than doubled between 1948 and 2013, growing on average at 1.52 percent annually. Total input use (for example, land, labor and materials such as seed and feed) grew at only 0.05 percent per year on average. Improvements in how efficiently inputs are transformed into outputs, known as Total Factor Productivity (TFP), fueled almost all of the output growth. Advancements in technology—such as improvements to machinery, seeds, and farm structures—enabled agricultural TFP to grow an average of 1.47 percent annually. This rate exceeded the productivity growth of most U.S. industries, according to data from the U.S. Bureau of Labor Statistics. In recent years, between 2007 and 2013, TFP growth has kept up with its historic rate. This strong productivity growth has offset the decline in the use of agricultural inputs, allowing agricultural output to continue to grow by 0.91 percent annually. A version of this chart is found in the September 2016 Amber Waves feature, "Productivity Growth Is Still the Major Driver in Growing U.S. Agricultural Output".
Thursday, August 18, 2016
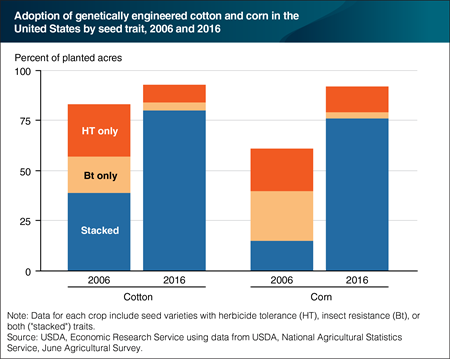
Genetically engineered (GE) seeds are widely used in U.S. field crop production. Herbicide-tolerant (HT) crops were developed to survive the application of certain herbicides that previously would have destroyed the crop along with the targeted weeds. Insect-resistant crops contain a gene from the soil bacterium Bacillus thuringiensis (Bt) that produces a protein that is toxic to specific insects. Seeds that have both herbicide-tolerant and insect-resistant traits are referred to as “stacked.” Recent data show that the adoption of stacked corn varieties has increased from 15 percent of U.S. corn acres in 2006 to 76 percent in 2016. Adoption rates for stacked cotton varieties have also grown, from 39 percent in 2006 to 80 percent in 2016. Generally, many different GE traits—each aimed at a specific herbicide or insect—can be stacked; varieties with three or four GE traits are now common. Research suggests that stacked corn seeds have higher yields than conventional seeds or seeds with only one GE trait. This chart is based on data found in the ERS data product, Adoption of Genetically Engineered Crops in the U.S., updated July 2016.
Monday, July 25, 2016
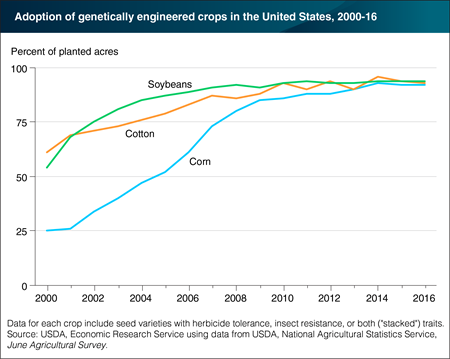
U.S. soybeans, cotton and corn farmers have nearly universally adopted genetically engineered (GE) seeds in recent years, despite their typically higher prices. Herbicide-tolerant (HT) crops, developed to survive the application of specific herbicides that previously would have destroyed the crop along with the targeted weeds, provide farmers with a broader variety of options for weed control. Insect-resistant crops (Bt) contain a gene from the soil bacterium Bacillus thuringiensis that produces a protein toxic to specific insects, protecting the plant over its entire life. “Stacked” seed varieties carry both HT and Bt traits, and now account for a large majority of GE corn and cotton seeds. In 2016, adoption of GE varieties, including those with herbicide tolerance, insect resistance, or stacked traits, accounted for 94 percent of soybean acreage (soybeans have only HT varieties), 93 percent of cotton acreage, and 92 percent of corn acreage planted in the United States. This chart is found in the ERS data product, Adoption of Genetically Engineered Crops in the U.S., updated July 2016.
Thursday, March 24, 2016
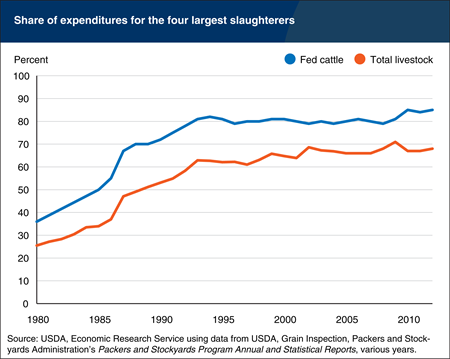
Concentration levels in many U.S. agricultural markets have risen in recent decades, resulting in fewer buyers accounting for a growing share of purchases of agricultural commodities. This is particularly true for livestock markets. The four largest packers now account for nearly 70 percent of the value of all livestock purchased for slaughter, compared to 26 percent in 1980. For fed cattle, the concentration level is even higher, as the share of the top four firms increased from 36 percent to 85 percent between 1980 and 2012. This chart is from the ERS report, Thinning Markets in U.S. Agriculture: What are the Implications for Producers and Processors?
Wednesday, January 27, 2016
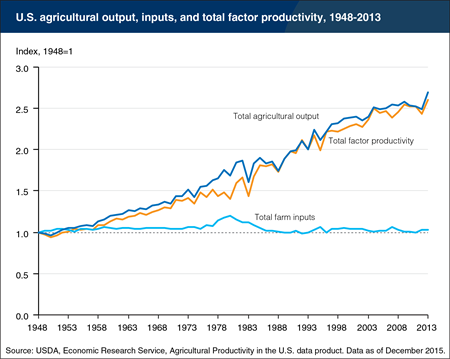
Agricultural total factor productivity (TFP) is the difference between the aggregate total output of crop/livestock commodities and the combined use of land, labor, capital and material inputs employed in farm production. Growth in TFP implies that the adoption of new technology or improved management of farm resources is increasing average productivity or efficiency of input use. From 1948 to 2013, U.S. farm sector output grew by 170 percent with about the same level of farm input use over the period, and thus the positive growth in farm sector production was substantially due to productivity growth. While aggregate input use in agriculture has been relatively stable over time, the composition of agricultural inputs (not shown in this chart) has shifted. Between 1948 and 2013, labor use declined sharply by 78 percent, land use in agriculture dropped by 26 percent, while the use of intermediate goods (such as energy, agricultural chemicals, purchased services, and seed/feed) and capital (farm machinery and buildings) expanded. Long-term agricultural productivity is fueled by innovations in animal/crop genetics, chemicals, equipment, and farm organization that result from public and private research and development. This chart is found in the ERS data product Agricultural Productivity in the U.S., updated December 2015.
Wednesday, December 16, 2015
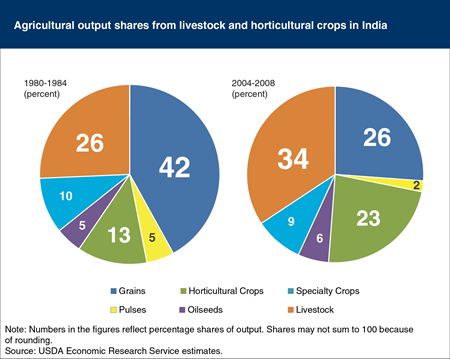
India’s economic growth and rising incomes have expanded consumer food demand to include higher valued foods, such as fruit, vegetables, and some meat products. Indian farmers appear to be meeting these new growth opportunities. A look at average production shares in the 1980-84 and the 2004-08 periods shows that growth in production of animal and horticulture products reduced the share of production growth attributable to grains. Accordingly, India’s real value of farm production increased an average 3 percent each year, rising from 2.6 trillion rupees in 1980 to 7.3 trillion rupees in 2008, or from $42 billion to $116 billion. This chart is based on Propellers of Agricultural Productivity in India, December 2015.
Monday, November 16, 2015
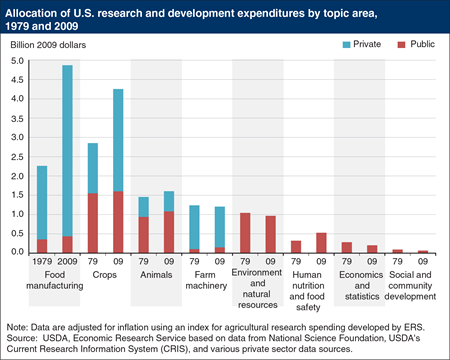
Across a broad range of topics for agriculture, food, and related issues, research and development (R&D) conducted by U.S. public research institutions (State and Federal institutions) tends to emphasize different themes than R&D conducted by private firms. The two sectors have overlapping research interests in areas related to farm production—crop, animal, and farm machinery innovation. However, in areas where reaping benefits from research results is more difficult for private firms—such as in the environmental impacts of agriculture, and human nutrition/food safety—public sector research dominates. The private sector tends to focus on areas such as food manufacturing, where research benefits are more readily captured by the specific innovator. Much of the private expenditures on food R&D, which does not directly affect farm-level productivity, is on new product development rather than on improved food manufacturing processes. New technologies such as gene transfer, along with intellectual property protection, have increased private incentives for crops research, and private crop research investment has grown. This chart appears in the ERS research report, Agricultural Productivity Growth in the United States: Measurement, Trends, and Drivers, ERR-189, released July 2015.
Friday, October 23, 2015
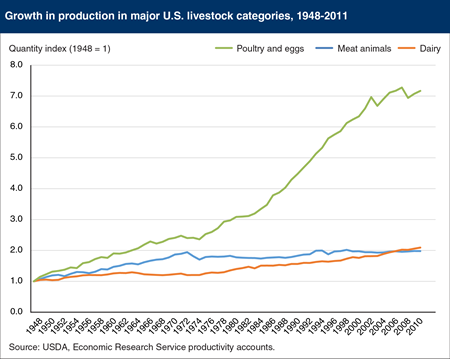
Total U.S. livestock output grew 130 percent from 1948 to 2011, with the poultry and eggs subcategory growing much faster than meat animals (including cattle, hogs, and lamb) and dairy products. In 2011, the real value of total poultry and egg production was more than seven times its level in 1948, with an average annual growth rate exceeding 3 percent. The rapid growth of poultry production is due largely to changes in technology—advances in genetics, feed formulations, housing, and practices—and increased consumer demand. Retail prices of poultry fell in the late 1970’s and 1980’s, relative to beef and pork prices, leading to expanded poultry consumption in that period. Increased domestic consumption and exports were also driven by consumer response to an expanding range of new poultry products, as the industry moved away from a reliance on whole birds and production shifted to cut-up parts and processed products such as boneless chicken, breaded nuggets/tenders, and chicken sausages. This chart is found in the ERS report, Agricultural Productivity Growth in the United States: Measurement, Trends, and Drivers, July 2015.
Friday, October 16, 2015
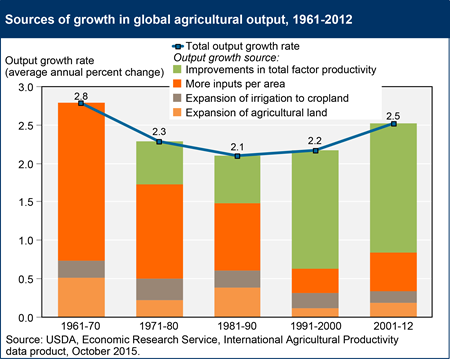
The average annual rate of global agricultural output growth slowed in the 1970s and 1980s, then accelerated in the 1990s and 2000s. In the latest period estimated (2001-12), global output of total crop and livestock commodities was expanding at an average rate of 2.5 percent per year. In the decades prior to 1990, most output growth came about from intensification of input use (i.e., using more labor, capital, and material inputs per acre of agricultural land). Bringing new land into agriculture production and extending irrigation to existing agricultural land were also important sources of growth. This changed over the last two decades, as input growth slowed. In 2001-12, improvements in productivity—getting more output from existing resources—accounted for about two-thirds of the total growth in agricultural output worldwide, reflecting the use of new technology and changes in management practices by agricultural producers around the world. This chart is based on the ERS data product, International Agricultural Productivity, updated October 2015.
Monday, October 5, 2015
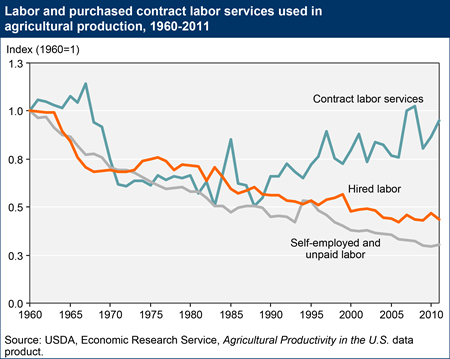
Agricultural technologies adopted over the last half-century, embodied in equipment, structures, seeds, and chemicals, allow farmers to use less labor. As a result, even though total agricultural production more than doubled between 1960 and 2011 (the latest estimates available), the amount of self-employed labor in agriculture fell by 70 percent, and the amount of hired labor fell by 60 percent. While most labor used on farms comes from the self-employed labor of farm families and hired labor (full and part-time employees), farmers also hire labor contractors to provide labor to farms, usually for specific tasks. Contract labor accounted for 1.2 percent of total costs in agriculture in 2011, compared to 13 percent for self-employed and hired labor. While the use of contract labor declined by half between 1960 and the mid-1980’s, tracking the decline in self-employed and hired labor, it has since grown as some farmers have shifted to contract labor in place of hired labor. A version of this chart is found in the ERS report, Agricultural Productivity Growth in the United States: Measurement, Trends, and Drivers, July 2015.
Tuesday, September 15, 2015
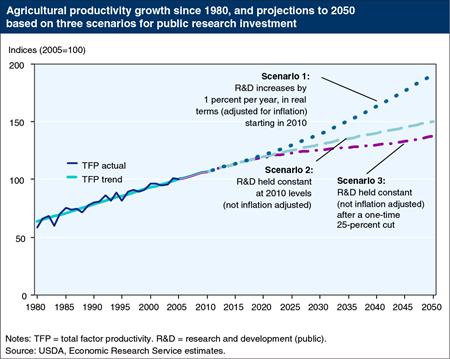
Innovation funded by research and development (R&D) investment is the major driver of long-term agricultural productivity growth. ERS projected growth in agricultural productivity (measured as total factor productivity, or TFP) under alternative public R&D assumptions starting in 2010: a 1-percent increase in annual public research funding in real terms (Scenario 1); constant nominal public research funding (Scenario 2); and constant nominal public research funding with an assumed one-time 25-percent cut in 2014, followed by constant nominal funding at the lower level (Scenario 3). Because R&D takes a long time to bear fruit, TFP growth differs little among the scenarios in the first decade, but then growth rates diverge. From 2010 to 2050, the annual rate of TFP growth is expected to increase/fall from the historical average of 1.42 percent per year to 1.46, 0.86, and 0.63 percent for Scenario 1, 2, and 3, respectively. This chart is found in the September 2015 Amber Waves feature, "U.S. Agricultural Productivity Growth: The Past, Challenges, and the Future."
Tuesday, August 18, 2015
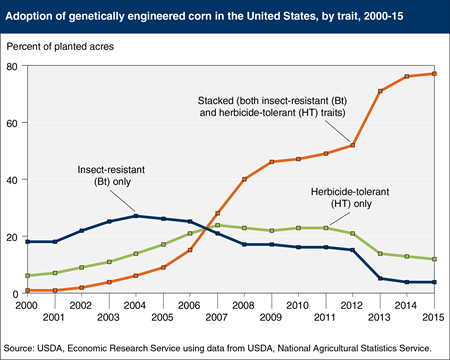
U.S. farmers have embraced genetically engineered (GE) seeds in the 20 years since their commercial introduction. Herbicide-tolerant (HT) crops, developed to survive application of specific herbicides that previously would have destroyed the crop along with the targeted weeds, provide farmers with a broader variety of options for effective weed control. Insect-resistant crops contain a gene from the soil bacterium Bacillus thuringiensis (Bt) that produces a protein that is toxic to specific insects, protecting the plant over its entire life. Seeds that have both herbicide-tolerant and insect-resistant traits are referred to as “stacked.” Based on USDA survey data, adoption of stacked GE corn varieties has increased sharply, reaching 77 percent of planted corn acres in 2015. Conversely, use of Bt-only corn dropped from 27 percent of planted corn acreage in 2004 to 4 percent in 2015, while HT-only corn dropped from 24 percent of planted corn acreage in 2007 to 12 percent in 2015. Generally, stacked seeds (seeds with more than one GE trait) tend to have higher yields than conventional seeds or seeds with only one GE trait. This chart is based on the ERS data product, Adoption of Genetically Engineered Crops in the U.S., updated July 2015.
Monday, August 10, 2015
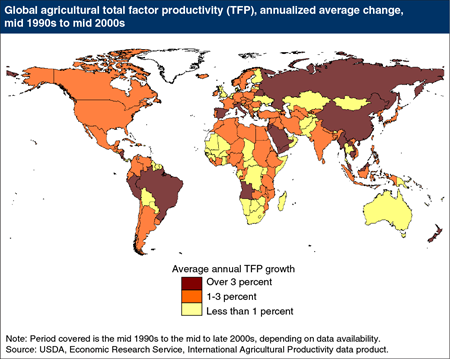
Agricultural total factor productivity (TFP) is the difference between the aggregate total output of crop/livestock commodities and the combined use of land, labor, capital and material inputs employed in farm production. Growth in TFP implies that the adoption of new technology or improved management of farm resources is increasing average productivity or efficiency of input use. Worldwide, agricultural TFP grew at an average annual rate of 1.7 percent during of 2002-11, the latest decade for which figures are available. However, not all countries are achieving growth in agricultural TFP. Among developing countries, some large countries like China and Brazil are improving their agricultural TFP rapidly, but many countries in Sub-Saharan Africa are lagging behind. Most developed countries are continuing to achieve moderate rates of agricultural TFP growth, but some, such as the UK and Australia, have experienced a slowdown in TFP growth. Maintaining growth in agricultural TFP is necessary for achieving global food security goals and could help preserve natural resources. This map is based on data from ERS’ International Agricultural Productivity accounts.
Monday, July 27, 2015
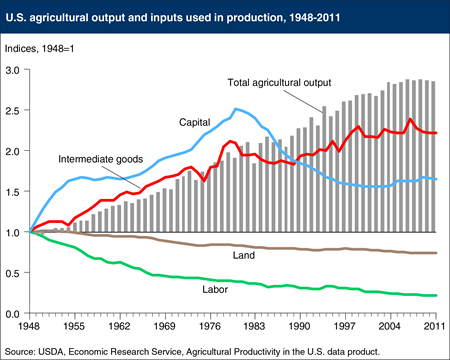
U.S. farm output more than doubled between 1948 and 2011, while aggregate agricultural inputs increased by just 4 percent. However, the composition of agricultural inputs shifted. Between 1948 and 2011, labor use declined by 78 percent, while total land input dropped by 26 percent. The agricultural sector’s consumption of intermediate goods (such as energy, agricultural chemicals, purchased services, and seed/feed) grew by 140 percent, while capital inputs (equipment, buildings, and inventories) increased by 65 percent. The shift in the input mix away from labor and toward machinery and intermediate inputs reflects trends in relative prices, which dropped significantly relative to labor between 1948 and 2011. After 1980, the use of capital inputs fell, while the growth in intermediate inputs slowed considerably. Total agricultural input use fell by 15 percent in 1980-2011, even as output continued to grow. This chart is found in the ERS report, Agricultural Productivity Growth in the United States: Measurement, Trends, and Drivers, July 2015.
Monday, July 20, 2015
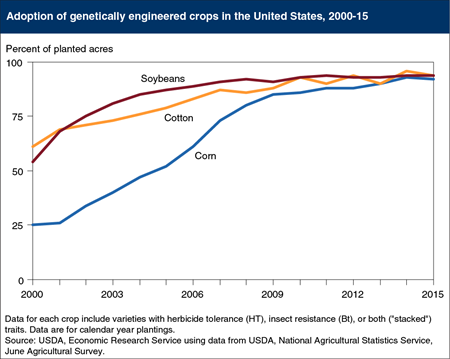
U.S. farmers have adopted genetically engineered (GE) seeds in the 20 years since their commercial introduction, despite their typically higher prices. Herbicide-tolerant (HT) crops, developed to survive the application of specific herbicides that previously would have destroyed the crop along with the targeted weeds, provide farmers with a broader variety of options for weed control. Insect-resistant crops (Bt) contain a gene from the soil bacterium Bacillus thuringiensis that produces a protein toxic to specific insects, protecting the plant over its entire life. “Stacked” seed varieties carry both HT and Bt traits, and now account for a large majority of GE corn and cotton seeds. In 2015, adoption of GE varieties, including those with herbicide tolerance, insect resistance, or stacked traits, accounted for 94 percent of cotton acreage, 94 percent of soybean acreage (soybeans have only HT varieties), and 92 percent of corn acreage planted in the United States. This chart is found in the ERS data product, Adoption of Genetically Engineered Crops in the U.S., updated July 2015.
Monday, June 22, 2015
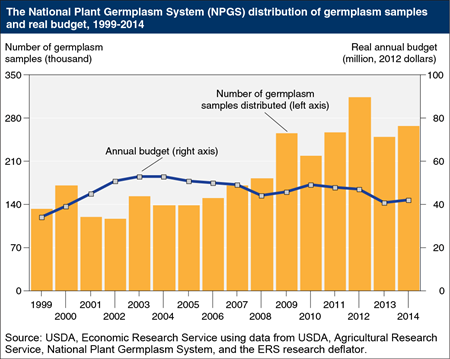
As agriculture adapts to climate change, crop genetic resources can be used to develop new plant varieties that are more tolerant of changing environmental conditions. Crop genetic resources (or germplasm) consist of seeds, plants, or plant parts that can be used in crop breeding, research, or conservation. The public sector plays an important role in collecting, conserving, and distributing crop genetic resources because private-sector incentives for crucial parts of these activities are limited. The U.S. National Plant Germplasm System (NPGS) is the primary network that manages publicly held crop germplasm in the United States. Since 2003, demand for crop genetic resources from the NPGS has increased rapidly even as the NPGS budget has declined in real dollars. By way of comparison, the NPGS budget of approximately $47 million in 2012 was well under one-half of 1 percent of the U.S. seed market (measured as the value of farmers’ purchased seed) which exceeded $20 billion for the same year. This chart updates ones found in the June 2015 Amber Waves feature, Crop Genetic Resources May Play an Increasing Role in Agricultural Adaptation to Climate Change.
_450px.png?v=3595.3)
Wednesday, March 11, 2015
By using new technologies, farmers can produce more food using fewer economic resources at lower costs. One measure of technological change is total factor productivity (TFP). Increased TFP means that fewer economic resources (land, labor, capital and materials) are needed to produce a given amount of economic output. However, TFP does not account for the environmental impacts of agricultural production; resources that are free to the farm sector (such as water quality, greenhouse gas emissions, biodiversity) are not typically included in TFP. As a result, TFP indexes may over- or under-estimate the actual resource savings from technological change. Growth in global agricultural TFP began to accelerate in the 1980s, led by large developing countries like China and Brazil. This growth helped keep food prices down even as global demand surged. This chart uses data available in International Agricultural Productivity on the ERS website, updated October 2014.


